Karolinska Institutet, Stockholm, Sweden
MASS SPECTROMETRY BASED
PROTEOMICS: DATA ANALYSIS AND
APPLICATIONS
Yafeng Zhu
All previously published papers were reproduced with permission from the publisher. Published by Karolinska Institutet.
Printed by E-print AB 2018 © Yafeng Zhu, 2018 ISBN 978-91-7831-044-9
applications
THESIS FOR DOCTORAL DEGREE (Ph.D.)
ByYafeng Zhu
Principal Supervisor:Professor Janne Lehtiö, Ph.D. Karolinska Institutet Department of Oncology-Pathology Co-supervisor(s): Jenny Forshed, Ph.D., M.D Karolinska Institutet Department of Oncology-Pathology Opponent:
Professor David Fenyö NYU School of Medicine
Department of Biochemistry and Molecular Pharmacology
Examination Board:
Johan Malmström Lund University
Division of Infection Medicine
Sara Lind
Uppsala University Department of Chemistry Lisa Klasson
Uppsala University
Department of Cell and Molecular Biology
The public defense of this thesis will take place
9:00 am, Friday, 25th May, 2018
CMB föreläsningssalen Berzelius väg 21
做学问的三重境界: “昨夜西风凋碧树, 独上高楼, 望尽天涯路” 此第一境也。 “衣带渐宽终不悔, 为伊消得人憔悴” 此第二境也。 “纵里寻他千百度, 蓦然回首, 那人却在灯火阑珊处” 此第三境也。 古之学问大成者,罔不历此三重境界。 ——王国维 《人间词话》 古人之境界,欣然往之, 虽徐徐不能近,以此勉励。
ABSTRACT
Mass spectrometry (MS) based proteomics has become a widely used high throughput method to investigate protein expression and functional regulation. From being able to study only dozens of proteins, state-of-art MS proteomic techniques are now able to identify and quantify ten thousand proteins. Nevertheless, MS proteomics are facing problems investigating protein variants derived from alternative splicing, detecting peptides from novel coding sequences, identifying peptide variants from genetic changes and statistical analysis of quantitative proteome. The work present in this thesis start from these problems and contribute solutions to them.
In standard shotgun proteomics studies, protein identifications are inferred from a list of identified peptides using Occam Razor’s rule, which outputs a minimum list of proteins sufficient to explain peptide evidences. The protein inference process creates a potential problem in protein level quantification, resulting mixture of quantitative signals from different
splice variants if the inferred proteins do not correctly represent the peptide populations. Paper
I present a tool to investigate splice variants using MS proteomics data. By clustering the
quantitative pattern of peptides and showing their transcript positions, it is able to reveal splice variants specific peptides with different quantitative signal. The tool was applied to a comprehensive proteomics data of A431 cells treated with Gefitinib (EGFR inhibitor). For certain genes, we observed splice-variant-centric quantification differs from traditional protein-centric or gene-protein-centric quantification, suggesting differentially regulated splice variants after Gefitinib treatment.
Previously, MS proteomics has been used to refine genome annotation. However, the
applications were limited to validate and confirm predicted gene models. In Paper II, we
demonstrate an integrative genome annotation workflow that combines MS proteomics data and RNA-sequencing to perform evidence-based whole genome annotation of a newly sequenced commensal yeast. The workflow showed higher accuracy of protein coding gene annotation compared to conventional way of using only RNA-sequencing data. The study exemplifies that proteomics data used in combination with RNA-seq data is able to produce a more accurate and complete whole genome annotation.
Paper III shows an integrative proteogenomics analysis workflow. Compared to standard proteomics which analyzes known proteins in reference database, proteogenomics aims to discover peptides from novel coding sequences and disease relevant mutations. To identify novel coding sequences in well annotated genomes, such as human, it is particular challenging due to several reasons. First, protein-coding sequences in the human genome consists of only 2%-3% of the total sequences. There are approximately one million peptides from known coding genes, and the novel peptides from undiscovered coding loci constitutes a minor part of the total peptide population. That means the vast majority of experimental spectra are produced from known peptides. Identification of peptides with MS proteomics technique relies on correct
matching between experimental spectra to in silico generated spectra of the peptides in search
space. Detecting of novel peptides requires correct spectra matching for both known and novel peptides, and the process is doomed to produce false positives. Previously, conservative criteria
and manual curation has been applied to ensure the quality of findings. Paper III presents a
workflow which improves the reliability of proteogenomics findings by automated extensive data curation and evidence searching in orthogonal data. In analysis of the proteomics data of a cancer cell line and five normal human tissues, the workflow successfully detected novel peptides from unknown coding regions and peptide variants from non-synonymous single
nucleotide polymorphisms (nsSNPs) and mutations, with multiple sources of evidence provided. Moreover, our quantitative MS data indicated that certain pseudogenes and lncRNAs were expressed and translated in tissue-specific manner.
Paper IV addresses the statistical analysis of quantitative proteomics. Currently, there is no consensus in the usage of statistical methods to analyze labelled and label-free proteomics data. One of the main reasons is the lack of statistical tool with high performance, ease to use, and broad applicability to various proteomics datasets. The presented statistical method, DEqMS, is a robust and universal tool to assess differential protein expression for quantitative MS proteomics. DEqMS takes into account the variance dependence on the number of peptides/PSMs used for protein quantification in statistical significance test. Compared to existing methods in several benchmarking datasets, DEqMS was demonstrated with both high statistical accuracy and general applicability.
In summary, the work included in this thesis contributes with improved data interpretation and applications of MS proteomics data in analysis of splice variants, genome annotation, proteogenomics studies and statistical analysis of protein expression changes. Development of these methods facilitate a wide range of applications of MS proteomics data in the systems biology research.
LIST OF SCIENTIFIC PAPERS
I. Yafeng Zhu, Lina Hultin-Rosenberg, Jenny Forshed, Rui M. M. Branca, Lukas M. Orre, and Janne Lehtiö.
SpliceVista, a tool for splice variant identification and visualization in shotgun
proteomics data. Molecular & Cellular Proteomics 2014 Jun;13(6):1552-62.
II. Yafeng Zhu§, Pär G Engström§, Christian Tellgren-Roth, Charles Baudo, John C Kennell, Sheng Sun, R. Blake Billmyre, Markus S. Schröder, Anna Andersson, Tina Holm, Benjamin Sigurgeirsson, Guangxi Wu, Sundar Ram Sankaranarayanan, Rahul Siddharthan, Kaustuv Sanyal, Joakim Lundeberg, Björn Nystedt, Teun Boekhout, Thomas L Dawson Jr., Joseph Heitman, Annika Scheynius*, Janne Lehtiö*.
Proteogenomics produces comprehensive and highly accurate protein-coding gene annotation in a complete genome assembly of Malassezia sympodialis.
Nucleic Acids Research, 2017 Mar 17;45(5):2629-2643.
§ These authors contributed equally to this work as the first authors.
III. Yafeng Zhu, Lukas M. Orre, Henrik J. Johansson, Mikael Huss, Jorrit Boekel,
Mattias Vesterlund, Alejandro Fernandez-Woodbridge, Rui M. M. Branca* & Janne Lehtiö*.
Discovery of coding regions in human genome using an integrated
proteogenomics analysis workflow. Nature Communications. 2018 Mar
2;9(1):903.
IV. Yafeng Zhu, Lukas M. Orre, Georgios Mermelekas, Henrik J. Johansson, Alina Malyutina, Simon Anders, Janne Lehtiö.
DEqMS: a robust and universal statistical method for quantitative mass
TABLE OF CONTENTS
INTRODUCTION ... 1
FROM GENOMICS TO PROTEOMICS ... 1
MASS SPECTROMETRY ... 1
Soft ionization methods for peptide and protein... 2
MS-BASED PROTEOMICS ... 3
Comprehensive peptide pre-fractionation increases proteome coverage ... 3
Identify peptide sequences from mass spectra ... 5
Error rate in peptide and protein identifications ... 6
Protein inference ... 6
QUANTITATIVE MS PROTEOMICS ... 7
Label free protein quantification ... 7
Protein quantification by labelling ... 7
Stable isotope labelling by amino acids in cell culture (SILAC) ... 8
Isobaric labelling by iTRAQ and TMT ... 8
STATISTICAL ANALYSIS OF QUANTITATIVE MS PROTEOMICS ... 8
Methods for protein abundance summarization ... 9
Statistical methods to assessdifferential protein expression ... 9
PROTEOGENOMICS – BRIDGING BETWEEN GENOMICS AND PROTEOMICS ... 9
Proteogenomics database... 10
False discovery rate of proteogenomics findings ... 11
Curation of proteogenomics findings... 11
AIMS AND OBJETIVES OF THE PRESENT THESIS... 12
RESULTS AND DISCUSSION... 13
CONCLUDING REMARKS AND FUTURE PERSPECTIVES ... 22
CONCLUDING REMARKS ... 22
FUTURE PERSPECTIVES ... 22
ACHKNOWLEDGEMENTS ... 24
LIST OF ABBREVIATIONS
MS Mass spectrometry
TOF Time-of-flight
MALDI Matrix-assisted laser desorption ionization
ESI Electrospray ionization
LC Liquid chromatogram
DNA Deoxyribonucleic acid
RNA Ribonucleic acid
FASP Filter-aided sample preparation
SP3 Single-Pot Solid-Phase-enhanced Sample Preparation
SCX Strong cation exchange
IEF Isoelectric focusing
IPG Immobilized pH gradient
HiRIEF High resolution isoelectric focusing
hp-RP High pH reverse phase
lp-RP Low pH reverse phase
PTM Post-translational modification
PSM Peptide spectrum match
TDA Target decoy approach
FDR False discovery rate
AUC Area under curve
SILAC Stable isotope labelling by amino acids in cell culture
iTRAQ Isobaric tags for relative and absolute quantitation
TMT Tandem mass tag
PCA Principal component analysis
ANOVA Analysis of variance
LIMMA Linear models for microarray data
MAR Missing at random
TCGA The cancer genome atlas
ORF Open reading frame
COSMIC Catalogue of somatic mutations in cancer
INTRODUCTION
From genomics to proteomics
The word proteome, representing the whole set of cellular proteins, was first coined by Marc
Wilkins in 1996 when he carried out the analysis of 20 E.coli proteins using two-dimensional
(2-D) electrophoresis mass spectrometry (MS)[1]. As an analogy to genomics (study of the human genome), the term “proteomics” was later created in 1997 to describe the global study of complete protein components of cells[2].
With the development of next generation sequencing techniques in the last decade[3], genomics studies have advanced our understanding of genetic mechanisms underlying various type of cancers. Proteomics serves a complementary tool for researchers who investigate protein level regulation globally in a high throughput manner.
There are two alternative approaches for proteomics, antibody-based proteomics[4-8](also referred as affinity proteomics) and MS-based proteomics[9-12]. Antibody-based proteomics relies on specific binding affinity between antibodies and their targets to detect and quantify the target proteins. This technique requires a list of predefined proteins to be measured and the availability of corresponding protein antibodies. MS-based proteomics is a hypothesis-free discovery approach to characterize proteins without dependence on antibodies. This thesis is mainly focused on MS-based proteomics.
Mass spectrometry
Mass Spectrometry (MS) is an analytical technique to measure the mass-to-charge ratio and intensity of charged molecules or particles. The direct readouts from a mass spectrometer are mass-to-charge ratio (m/z) values and their signal intensities, which are often visualized as a
mass spectrum with m/z values on the x-axis and intensities on the y-axis (Figure 1).
Figure 1. Illustration of a mass spectrum.
A mass spectrometer consists of three parts: ion source, mass analyzer and detector. Each of them is designated for a specific purpose. The ion source is to ionize the analytes so that they can be manipulated by magnetic or electric fields. Depending on the amount of energy that imparts on the analytes, ionization processes are divided into hard ionization and soft ionization. Hard ionization imparts high residual energy on the molecules causing more fragmentation (brakeage) within the molecules. In contrast, soft ionization imparts less residual energy and results in little fragmentation within the molecules. The function of a mass analyzer is to sort
charged molecules according to their m/z values. Analytes with different mass move in different
trajectories in electromagnetic filed according to Lorentz force law and Newton’s second law.
𝑭 = 𝑞(𝑬 + 𝝂 × 𝑩) 𝑭 = 𝑚𝒂 𝒂 = 𝑬 + 𝝂 × 𝑩𝑚/𝑞
The above formulas explain how ions are sorted in a mass analyzer. Equation 1 is Lorentz force
law where 𝑭 is referred to Lorentz force. 𝑞 is the ion charge, 𝑬 is the electric field, 𝝂 is the ion
velocity and 𝑩 is the magnetic field. Equation 2 is Newton’s second law where 𝑚 is the mass of the ion, 𝒂 is the acceleration calculated based on Equation 3. For ions entering the electromagnetic field with equal velocity, the acceleration depends only on mass-to-charge ratio. The same principles are implemented in different types of mass analyzer with different designs: time-of-flight (TOF) analyzer, quadrupole mass analyzers, and orbitrap. There are several characteristic parameters for mass analyzers: mass resolving power (resolution), mass accuracy and mass range. The mass resolution refers to the ability to distinguish two mass peaks
with slightly different m/z values. Resolving power is calculated as M/Dm (molecular mass
divided by peak width at half height). For the same instrument, peak width increases as the molecular mass of the analytes increase. The mass accuracy indicates the measurement error of m/z values compared to the true m/z. The mass range is the range of m/z that a mass analyzer is able to measure. The purpose of a detector is to record the ion current (signal intensity) produced when an ion hits its surface in TOF analyzer. In orbitrap analyzer, ions oscillate in high vacuum space around a central electrode (orbital motion) and horizontally in between two outer electrodes. The oscillation frequencies of different ions detected by the outer electrodes
are Fourier transformed into a mass spectrum. Orbitrap was the mass analyzer used in all
four Papers (I-IV).
The first attempt of using MS to identify amino acids (building bricks for proteins) was made by K. Biemann et al in 1959 in which they tried to identify structure formation of ethyl esters, derivatives of amino acids[13, 14]. At that time, the ionization techniques were not able to study large molecules using MS due to unintended fragmentation in the process. The problem was overcome by the development of fast atom bombardment ionization technique in 1980. In this “soft” ionization approach, macromolecules are hit by a beam of high-energy atom to generate intact ions[15-17]. This technique served as theoretical basis of two widely used ion sources, matrix-assisted laser desorption ionization (MALDI)[18] and electrospray ionization (ESI)[19], which made mass spectrometer applicable to analyze large biomolecules such as peptides and proteins.
Soft ionization methods for peptide and protein
As previously mentioned, matrix-assisted laser desorption ionization (MALDI)[18] and electrospray ionization (ESI)[19] are two widely used ion sources. In MALDI process, the matrix is prepared as a mixture of water and organic solvent (acidic) which serves as the proton donor to ionize the analytes. After the matrix is mixed with analytes, they are co-crystallized
Equation 1 Equation 2 Equation 3
on a metal plate. A pulsed laser is then added to irradiate the sample to trigger ionization process. The analytes carry single charge in MALDI process.
Electrospray ionization is able to ionize large biomolecules in solution, and it is commonly coupled with liquid chromatogram (LC) to analyze complex samples. Peptide mixtures are loaded into LC and separated according to hydrophobicity. Eluting peptides are dispersed by electrospray into small liquid droplets. As the droplets evaporate progressively and decrease in size, charges are split to smaller peptide droplets and finally into gas phase. In ESI process,
peptides get multiple charges. ESI was used as ion source in all four Papers (I-IV).
MS-based proteomics
MS-based proteomics is also known as shotgun proteomics. Similar to shotgun genomic where long double-strand DNA are broken to fragments prior to sequencing, shotgun proteomics starts by cleaving proteins into peptides, which then are analyzed by MS.
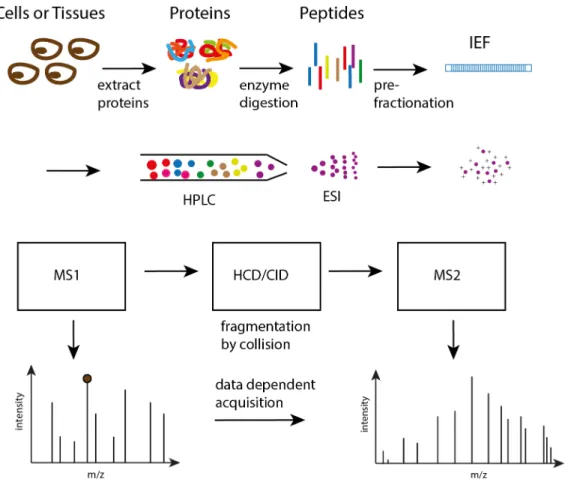
There are two commonly used sample preparation protocols for shotgun proteomics: filter-aided sample preparation (FASP)[20] and Single-Pot Solid-Phase-enhanced Sample Preparation (SP3)[21]. The workflow starts by extracting proteins from cell lysates. Proteins are then digested into peptides by proteolytic enzymes, such as trypsin. In many cases, peptide mixtures are subjected to a pre-fractionation step to reduce sample complexity before they are injected into LC-MS system. Peptides eluting out from LC are ionized in the ion source and then intact peptides are analyzed by MS, so called MS1 analysis. The m/z values of all peptide ions and their intensities are measured and depicted as MS1 spectrum. In data dependent acquisition (DDA) mode, a preset number of top intense peptides are selected for fragmentation, and an exclusion time period is set to avoid the instrument sampling the high abundant peptides redundantly. The fragmented product ions, MS2 ions, are analyzed in the second MS to acquire MS/MS (MS2) mass spectrum (Figure 2). MS2 spectrum is compared against computed spectra based on the peptide sequences in the search database. According to scoring function within the peptide search engine, the best matched peptide sequence will be assigned as the identity of the corresponding MS2 spectrum. Ideally, a pure MS2 spectrum that contains only product ions from one peptide is more likely to find a correct match. However, in analysis of complex samples, MS2 spectra usually suffer from precursor interference, resulted from impure selection
of peptides at the fragmentation step[22]. DDA mode was used in all four Papers (I-IV) to
acquire the experimental data.
Comprehensive peptide pre-fractionation increases proteome coverage
MS is usually coupled with LC to separate peptide mixtures based on hydrophobicity. The purpose is to avoid peptide competition in ionization process and reduce precursor interference. However, the separation capacity of LC can be saturated when analyzing complex peptide mixtures. Protein digestion of whole cell lysates generates complex peptide mixtures which span a concentration range of seven orders of magnitude[23, 24]. In plasma samples, the estimated dynamic range is even bigger, spanning ten orders of magnitude[25-27]. Peptides of some highly abundant proteins occupy most of the instrument time and create a noisy background to identify peptides from low abundant proteins. Therefore, more efficient orthogonal methods for peptide fractionation are needed to increase sensitivity.
Strong cation exchange (SCX) is able to separate peptides by charge states in addition to hydrophobicity in the LC. Since this method can be easily integrated online with LC system, peptide mixtures can be directly injected to start the analysis. This approach was demonstrated
to identify 1484 proteins from the proteome of Saccharomyces cerevisiae[28, 29]. The downside of SCX method is that sample desalting is required to avoid the negative effects of salts on the ionization process. Another method to pre-fractionate peptide mixtures is two-dimension LC (2D-LC) applying high pH reverse phase (hp-RP) in the first two-dimension and low pH reverse phase (lp-RP) in the second dimension[30]. Charge distribution of peptides at different pH conditions is changed and therefore it creates a different separation profile. This method was proved to provide separation orthogonality comparable to that of SCX-LC and allows concatenation of fractions in the first dimension to save analysis time with minimum reduction of protein identifications[30-32].
In GeLC-MS analysis, SDS-PAGE is used to separate protein lysates according to their molecular masses. Different protein bands are cut into fractions, followed by in gel digestion and LC-MS/MS analysis.
Gel-based isoelectric focusing (IEF) pre-fractionates peptide mixtures based on their isoelectric points using a polyacrylamide gel containing an immobilized pH gradient (IPG)[33-35]. Peptide IEF shows much higher resolution and reproducibility, whereas SCX method is more sensitive in the case of peptide and protein identifications at low sample amount (10 microgram)[36].
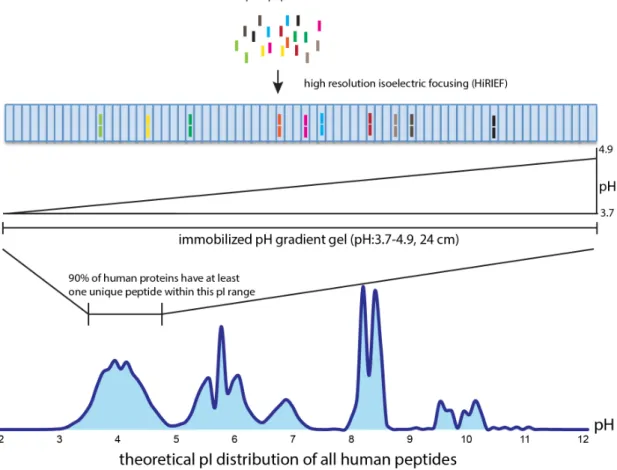
High resolution isoelectric focusing (HiRIEF) enables extensive separation of peptides on an immobilized pH gradient (IPG) strip which are further divided into 72 fractions[37], illustrated in Figure 3. HiRIEF coupled LC-MS was able to identify 13078 and 10637 proteins in human and mouse proteome[37]. However, this method requires long MS run time and affects protein sequence coverage after two-thirds of peptides are excluded. The recent HiRIEF method has been extended to cover peptides in pH range 3-10, which identifies more peptides and proteins
when used in combination with pH range 3.7-4.9[38]. The HiRIEF method was used in all
four studies (I - IV) to generate experimental MS data.
Figure 3. Illustration of HiRIEF method for separating complex peptide mixtures with minimum loss of proteome coverage.
To evaluate the analytical depth and dynamic range of proteome analysis, a simulation tool has been developed to assess the two global quality measurements and to guide better experimental design to enhance proteome analysis[39].
Identify peptide sequences from mass spectra
Unlike genome sequencing or RNA-sequencing by which the nucleotide sequences are direct readouts from the instruments, mass spectrometer generates mass spectra which contains mass over charge (m/z) values of each product ions fragmented from a certain peptide, called peptides’ mass “finger print”. In early 1990s, it was still a difficult task to solve the amino acid sequences based on peptide mass spectra. Only experienced mass spectrometry experts were able to perform this analysis and it was very time-consuming. In 1994, Jimmy K. et al developed an algorithm, named SEQUEST, which correlates tandem mass spectra to amino acid sequences in a given reference protein database[40]. Since then, many software have been developed to automate this process, such as Mascot[41], TANDEM[42], RADARS[43], Probity[44],
OMSSA[45], InSpecT[46], Andromeda[47], Morpheus[48], and MS-GF+[49-51]. Combination of multiple algorithms is likely to reduce false positive matches[52]. All of these peptide identification algorithms share a similar concept. A score is calculated for each peptide- spectrum match (PSM) to indicate the matching quality between experimental spectra and theoretical spectra of peptides in the search database. A mass spectrum is assigned with amino acid sequences of the peptide whose theoretical mass spectrum matches the best to the experimental mass spectrum. The peptide sequences are then used to infer which proteins are present in the samples. For mass spectra generated from co-fragmented peptides, it is difficult to revolve the amino acid sequences. To cope this problem, some tools have been developed to de-convolute the mass spectra of co-fragmented peptides and are possible to identify multiple
peptides from one spectrum[53]. SEQUEST was used in Paper I and Paper II, and MS-GF+
was used in Paper III and Paper IV for peptide identification.
Error rate in peptide and protein identifications
Scores of peptide-spectrum matches (PSMs) from database search only indicate how well the match between the observed and theoretical spectrum is, not telling if they are correct or incorrect matches. Through manual examination of PSMs with different scores, one can arbitrarily determine a score threshold to classify PSMs with equal or higher score than the threshold into correct matches and the remaining ones into incorrect matches. However, it is not trivial to find a threshold balancing well between sensitivity and specificity since search engines produce different scores and there is often an overlap of score distributions between correct and incorrect PSMs. Moreover, it poses a problem to compare results from different datasets that use different scoring functions[54]. In high throughput analysis of millions of spectra, it is important to accurately estimate error rate of peptide identifications from database search results.
Previously, a model of random spectra matching has been used to assess if a peptide-spectrum match scores higher than the scores expected from random matches[55]. Target decoy approach (TDA) provides an effective way to estimates false discovery rates in peptide identifications[56-58]. In this approach, a decoy database is created by reversing or shuffling protein sequences in the target database. The number of spectra matches to the decoy database is used to estimate the expected number of false positive matches. The false discovery rate is then calculated as the number of decoy hits divided by the number of target hits above a certain score threshold. The disadvantage of TDA is that error probabilities of individual PSMs are not known. A semi-supervised learning algorithm, Percolator, was developed to classify incorrect and correct PSMs that could be better distinguished by multiple scores and features instead of one single score threshold[59]. Percolator automatically generates a training set using top scored PSMs from the target database and PSMs from the decoy database to represent correct and incorrect matches respectively. A linear combination of several scores and features reported
from peptide search engines is used to train a support vector machine classifier[59]. Percolator
was used in all four Papers (I-IV). Protein inference
The final goal of proteomics study is to identify and quantify proteins. Due to the lost connection between proteins and peptides after digestion, it becomes difficult to correctly derive a list of proteins based on detected peptides, especially in the presence of “degenerate” peptides, which are shared by multiple proteins. This process is referred as protein inference[60-62]. One of the commonly used rules is the minimum set cover (Occam’s Razor) which infers
a minimum list of proteins that explains all peptide evidences. Occam’s Razor rule was used in all four Papers (I-IV) to infer the protein list.
The proteins inferred from peptides or PSMs with 1% FDR do not inherit the same error rate[63]. Because false matches spread evenly among different decoy proteins while correct peptides or PSMs accumulate over proteins truly present. This leads to an inflated protein FDR compared to that at PSM or peptide level[64]. Protein level false discovery rate is usually calculated as the expected number of false protein identifications divided by the total number of protein identifications from the target database. Different methods have been developed for protein inference and estimation of the error rates in protein identifications, such as ProteinProphet[65], MAYU[64], IDPicker[66] and Fido[67]. ProteinProphet computes a protein’s probability of being present in the samples on the basis of peptides’ probability assuming unique peptides are independently identified[65]. The statistical model takes into account two factors associated with error rates: proteins identified with multiple peptides are more likely to be true than single-hit proteins; a minimum list of proteins is reported to cover all observed peptide evidence. MAYU[64] and Picked FDR[68] are target decoy based methods to calculate protein level FDR, which are scalable to large datasets with better accuracy than the classical target decoy approach.
Picked FDR approach was used in Paper III to calculate protein level FDR.
Quantitative MS proteomics
Label free protein quantification
Spectra counting quantifies a protein according to the number of identified peptide-spectrum matches (PSMs) of this protein because more abundant peptides generate more fragment spectra and the number of PSMs is positively proportional to the protein amount[69]. Spectra counting was modified to integrate a normalization factor accounting for length of proteins, the number of observable peptides and expectation of observing peptides in an experiment[70-72]. Issues with spectra counting are statistical accuracy of comparing proteins with low spectra count and possible saturation effects of highly abundant proteins. An alternative method to spectra counting is to use peptide chromatographic peak area, referred as area under peak (AUC), which has been demonstrated to be linearly proportional to the concentration of
measured peptides (r2>0.99 in range of 10 fmol-100 pmol)[73]. Considerations of using AUC
are the technical variations such as retention time, peak intensity and noise level when samples are analyzed in different MS runs. Another issue using label free method is the poor overlap of protein identifications when analyzing many samples in different MS runs. Some tools have been developed to tackle this issue, such as MaxLFQ[74], which aligns peptide MS1 features between runs and therefore creates better overlap of protein identifications when multiple samples are analyzed in different MS runs.
Protein quantification by labelling
One of appealing advantages using labelling methods is that multiple samples can be analyzed in one MS experiment. Isotope-coded affinity tags (ICATs) was first used to label cysteine containing peptides[75]. Heavy ICAT reagent contains eight deuterium while the light form has no deuterium, creating a paired peptide peak with mass difference of 8 Da. Relative peptide abundance in two cell populations is calculated as the ratio of intensities of the paired peptides.
Stable isotope labelling by amino acids in cell culture (SILAC)
SILAC utilizes the normal metabolic process by culturing mammalian cells in the medium containing essential amino acids labelled by stable isotopes[76]. Two cell populations are cultured in two separate mediums, light medium containing normal amino acids and heavy
medium containing isotope labelled amino acids with 2H instead of H, 13C instead of 12C, or
15N instead of 14N, which create a known mass shift to the light peptides. SILAC is shown to
have no effect on cell morphology or growth rates[77, 78]. The ratio of peak intensities of paired heavy and light peptides indicates the relative protein abundance in two cell populations. SILAC method is limited to analyze living cells. Spike in SILAC samples as a standard can be applied to analyze tissue samples[79]. When analyzing complex tumor samples, one SILAC labelled cell line may not be representative. Super SILAC method uses several SILAC labelled cell lines together to generate more accurate protein quantification[80].
Isobaric labelling by iTRAQ and TMT
Stable isotope labelling methods were limited to analyze only two samples at the beginning. Its multiplexing capacity was increased later[81-83]. With SILAC methods, deuterium labelled peptides are slightly separated in chromatography compared to normal peptides. Moreover, the use of isotope to create paired peptide peaks with certain mass differences increases the complexity of MS1 spectra.
In contrast, iTRAQ uses isobaric reagents that always add a constant mass to peptides[84, 85]. The isobaric tag consists of three parts: a peptide reactive group linked to peptide’s N-terminal amine or amine at lysine, a mass balance group and a reporter group. The total mass of reporter
and balance group is constant while having different isotopes enrichment of 13C, 15N, and 18O
atoms. Since different isobaric tags add the same mass shift, peptides from different samples labelled with iTRAQ are indistinguishable in MS1. When peptides are fragmented in MS2, reporter ions of different isobaric tags dissociate from the peptides and appear in low mass region ranging from m/z 114.1 to 117.1[84]. Relative peptide abundance in different samples is calculated as the ratio of intensities of the reporter ions. iTRAQ was originally designed as
4-plex, now it has been extended to 8-plex[85]. In Paper I, iTRAQ 8-plex was used for
quantitative analysis.
Same as iTRAQ labelling, tandem mass tag (TMT) labelled peptides are also indistinguishable in MS1. When it was first presented, only comparison of two samples were allowed[86]. However, the multiplexing capacity was extended to 6-plex with newly designed reporter and
balance group[87]. The TMT reagents now allow multiplexing 11 samples together[88]. TMT
10-plex was used in paper III and IV for quantitative analysis.
Statistical analysis of quantitative MS proteomics
The distinctive structure and properties of MS proteomics data has differed its statistical analysis from other high throughput experiments such as RNA-seq and microarray, which are alternative methods for gene expression profiling. MS proteomics data has a hierarchical structure in which PSMs are repeated measurement of peptides and multiple peptides are detected for one protein. Moreover, peptides from one protein differs in signal intensity depending on ionization properties, digestion efficiency and other stochastic events.
Statistical methods in quantitative MS proteomics has been mostly solving two major problems: protein abundance summarization and significance test to assess differential protein expression.
Methods for protein abundance summarization
Although the quantification can be done at peptide level[89, 90], it has several drawbacks. The biological functions are carried out by proteins and not by tryptic peptides. Peptide level quantification is less accurate than protein level quantification which combines multiple peptides. Moreover, peptide level statistical test is prone to generate more false positives[91]. There are many different methods to combine peptide intensities into protein abundance estimate, including averaging, median sweeping[92, 93], weighted mean[94], total least squares[95], sum of intensities[96, 97], principal component analysis (PCA)[98], factor analysis[99, 100], linear model and mixed-effects model[101, 102]. However, protein inference process creates a potential problem in protein level quantification, resulting a mix of quantitative signals of peptides derived from different proteoforms or post-translational modifications. Methods like PQPQ[103] and Diffacto[100] can be used to curate outlier peptides with incoherent quantitative signals.
These methods have been tested and compared in different datasets[92, 96, 104]. It is not trivial to choose among these methods as they are demonstrated in different types of data. Understanding the underlying assumptions of different methods and examining the data distribution can indicate which methods to apply.
Statistical methods to assess differential protein expression
Traditional statistical methods such as t-test and ANOVA can be used to assess differential expression when protein abundance is estimated. Although t-test has several limitations such as applicable to only two classes comparison and lack of statistical power for high dimension data, it is still being used in recent proteomics studies[105-107], mainly because it is easy to implement. A moderated t-test, previously developed in Limma R package[108] to analyze microarray data has been recently suggested to analyze proteomics data[93, 109, 110]. Limma applies Bayesian approach to increase statistical power for experiments with small sample size by shrinking variance toward a pooled estimate. According to D’Angelo et al evaluation, Limma is preferred considering both sensitivity and specificity compared to general linear model (GLM) and mixed models in a TMT 10plex labelled proteomics dataset[93]. For label-free data sets which often contain many missing values, there are methods to impute the values for both missing not at random (MNAR) and missing at random (MAR)[111, 112]. A specific test has also been developed for label-free data to detect differentially expressed proteins without imputing values[113]. However, previous statistical methods have not taken into account the impact of the number of peptides on quantification accuracy which has been shown
in independent studies[94, 96]. Paper IV present a tool, DEqMS, which inherits the
advantage of Limma and provides an additional feature to account for the impact of the number of peptides on quantification when statistically assessing differential protein expression.
Proteogenomics – bridging between genomics and proteomics
With the development of MS instruments together with quantification methods and bioinformatics, MS-based proteomics has become a more mature technique for high throughput quantitative proteome analysis. The published first draft map of human proteome detected protein products of about 17,000 (84%) human protein-coding genes[114, 115], marking a milestone in MS proteomics study. In the meanwhile, the next generation sequencing
technology has become a widely accessible techniques to perform whole genome, exome and transcriptome analysis[116].
By integrating genomics and proteomics, proteogenomics has emerged as a powerful approach to study the interplay of genome and proteome, such as how chromosomal aberration and genetic mutations impact protein level regulation[37, 117-126]. In comparison to standard proteomics, which focuses only on canonical proteins in a reference protein database, the
primary goal of proteogenomics is to detect unusual peptides from unannotated or non-coding
loci, novel splicing, non-synonymous SNPs and mutations, chromosomal rearrangements and other aberrations in the genome. Such integrated proteogenomics analysis has been applied to characterize proteomic variation in colorectal cancer[127], ovarian cancer[128] and breast cancer[129, 130].
Proteogenomics database
Proteogenomics workflow consists of three major steps: database construction, peptide search, and curation of the results. Database construction is the first and vital step which determines
the types of unusual peptides to be detected. It is important to clearly define them before
conducting the search.
To discover peptides from unannotated or non-coding regions in genome, hypothetical peptides translated from genome sequences can be included in the search space. Six-frame translation search is an unbiased approach to discover coding regions in the genome, particularly useful in
species with compacted genome (high gene density). This approach was used in Paper II to
discover coding sequences in a newly sequenced commensal yeast genome. However, it is challenging to apply it in large genomes with majority of sequences being non-coding. For example, protein coding regions in the human genome consist a minor fraction, 2%-3%, and inclusion of hypothetical peptides from non-coding regions increases the search space several hundred times. It is challenging for peptide identification algorithms to find correct peptide-spectrum matches in a large database[119, 131]. The effect of increased database size on the reliability of peptide identifications is evaluated[132, 133]. Database reduction for species with large genome size such as human can increase the sensitivity of six-frame translation search. Peptide isoelectric focusing coupled LC-MS is a feasible method to reduce the peptide search database[33, 37]. Peptide spectra can be searched in a database restricted by the corresponding pI ranges in which the peptides are collected from the IPG strip. Therefore, the sensitivity and
specificity of peptide identifications is increased[33, 37]. Peptide isoelectric point restricted
database search was applied in Paper III to discover coding sequences in human genome.
Proteogenomics has been applied to refine genome annotation in many organisms such as
bacteria[134, 135], yeast[136], Drosophila melanogaster[137],Arabidopsis thaliana[138, 139],
mouse[140] and human[37, 141, 142]. RNA sequencing data is another commonly used resource to construct databases for proteogenomics studies, moreover it provides a sample specific peptide database from transcribed genes including splice junction sequences and missense variants[143-145]. Several tools have been developed specifically to facilitate peptide database construction from RNA-sequencing data[146, 147].
To detect variant peptides from cancer specific mutations, the search database can be generated from known mutations database such as COSMIC or detected variants from sequencing data. However, identification of variant peptides is an error prone process and suffers high risk of
false positives. Paper III contributes a tool, SpectrumAI, to reduce false discoveries by
peaks of the substituted amino acids. Whole-genome or whole exome sequencing from tumors and matched normal tissues can be used to construct a data supported variant database to increase the reliability of detecting tumor specific mutations by MS proteomics techniques. Many different bioinformatics tools have recently been developed for proteogenomics[148-156].
False discovery rate of proteogenomics findings
Estimation of false discovery rate (FDR) of proteogenomics findings is not trivial since the expected findings only consist of a minor fraction compared to peptide identifications from
known proteins[157]. The false discovery rate needs to be estimated separately for unusual and
known peptides, termed as novel only or class specific FDR[37, 119]. To calculate novel only FDR, target and decoy hits in known and novel search space are counted separately to have accurate estimate for the number of correct and incorrect matches of novel peptides. In practice, prior to FDR calculation, it is necessary to remove novel peptide hits resulted from the artefact changes of amino acids such as deamidation (asparagine to aspartic acid, glutamine to glutamic acid) and changes between isoleucine and leucine, to avoid underestimating the FDR by
populating the novel peptides with spurious hits.
Class specific FDR should be used as first step to reduce false novel peptide identifications. However, it is not sufficient to control the error rate. Because target decoy FDR calculation is heavily weighted on match scores reported by peptide search engines, incorrect peptides with partial sequences matched to theoretical spectra can still receive high scores and thus can pass certain FDR cutoff. These incorrect matches could arise from unexpected modified known peptides that possess the same molecular mass to the novel peptides.
Curation of proteogenomics findings
In the task of discovering novel peptides, the step after FDR calculation is to curate the candidates against a known protein database. Novel peptides can refer to peptides absent in reference protein databases, or peptides from supposedly non-coding gene or unannotated regions in the genome. Reference proteome databases such as Ensmebl and Uniprot contain predicted protein sequences from non-coding genes, of which no protein level evidence has been observed previously. A clear definition in the beginning will avoid incorrect tagging of known or novel peptides in subsequent filtering. In curation step, peptide variants derived from non-synonymous SNPs should not be considered as novel peptides. Additional evidence in orthogonal data, such as conservation, RNA-seq and ribosomal profiling data can be used to reinforce the confidence level of proteogenomics findings[158, 159].
AIMS AND OBJETIVES OF THE PRESENT THESIS
MS based proteomics provides an opportunity to advance our understanding of cancer biology by studying protein expression and regulation. Specifically, this thesis focuses on the data analysis and applications of MS based proteomics to generate valid biological information about the cellular and tissue proteome by using existing tools and further developing novel bioinformatics methods.
Specific objectives: Paper I:
Develop a bioinformatics tool to analyze splice variants at protein level using MS proteomics data.
Paper II:
Develop an integrative genome annotation pipeline combining proteomics and transcriptomics data and compare it with the conventional annotation approach.
Paper III:
Develop a proteogenomics pipeline to discover coding regions in the human genome and variant peptides derived from mutations and nsSNPs using MS proteomics data.
Paper IV:
Develop a robust statistical method to assess differential protein expression for both labelled and label-free proteomics data.
RESULTS AND DISCUSSION
Paper I - Splice variant analysis in MS proteomics
1. Based on in silico analysis of human peptidome, about 20 percent of splice variants are
theoretically possible to be identified with unique peptides using trypsin or lysC digestion.
2. Among the 7000 genes identified in A431 cell lines, about 600 genes have known splice
variants identified with unique peptides evidence.
3. Discrepancy was observed in comparison of gene centric, protein centric and splice
variant centric quantitative analysis. Several genes were shown to have differential splice variants regulation in A431 cells after treated with Gefitinib.
In MS-based proteomics, peptides are aggregated into proteins through the protein inference process which applies Occam’s Razor rule to report the minimum number of protein variants that are sufficient to explain all peptide evidences. Thereafter, the abundance of protein is estimated by averaging over the peptides (or by other weighted mean methods). In protein or gene centric analysis, there is a possibility that only one protein isoform is reported by the protein inference process, whereas in fact another shorter protein isoform is co-expressed. Depending on which protein isoform is more abundant, the summarized signal for protein and gene resembles the dominant protein isoform. When we developed and used our previous tool PQPQ[103] to curate quantitative proteomics data, we observed that a few high-quality peptides showed altered quantitative pattern compared to the bulk of peptides. And we hypothesized that these could be derived from splice variants, hence we explored this further by developing SpliceVista. With SpliceVista, it is possible to investigate if the group of peptides causing discrepant signal to gene centric analysis are derived from a specific splice variant undergoing differential regulation.
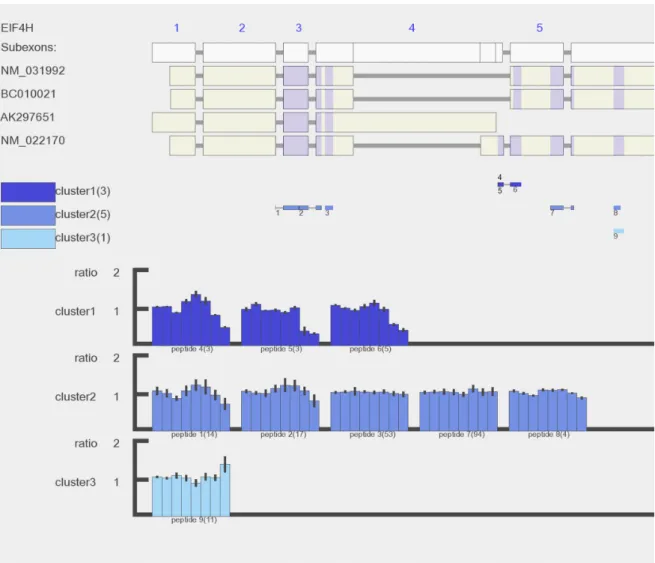
In this study, certain splice variants showed different quantification results to protein centric and gene centric analysis. An example is shown in Figure 4 where Protein NM_022170 was reported based on peptide evidences. However, three peptides in cluster 1 showed a different quantitative response after the treatment compared to the remaining peptides. Inspecting their positions in transcripts, these peptides map to the unique region from NM_022170 variant. The evidence indicated another protein isoform present in addition to NM_022170, and the other hidden protein isoform was more abundant and remained unchanged after the treatment. The recent work by Wang et al corroborated that detection of protein isoforms by MS-based proteomics is limited by trypsin cleavage specificity[160]. In addition, their conservation analysis showed that the trypsin cleavage sites, lysine and arginine, are more frequently observed in exon-ending and exon-exon junctions due to the evolutionally conserved nucleotide usage at splicing sites. As a consequence, it limits the detection of splicing junction peptides using trypsin as digestion enzyme. Using other enzymes, such as chymotrypsin, it is possible to increase detection rate of splice junction peptides[160].
Figure 4. An example of detected gene EIF4H with incoherent peptide quantitative patterns in A431 cell line after Gefitinib treatment. Gene EIF4H has six exons and four known splice variants (exon 6 is cut out to enable better resolution). Nine unique peptides were identified for EIF4H and grouped in 3 clusters. The eight bars represent peptide relative abundance in the eight samples at control, 2h, 6h, and 24h after Gefitinib treatment, two biological replicates at each condition. Cluster 1 (dark blue) which includes peptide 4, 5 and 6 has distinct pattern showing down-regulation at 24h after drug treatment. Peptide 4 (DDFNSGFR) and peptide 5 (DDFNSGFRDDFLGGR) are uniquely mapped to splice variant NM_022170. Peptide 6 (DDFLGGR) is not unique to splice variant NM_022170, but it is very likely that this peptide was a digested product from NM_022170 based on its similar quantitative pattern to peptide 4 and 5. In the mid panel, the number in the bracket after each cluster is the number of unique peptides grouped in this cluster. In the bottom panel, the number in the bracket after each peptide is number of PSMs.
Paper II – Proteogenomics produces comprehensive and highly accurate protein-coding gene annotation.
Current genome annotation strategies utilize mostly protein homologs from related species and transcriptomics data from RNA-sequencing. Recently, proteomic data have been primarily used to confirm gene models and discover missing genes after annotation obtained by RNA-seq or homology based means, and thus not as part of an integrative workflow combining proteomics and RNA-seq for genome-wide annotation (shown in Figure 5).
Figure 5. Integrative genome annotation workflow. Data from four different sources (long-read DNA
sequencing, RNA-seq, MS-based proteomics and Swiss-Prot reviewed proteins) were integrated using an evidence-based genome annotation framework (MAKER)[161]. Transcripts were assembled from RNA-seq reads using Trinity[162] and PASA[163] was used to identify likely protein-coding regions to provide gene models for initial gene predictions. Three ab initio gene predictors (GeneMark-ES[164], Augustus[165] and SNAP[166]) were included in MAKER. Augustus and SNAP were iteratively trained based on MAKER-generated gene models. The computationally inferred gene structures were manually curated. Shapes are used according to workflow figure standards (rectangles show processes, data are in parallelograms, the trapezoid indicates a manual step and the rounded rectangle represents output).
RNA-seq
MS-proteomics
Manual curation Splice
junctions identiPeptidefication
Six-frame translation
Long-read DNA-seq
Complete genome Intron discovery, transcript assemblyand ORF search
Candidate transcripts
and initial gene models Peptides
Protein homologs (Swiss-Prot)
MAKER
Annotated genome
Figure 6. Gene annotation facilitated by RNA-seq and peptide evidence. Screenshot from the WebApollo[167] genome annotation editor showing a locus where RNA-seq and peptide evidence improved gene annotation compared to the previous annotation described by Gioti et al[168]. The 5´-UTR and protein-coding segments were identified by the MAKER-based pipeline integrating RNA-seq and peptide data. Manual curation added a 3´-UTR (uppermost track). The colors of exons and peptides indicate reading frame, such that exons and peptides with the same color are in the same reading frame. UTRs are indicated in purple and introns in gray. RNA-seq coverage is shown for the genomic minus strand (i.e. the strand of the annotated gene) and indicates the number of read pairs at each base.
The major conclusions from this study are:
1. Integration of proteomics data in gene annotation pipeline increases sensitivity of
protein-coding sequences detection as compared to using homology and RNA-seq data alone. RNA-seq data is particularly useful for intron detection. Figure 6 shows an example of one annotated gene using the integrative workflow (top two tracks) and the traditional approach with RNA-seq data and homology (third track from top).
2. In addition, proteomics data increases accuracy of protein coding gene annotation,
evaluated by conserved protein domain analysis.
3. Proteomics data provides additional level of confidence for annotated genes and is able
Paper III – an integrative proteogenomics workflow to discover protein-coding region in human genome and variant peptides derived from mutations
Proteogenomics analysis enables the discovery of protein coding regions and sequence variants but their verification remains challenging. This study presents an integrated proteogenomics analysis workflow that combines peptide discovery, curation and validation, robustly identifying unknown coding regions and mutations using MS data.
1. Detected peptide evidences suggest translation of pseudogenes, lncRNAs, short ORFs,
alternative ORFs, N-terminal extensions and intronic sequences in human genome.
2. Certain pseudogenes and lncRNAs are translated in tissue specific manner.
3. Class specific FDR is necessary but not sufficient to control error rates in
proteogenomics findings.
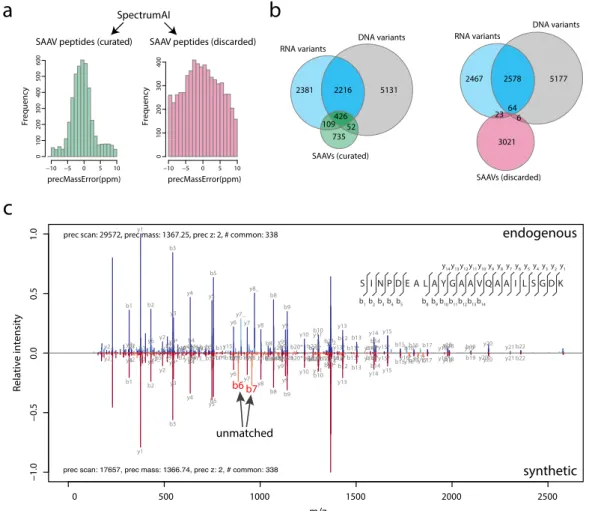
4. SpectrumAI which verifies peptide-spectrum matches through MS2 spectra
significantly reduces false identifications of variant peptides with single amino acid substitution.
5. External evidence in orthogonal data such as conservation, RNA-seq and ribosomal
profiling data increases the confidence of detected protein coding regions.
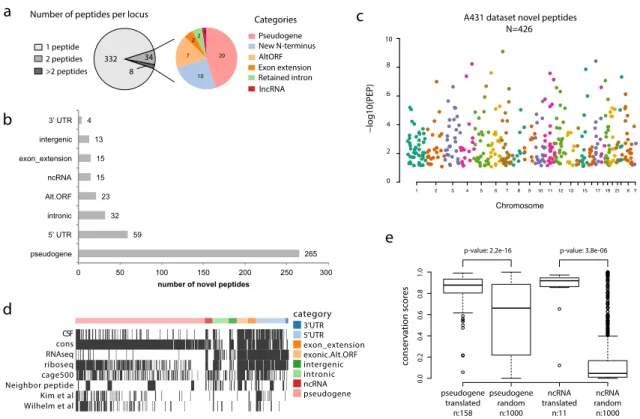
Verification of detected protein-coding region is challenging in proteogenomics studies. Previous studies have been either too stringent, such as demanding minimum two unique peptides supporting a protein coding loci or requiring the novel peptides with at least two mismatches to known peptides. Although the criteria can remove some false discoveries, it probably misses many potential true findings at the same time. In our A431 cell line data where 374 protein coding loci were discovered, only 42 loci were supported with two and more peptides (Figure 7). Instead of discarding all protein coding loci with only one unique peptide support, we searched external evidence such as detection in independent datasets, conservation analysis, RNA-seq, and ribosomal profiling. These additional levels of evidence could be used to filter and prioritize the candidate novel peptides.
Figure 7. Unannotated protein-coding loci found in the A431 cells dataset. a) The left pie chart shows the number of unannotated protein-coding loci supported by one, two or more peptides (peptides within 10kb distance were grouped into one locus); the right pie chart shows the different types of unannotated coding events supported by multiple peptides. b) Automatic categorization of novel peptides by Annovar[169] using RefSeq gene annotation. c) Manhattan plot of novel peptides, where the y-axis represents the peptide’s posterior error probability (PEP). d) Orthogonal data support for novel peptides, including PhyloCSF[170] coding potential, conservation analysis, A431 cell line RNA-seq reads evidence, ribosome profiling[171, 172], CAGE[173] (up to 500 bp upstream from peptide location), presence of neighboring peptides (within 10kb), and whether the peptide was identified in the draft proteome data of Kim et al[114] and Wilhelm et al[115]. Continuous variables were discretized to binary values 0 or 1 for visualization purposes. 10,000 random genomic loci were used to determine the threshold to call if Ribo-seq or CAGE data were supportive or not. e) The conservation score (PhastCons[174] score) distribution of pseudogenes and lncRNAs for which peptides were found was compared to that of 1000 randomly selected pseudogenes and lncRNAs. In the box plots, center line corresponds to median, box boundaries correspond to the first and third quartiles (Q1 and Q3), the upper whisker is min(max(x), Q3+1.5*IQR) and lower whisker is max(min(x), Q1-1.5*IQR).
Identification of single amino acid variant peptides is an error-prone process with high risk of false positives. Previously, manual curation has been used to ensure the validity of matches, but it is a laborious and time-consuming process. SpectrumAI automates the process of verifying the experimental peptide spectra for the presence of MS2 ions supporting the substituted amino acid. Being tested in cell line data with whole genome sequencing and RNA-seq data support, SpectrumAI is proved to be robust eliminating incorrect identification of single amino acid variants (Figure 8). It is worth to note that variant peptides passing SpectrumAI are not necessarily sequence variants before ruling out the artefact amino acid changes occurred in sample preparation. Pseudogene AltORF New N-terminus Retained intron Categories 332 34 8 Exon extension 1 peptide 2 peptides >2 peptides
Number of peptides per locus A431 dataset novel peptides
N=426 − log10(PEP) pseudogene ncRNA intronic intergenic exonic.Alt.ORF exon_extension 5'UTR 3'UTR category CSF cons RNAseq riboseq cage500 Neighbor peptide Kim et al Wilhelm et al pseudogene translated n:158 pseudogene random n:1000 ncRNA translated n:11 ncRNA random n:1000 0.0 0.2 0.4 0.6 0.8 1.0 conse rv ation scores
p-value: 2.2e-16 p-value: 3.8e-06
a d c e 265 59 32 23 15 15 13 4 0 50 100 150 200 250 300 pseudogene 5’ UTR intronic Alt.ORF ncRNA exon_extension intergenic 3’ UTR
number of novel peptides
Chromosome 1 2 3 4 5 6 7 8 9 1011 1213 15 171921 X Y 10 8 6 4 2 0 20 10 7 2 2 1 lncRNA b
Figure 8. SpectrumAI increases identification accuracy of peptides with single amino acid changes. a) Precursor mass error distributions of peptides classified as curated and discarded by SpectrumAI. b) Curated SAAV peptides have more overlap with missense variants identified at DNA and RNA level.
c) Mirror plot of an incorrectly identified peptide (that yet had passed discovery stage with class-specific FDR 1%) with a single residue substitution (V>L, at position 8) that was subsequently discarded by SpectrumAI. Annotated MS2 spectrum of the endogenous peptide is shown on top whereas that of the respective synthetic peptide is inverted and shown on bottom. This incorrect peptide identification detected by SpectrumAI shows mismatching b6 and b7 product ions (highlighted in the synthetic side and missing in the endogenous side) which ought to have flanked the substituted residue, indicating that the endogenous amino acid sequence is incorrect between its sixth and eighth residues.
Pseudogenes constitute the major categories which contained more than half of the detected
novel peptides. Some of them, e.g. TATDN2P1 and UBE2L5P, were shown tissue specific
expression. In comparison to previous effort using RNA-seq data to detect pseudogene expression which claimed expression of thousands of pseudogenes at transcript level[175], our proteomics data suggest a relatively smaller scale of pseudogene expression at protein level. The reasons can be that some transcribed pseudogenes execute their functions as RNA transcripts, e.g. acting as decoys for miRNA or some have undergone translational control[176].
0 500 1000 1500 2000 2500 − 1.0 − 0.5 0.0 0.5 1.0 m/z Relative intensity y2_ b1 y4b2y1_ y1 b3 b2 y6 y2 y3_y9_ b3 y3 y9* y10*y4_y11*
y4
b4 y11y13_b9y13b5*
y5 b5 b11y15 y6 y7_ y7 y8_ y8 b8* b8 y20y9*b9* y9 b9 b20* y10 b22*b10* y11b10 b11y12y13* y13 b12 b13* b13 y14*b14* y14 b14 y15* y15
b15b16*b16 b17 y18*y18b18 y19b19 y20 y21 b22 prec scan: 29572, prec mass: 1367.25, prec z: 2, # common: 338
y2_ b1 y4b2 y1 b3 b2 y6y2_b5* y2 y9_ b3 y3 y9*b7y11* y4 b4b8y13_b5* y5b5 b11*b11b13* y6 b13b6* b6 b14 y7 b7* b7 y8_ y8 b16b17b8* b8 b18*y20y9_ y9*b9* y9 b9 y21b20* y10 b22_b22*y11*b10* y11 b10 y12_b11*
b11y12y13_y13*b12* y13 b12 b13* b13 y14*b14* y14 b14 y15* y15
b15y16*y16b16y17*y17b17 y18*y18b18 b19 y20*y20 y21 b22
endogenous
synthetic
unmatched
SAAV peptides (discarded)
precMassError(ppm) Frequency −10 −5 0 5 10 0 100 200 300 400
SAAV peptides (curated)
precMassError(ppm) Frequency −10 −5 0 5 10 0 100 200 300 400 500 600
a
c
b
SpectrumAI S I N P D E A L A Y G A A V Q A A I L S G D K b1b2b3b4b5 b8b9b10b11b12b13b14 y7y6y5y4y3y2y1 y14y13y12y11y10y9y8 5131 2216 426 109 52 735 2381 SAAVs (curated) RNA variants DNA variants 5177 2578 3021 6 2364 2467 SAAVs (discarded) RNA variants DNA variantsPaper IV – DEqMS is a robust statistical tool to assess differential protein expression for both labelled and label-free proteomics data
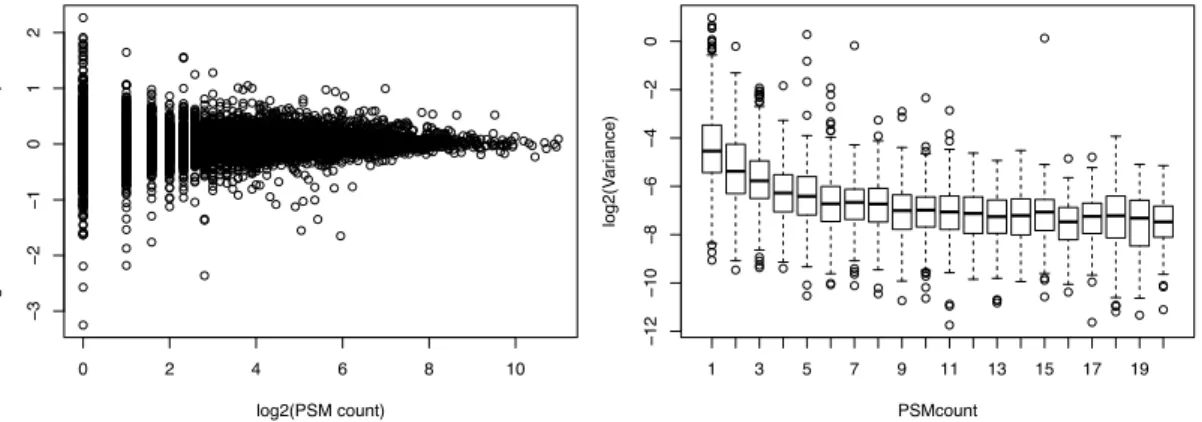
Currently, various statistical methods are being used for quantitative proteome analysis. The lack of consensus is due to several reasons. Some methods are limited for specific experimental design with only two classes or limited to specific data type (labelled or label-free) and difficult to choose. In addition, previous methods neglect the impact of the number of peptides on quantification accuracy, shown in Figure 9. DEqMS is a robust and universal tool to statistically assess differential protein expression by taking into account the number of PSMs or peptides used for quantification.
Figure 9. Protein variance in relation to the number of PSMs in TMT labelled dataset. A) each dot
represents one protein. The log2 ratio is calculated using median sweeping method as previously described[93]. x-axis is the number of PSM count in log2 scale. B) y-axis is the pooled variance calculated using all 10 samples. The boxplot showed the median of protein variance with number of PSMs identified from 1 to 20.
DEqMS has several advantages over existing methods:
1. Unlike previous methods neglecting variance heterogeneity in proteomics data, DEqMS
takes into account the number of peptides used for quantification in variance estimation.
2. DEqMS has higher accuracy of detecting differentially expressed proteins compared to
existing methods, demonstrated in independent benchmark datasets (Figure 10).
3. DEqMS is a universal tool to perform differential protein expression analysis with MS
proteomics data, applicable to both labelled and label-free datasets.
4. DEqMS is flexible to allow various experimental designs.
0 2 4 6 8 10 − 3 − 2 − 1 0 1 2 log2(PSM count) log2 r atio betw een tw o ctr l replicates 1 3 5 7 9 11 13 15 17 19 − 12 − 10 − 8 − 6 − 4 − 2 0 PSMcount log2(V ar iance)
Figure 10. Receiver operating characteristics (ROCs) on CPTAC study 6 data[177]. In this dataset, 48 UPS1 proteins were spiked into yeast proteome at five different concentrations (subsequent dilution at the factor of 3): 0.25, 0.74, 2.2, 6.7 and 20 fmol/µL, labelled as A to E, with three replicates at each concentration. Partial area under the curves (pAUC) of each model between false positive rates 0 and 0.1 are shown in the bottom-right legend. pAUC values were multiplied 100 times, the perfect model will have a value 10.
CONCLUDING REMARKS AND FUTURE PERSPECTIVES
Concluding remarks
The presented thesis has contributed methods and tools for various analysis and applications of MS-based proteomics in biological research.
Paper I addressed an issue in protein quantification after the protein inference process. It described a tool to de-convolute potentially mixed quantitative signals of peptides derived from different splice variants that are incorrectly inferred. The present tool allows splice variant centric quantification and enables investigation of splice variant regulation using MS
proteomics data. Paper II and III demonstrated applications of MS data in proteogenomics
studies. In Paper II, MS data was used in combination with RNA-seq data to annotate a newly
sequenced yeast genome. Such integrative approach demonstrated higher accuracy than the
conventional method without using MS data. Paper III extended the application to a more
challenging case, aiming for discovery of coding sequencing in the human genome. An automated pipeline has been developed to curate the findings and search their evidences in multiple sources of orthogonal data. Detection of differentially expressed genes with statistical
significance is an important task in biomarker research. Paper IV contributed a tool for
statistical analysis of quantitative MS proteomics. Tested in several different datasets, the tool demonstrated higher accuracy and broader applicability compared to existing methods.
The applications of MS-based proteomics and proteogenomics have great potential to discover new biomarkers and therapeutic targets in cancers [118, 124, 126, 130, 178-184]. The methodologies developed in this thesis have contributed bioinformatics tools to facilitate the future applications.
Future perspectives
The identities of a large fraction of MS2 spectra are still unknown
Recent proteomics studies have showed detection of ten thousand proteins in one MS
experiment, but this only corresponds to 30%-40% of generated MS2 spectra. The identities of the remaining MS2 spectra are still unknown. Different computational methods have been applied to find matches for the unexplained spectra, using for example sequence
tagging[185-187], de novo sequencing[188-194], a hybrid of de novo sequencing and database search[195],
correlating or clustering spectra to known peptides[196, 197], and error-tolerant search
approaches[185, 198]. It is postulated that the majority of the remaining unknown spectra are
from peptides with unexpected post translational modifications (PTMs) and sequence variants. PTMs plays an important role in signal transduction pathways and regulating cellular functions. Currently, enrichment is required for selected PTMs analysis, such as phosphorylation, to be identified on proteome-wide scale[199-206]. It is still yet not possible to perform unbiased detection of unmodified peptides and PTMs simultaneously due to the lack of tools for proteome-wide analysis of multiple PTMs.
With the advances of computing capacity and machine learning algorithms, de novo sequencing
is gaining interest since it has the possibility to identify new peptides and PTMs without the
need for a database. A recent publication by Tran et al used deep learning for peptide de novo
Multi-dimension peptide pre-fractionation methods are necessary to improve proteome coverage. However, to reach complete coverage of the proteome including PTMs, new separation and enrichment methods or instrumentation are needed to increase sensitivity for PTMs detection.
Multiplexing capacity of MS-based proteomics technique is still limited
Current isobaric labelling reagents allow multiplexing up to 11 samples to be analyzed at the same time. In order to analyze large clinical cohort of hundreds or thousands of samples, samples need to be split into separated MS experiments, with the risk of getting fewer and fewer overlapping proteins when combining data from multiple MS experiments. Moreover, the time required for sample preparation and MS analysis to reach in-depth proteome analysis is still considerably long, ranging from a few days to a week for one MS experiment. It is therefore in need of new quantification method or new types of instruments with increased multiplexing capacity and throughput so that MS proteomics techniques are applied in large clinical studies.
Standardize formats to facilitate proteomics data integration with other omics data
A standard and compatible format is the foundation to facilitate genome-wide integrative studies combining multi-omics data, such as genomics, transcriptomics and proteomics. In response to The Human Proteome Organization (HUPO) Proteomics Standards Initiative, two novel standard formats, proBAM and proBED, have been developed to store proteomics data in genomic context to facilitate proteogenomics studies[207, 208]. These two formats inherit features from two widely used genomics data format, BAM and BED, to store PSMs in genomic context. Many previously genomics tool such as SAMtools[209] and BEDTools[210], and new tools like proBAMconvert[211] are available for file indexing and conversion. In the future, proteogenomics studies will embrace the new data formats to increase data sharing and reanalysis.

![Figure 5. Integrative genome annotation workflow. Data from four different sources (long-read DNA sequencing, RNA-seq, MS-based proteomics and Swiss-Prot reviewed proteins) were integrated using an evidence-based genome annotation framework (MAKER)[161]](https://thumb-us.123doks.com/thumbv2/123dok_us/1354460.2681219/26.892.119.693.307.884/integrative-annotation-different-sequencing-proteomics-integrated-annotation-framework.webp)
![Figure 6. Gene annotation facilitated by RNA-seq and peptide evidence. Screenshot from the WebApollo[167] genome annotation editor showing a locus where RNA-seq and peptide evidence improved gene annotation compared to the previous](https://thumb-us.123doks.com/thumbv2/123dok_us/1354460.2681219/27.892.125.771.126.453/annotation-facilitated-evidence-screenshot-webapollo-annotation-evidence-annotation.webp)
![Figure 10. Receiver operating characteristics (ROCs) on CPTAC study 6 data[177]. In this dataset, 48 UPS1 proteins were spiked into yeast proteome at five different concentrations (subsequent dilution at the factor of 3): 0.25, 0.74, 2.2, 6.7 and 20 fmol](https://thumb-us.123doks.com/thumbv2/123dok_us/1354460.2681219/32.892.166.730.103.721/receiver-operating-characteristics-proteins-proteome-different-concentrations-subsequent.webp)
