WEB WORKLOAD CHARACTERIZATION:
TEN YEARS LATER
Adepele Williams, Martin Arlitt, Carey Williamson, and Ken Barker
Department of Computer Science, University of Calgary 2500 University Drive NW, Calgary, AB, Canada T2N 1N4 {awilliam,arlitt,carey,barker}@cpsc.ucalgary.ca
Abstract In 1996, Arlitt and Williamson [Arlitt et al. 1997] conducted a comprehensive workload characterization study of Internet Web servers. By analyzing access logs from 6 Web sites (3 academic, 2 research, and 1 industrial) in 1994 and 1995, the authors identified 10 invariants: workload characteristics common to all the sites that are likely to persist over time. In this present work, we revisit the 1996 work by Arlitt and Williamson, repeating many of the same analyses on new data sets collected in 2004. In particular, we study access logs from the same 3 academic sites used in the 1996 paper. Despite a 30-fold increase in overall traffic volume from 1994 to 2004, our main conclusion is that there are no dramatic changes in Web server workload characteristics in the last 10 years. Although there have been many changes in Web technologies (e.g., new protocols, scripting languages, caching infrastructures), most of the 1996 invariants still hold true today. We postulate that these invariants will continue to hold in the future, because they represent fundamental characteristics of how humans organize, store, and access information on the Web.
Keywords: Web servers, workload characterization
1.
Introduction
Internet traffic volume continues to grow rapidly, having almost doubled ev-ery year since 1997 [Odlyzko 2003]. This trend, dubbed “Moore’s Law [Moore 1965] for data traffic”, is attributed to increased Web awareness and the advent of sophisticated Internet networking technology [Odlyzko 2003]. Emerging technologies such as Voice-over-Internet Protocol (VoIP) telephony and Peer-to-Peer (P2P) applications (especially for music and video file sharing) further
contribute to this growth trend, amplifying concerns about scalable Web per-formance.
Research on improving Web performance must be based on a solid under-standing of Web workloads. The work described in this chapter is motivated generally by the need to characterize the current workloads of Internet Web servers, and specifically by the desire to see if the 1996 “invariants” identified by Arlitt and Williamson [Arlitt et al. 1997] still hold true today. The chapter addresses the question of whether Moore’s Law for data traffic has affected the 1996 invariants or not, and if so, in what ways.
The current study involves the analysis of access logs from three Internet Web servers that were also used in the 1996 study. The selected Web servers (Univer-sity of Waterloo, Univer(Univer-sity of Calgary, and Univer(Univer-sity of Saskatchewan) are all from academic environments, and thus we expect that changes in their workload characteristics will adequately reflect changes in the use of Web technology. Since the data sets used in the 1996 study were obtained between October 1994 and January 1996, comparison of the 2004 server workloads with the servers in the 1996 study represents a span of approximately ten years. This period provides a suitable vantage point for a retrospective look at the evolution of Web workload characteristics over time.
The most noticeable difference in the Web workload today is a dramatic increase in Web traffic volume. For example, the University of Saskatchewan Web server currently receives an average of 416,573 requests per day, about 32 times larger than the 11,255 requests per day observed in 1995. For this data set, the doubling effect of Moore’s Law applies biennially rather than annually. The goal of our research is to study the general impact of “Moore’s Law” on the 1996 Web workload invariants. Our approach follows the methodology in [Arlitt et al. 1997]. In particular, we focus on the document size distribution, document type distribution, and document referencing behavior of Internet Web servers. Unfortunately, we are not able to analyze the geographic distribution of server requests, since the host names and IP addresses in the access logs were anonymized for privacy and security reasons. Therefore, this work revisits only 9 of the 10 invariants from the 1996 paper. While some invariants have changed slightly due to changes in Web technologies, we find that most of the invariants hold true today, despite the rapid growth in Internet traffic. The main observations from our study are summarized in Table 1.1.
The rest of this chapter is organized as follows. Section 2 provides some background on Moore’s Law, Web server workload characterization, and related work tracking the evolution of Web workloads. Section 3 describes the data sets used in this study, the data analysis process, and initial findings from this research. Section 4 continues the workload characterization process, presenting the main results and observations from our study. Section 5 summarizes the chapter, presents conclusions, and provides suggestions for future work.
Table 1.1. Summary of Web Server Workload Characteristics
Workload Characteristic Description Status
1. Successful Requests About 65-70% of requests to a Lower than 1994
Web server result in the successful (Section 3.1) transfer of a document.
2. Document Types HTML and image documents together Lower than 1994
account for 70-85% of the documents (Section 3.2) transferred by Web servers.
3. Transfer Size The median transfer size is small Same
(e.g.,≤5 KB). (Section 3.2)
4. Distinct Requests A small fraction (about 1%) of server Same requests are for distinct documents. (Section 3.2) 5. One-time Referencing A significant percentage of files (15-26%) Same
and bytes (6-21%) accessed in the log (Section 4.1) are accessed only once in the log.
6. File Size Distribution The file size distribution and transfer Same size distribution are heavy-tailed (Section 4.2) (e.g., Pareto withα≈1)
7. Concentration The busiest 10% of files account for Same
approximately 80-90% of requests and (Section 4.2) 80-90% of bytes transferred.
8. Inter-Reference Times The times between successive requests Same to the same file are exponentially (Section 4.2) distributed and independent.
9. Remote Requests Remote sites account for 70% or more Same
of the accesses to the server, and 80% (Section 4.2) or more of the bytes transferred.
10. Wide-Area Usage Web servers are accessed by hosts on Not studied many networks, with 10% of the networks
generating 75% or more of the usage.
2.
Background and Related Work
Moore’s Law and the Web
In 1965, Gordon Moore, the co-founder of Intel, observed that new computer chips released each year contained roughly twice as many transistors as their predecessors [Moore 1965]. He predicted that this trend would continue for at least the next decade, leading to a computing revolution. Ten years later, Moore revised his prediction, stating that the number of transistors on a chip would double every two years. This trend is referred to as Moore’s Law. It is often generalized beyond the microchip industry to refer to any growth pattern that produces a doubling in a period of 12-24 months [Schaller 1996].
Odlyzko [Odlyzko 2003] observed that the growth of Internet traffic follows Moore’s Law. This growth continues today, with P2P applications currently
the most prominent contributors to growth. Press [Press 2000] argues that the economy, sophistication of use, new applications, and improved infrastructure (e.g., high speed connectivity, mobile devices, affordable personal computers, wired and wireless technologies) have a significant impact on the Internet today. This observation suggests that the underlying trends in Internet usage could have changed over the past ten years.
The 1996 study of Web server workloads involved 6 Web sites with sub-stantially different levels of server activity. Nevertheless, all of the Web sites exhibited similar workload characteristics. This observation implies that the sheer volume of traffic is not the major determining factor in Web server work-load characteristics. Rather, it is the behavioral characteristics of the Web users that matters. However, the advent of new technology could change user behav-ior with time, affecting Web workload characteristics. It is this issue that we explore in this work.
Web Server Workload Characterization
Most Web servers are configured to record an access log of all client requests for Web site content. The typical syntax of an access log entry is:
hostname - - [dd/mm/yyy:hh:mm:ss tz] document status size The hostnameis the name or IP address of the machine that generated the request for a document. The following fields (“- -”) are usually blank, but some servers record user name information here. The next field indicates the day and time that the request was made, including the timezone (tz). The URL requested is recorded in thedocumentfield. Thestatusfield indicates the response code (e.g., Successful, Not Found) for the request. The final field indicates the size in bytes of the document returned to the client.
Characterizing Web server workloads involves the statistical analysis of log entries and the identification of salient trends. The results of this analysis can provide useful insights for several tasks: enhancing Web server performance, network administration and maintenance, building workload models for net-work simulation, and capacity planning for future Web site growth. In our study, we characterize Web server workloads to assess how (or if) Web traffic characteristics have changed over time.
Related Work
Our study is not the first to provide a longitudinal analysis of Web workload characteristics. There are several prior studies providing a retrospective look at Web traffic evolution, four of which are summarized here.
Hernandez et al. discuss the evolution of Web traffic from 1995 to 2003 [Her-nandez et al. 2003]. In their study, they observe that the sizes of HTTP requests have been increasing, while the sizes of HTTP responses have been
decreas-ing. However, the sizes of the largest HTTP responses observed continue to increase. They observe that Web usage by both content providers and Web clients has significantly evolved. Technology improvements such as persistent connections, server load balancing, and content distribution networks all have an impact on this evolution. They provide a strong argument for continuous monitoring of Internet traffic to track its evolutionary patterns.
In 2001, Cherkasova and Karlsson [Cherkasova et al. 2001] revisited the 1996 invariants, showing several new trends in modern Web server workloads. Their work shows that 2-4% of files account for 90% of server requests. This level of skew (called concentration) is even more pronounced than claimed in 1996 [Arlitt et al. 1997], when 10% of the files accounted for 90% of the activity. The authors speculate that the differences arise from Web server side performance improvements, available Internet bandwidth, and a greater pro-portion of graphical content on Web pages. However, their comparison uses a completely different set of access logs than was used in the 1996 study, making direct comparisons difficult.
Barford et al. [Barford et al. 1999] study changes in Web client access patterns between 1995 and 1998. They compare measurements of Web client workloads obtained from the same server at Boston University, separated in time by three years. They conclude that document size distributions did not change over time, though the distribution of file popularity did. While the objective of the research in [Barford et al. 1999] is similar to ours, their analysis was only for Web client workloads rather than Web server workloads.
For more general workloads, Harel et al. [Harel et al. 1999] characterize a media-enhanced classroom server. They use the approach proposed in [Arlitt et al. 1997] to obtain 10 invariants, which they then compare with the 1996 invariants. They observe that the inter-reference times of documents requested from media-enhanced classroom servers are not exponentially distributed and independent. Harel et al. suggest the observed differences are due to the frame-based user interface of the Classroom 2000 system. The focus of their study is to highlight the characteristics of media-enhanced classroom servers, which are quite different from our study. However, their conclusions indicate that user applications can significantly impact Web server workloads.
A detailed survey of Web workload characterization for Web clients, servers, and proxies is provided in [Pitkow 1998].
3.
Data Collection and Analysis
Three data sets are used in this study. These access logs are from the same three academic sites used in the 1996 work by Arlitt and Williamson. The access logs are from:
2 A department-level Web server from the Department of Computer Sci-ence at the University of Calgary.
3 A campus-level Web server at the University of Saskatchewan.
The access logs were all collected between May 2004 and August 2004. These logs were then sanitized, prior to being made available to us. In particular, the IP addresses/host names and URLs were anonymized in a manner that met the individual site’s privacy/security concerns, while still allowing us to examine 9 of the 10 invariants. The following subsections provide an overview of these anonymized data sets.
We were unable to obtain access logs from the other three Web sites that were examined in the 1996 work. The ClarkNet site no longer exists, as the ISP was acquired by another company. Due to current security policies at NASA and NCSA, we could not obtain the access logs from those sites.
Comparison of Data Sets
Table 1.2 presents a statistical comparison of the three data sets studied in this chapter. In the table, the data sets are ordered from left to right based on average daily traffic volume, which varies by about an order of magnitude from one site to the next. The Waterloo data set represents the least loaded server studied. The Saskatchewan data set represents the busiest server studied. In some of the analyses that follow, we will use one data set as a representative example to illustrate selected Web server workload characteristics. Often, the Saskatchewan server is used as the example. Important differences among data sets are mentioned, when they occur.
Table 1.2. Summary of Access Log Characteristics (Raw Data)
Item Waterloo Calgary Saskatchewan
Access Log Duration 41 days 4 months 3 months
Access Log Start Date July 18, 2004 May 1, 2004 June 1, 2004
Total Requests 176,492 6,046,663 38,325,644
Avg Requests/Day 4,294 51,243 416,572
Total Bytes Transfered (MB) 13,512 457,255 363,845
Avg Bytes/Day (MB) 328.7 3,875.0 3,954.7
Response Code Analysis
As in [Arlitt et al. 1997], we begin by analyzing the response codes of the log entries, categorizing the results into 4 distinct groups. The “Successful” category (code 200 and 206) represents requests for documents that were found
and returned to the requesting host. The “Not Modified” category (code 304) represents the result from a GET If-Modified-Since request. This conditional GET request is used for validation of a cached document, for example between a Web browser cache and a Web server. The 304 Not Modified response means that the document has not changed since it was last retrieved, and so no document transfer is required. The “Found” category (code 301 and 302) represents requests for documents that reside in a different location from that specified in the request, so the server returns the new URL, rather than the document. The “Not Successful” category (code 4XX) represents error conditions, in which it is impossible for the server to return the requested document to the client (e.g., Not Found, No Permission).
Table 1.3 summarizes the results from the response code analysis for the Saskatchewan Web server. The main observation is that the Not Modified responses are far more prevalent in 2004 (22.9%) than they were in 1994 (6.3%). This change reflects an increase in the deployment (and effectiveness) of Web caching mechanisms, not only in browser caches, but also in the Internet. The percentage of Successful requests has correspondingly decreased from about 90% in 1994 to about 70% in 2004. This result is recorded in Table 1.1 as a change in the first invariant from the 1996 paper. The number of Found documents has increased somewhat from 1.7% to 4.2%, reflecting improved techniques for redirecting document requests.
Table 1.3. Server Response Code Analysis (U. Saskatchewan)
Response Group Response Code 1995 2004
Successful 200,206 90.7% 68.7%
Not Modified 304 6.3% 22.9%
Found 301,302 1.7% 4.2%
Unsuccessful 4XX 1.3% 4.2%
Total - 100% 100%
In the rest of our study, results from both the Successful and the Not Mod-ified categories are analyzed, since both satisfy user requests. The Found and Unsuccessful categories are less prevalent, and thus are not analyzed further in the rest of the study.
Table 1.4 provides a statistical summary of the reduced data sets.
Document Types
The next step in our analysis was to classify documents by type. Classifica-tion was based on either the suffix in the file name (e.g.,.html,.gif,.php, and many more), or by the presence of special characters (e.g., a ‘?’ in the URL,
Table 1.4. Summary of Access Log Characteristics (Reduced Data: 200, 206 and 304)
Item Waterloo Calgary Saskatchewan
Access Log Duration 41 days 4 months 3 months
Access Log Start Date July 18, 2004 May 1, 2004 June 1, 2004
Total Requests 155,021 5,038,976 35,116,868
Avg Requests/Day 3,772 42,703 381,695
Total Bytes Transfered (MB) 13,491 456,090 355,605
Avg Bytes/Day (MB) 328 3,865 3,865
Total Distinct Bytes (MB) 616 8,741 7,494
Distinct Bytes/Day (MB) 15.00 74.10 81.45
Mean Transfer Size (bytes) 91,257 94,909 10,618
Median Transfer Size (bytes) 3,717 1,385 2,162
Mean File Size (bytes) 257,789 397,458 28,313
Median File Size (bytes) 24,149 8,889 5,600
Maximum File Size (MB) 35.5 193.3 108.6
or a ‘/’ at the end of the URL). We calculated statistics on the types of docu-ments found in each reduced data set. The results of this analysis are shown in Table 1.5.
Table 1.5. Summary of Document Types (Reduced Data: 200, 206 and 304)
Waterloo Calgary Saskatchewan
Item Reqs (%) Bytes (%) Reqs (%) Bytes (%) Reqs (%) Bytes (%)
HTML 23.18 6.02 8.09 1.13 12.46 11.98 Images 63.02 10.77 78.76 33.36 57.64 33.75 Directory 4.67 0.19 3.12 0.65 13.35 19.37 CSS 0.93 0.03 2.48 0.07 6.54 0.84 Dynamic 1.96 0.09 3.63 0.55 5.78 8.46 Audio 0.00 0.00 0.01 0.16 0.01 0.29 Video 0.00 0.00 0.40 54.02 0.06 5.25 Formatted 5.13 82.32 1.02 8.30 1.30 17.25 Other 1.11 0.58 2.49 1.76 2.86 2.81 Total 100.0 100.0 100.0 100.0 100.0 100.0
Table 1.5 shows the percentage of each document type seen based on the percentage of requests or percentage of bytes transferred for each of the servers. In the 1996 study, HTML and Image documents accounted for 90-100% of the total requests to each server. In the current data, these two types account for only 70-86% of the total requests. This reflects changes in the underlying Web technologies, and differences in the way people use the Web.
Table 1.5 illustrates two aspects of these workload changes. First, the ‘Di-rectory’ URLs are often used to shorten URLs, which makes it easier for people to remember them. Many ‘Directory’ URLs are actually for HTML documents (typicallyindex.html), although they could be other types as well. Second, Cascading Style Sheets (CSS)1are a simple mechanism for adding fonts, col-ors, and spacing to a set of Web pages. If we collectively consider the HTML, Images, Directory, and CSS types, which are the components of most Web pages, we find that they account for over 90% of all references. In other words, browsing Web pages (rather than downloading papers or videos) is still the most common activity that Web servers support.
While browsing Web pages accounts for most of the requests to each of the servers, Formatted and Video types are responsible for a significant fraction of the total bytes transferred. These two types account for more than 50% of all bytes transferred on the Waterloo and Calgary servers, and over 20% of all bytes transferred on the Saskatchewan server, even though less than 5% of requests are to these types. The larger average size of Formatted and Video files, the increasing availability of these types, and the improvements in computing and networking capabilities over the last 10 years are all reasons that these types account for such a significant fraction of the bytes transferred.
Web Workload Evolution
Table 1.6 presents a comparison of the access log characteristics in 1994 and 2004 for the Saskatchewan Web server. The server has substantially higher load in 2004. For example, the total number of requests observed in 3 months in 2004 exceeds the total number of requests observed in 7 months in 1995, doing so by over an order of magnitude. The rest of our analysis focuses on understanding if this growth in traffic volume has altered the Web server’s workload characteristics.
One observation is that the mean size of documents transferred is larger in 2004 (about 10 KB) than in 1994 (about 6 KB). However, the median size is only slightly larger than in 1994, and still consistent with the third invariant listed in Table 1.1.
Table 1.6 indicates that the maximum file sizes have grown over time. A similar observation was made by Hernandez et al. [Hernandez et al. 2003]. The increase in the maximum file sizes is responsible for the increase in the mean. The maximum file sizes will continue to grow over time, as increases in computing, networking, and storage capacities enable new capabilities for Web users and content providers.
Table 1.6. Comparative Summary of Web Server Workloads (U. Saskatchewan)
Item 1995 2004
Access Log Duration 7 months 3 months
Access Log Start Date June 1, 1995 June 1, 2004
Total Requests 2,408,625 35,116,868
Avg Requests/Day 11,255 381,695
Total Bytes Transfered (MB) 12,330 355,605
Avg Bytes/Day (MB) 57.6 3865.2
Total Distinct Bytes (MB) 249.2 7,494
Distinct Bytes/Day (MB) 1.16 81.46
Mean Transfer Size (bytes) 5,918 10,618
Median Transfer Size (bytes) 1,898 2,162
Mean File Size (bytes) 16,166 28,313
Median File Size (bytes) 1,442 5,600
Maximum File Size (MB) 28.8 108.6
Distinct Requests/Total Requests 0.9% 0.8%
Distinct Bytes/Total Bytes 2.0% 2.1%
Distinct Files Accessed Only Once 42.0% 26.1%
Distinct Bytes Accessed Only Once 39.1% 18.3%
Next, we analyze the access logs to obtain statistics on distinct documents. We observe that about 1% of the requests are for distinct documents. These requests account for 2% of the bytes transferred. Table 1.6 shows that the percentage of distinct requests is similar to that in 1994. This fact is recorded in Table 1.1 as an unchanged invariant.
The next analysis studies “one-timer” documents: documents that are ac-cessed exactly once in the log. One-timers are relevant because their pres-ence limits the effectiveness of on-demand document caching policies [Arlitt et al. 1997].
For the Saskatchewan data set, the percentage of one-timer documents has decreased from 42.0% in 1994 to 26.1% in 2004. Similarly, the byte traffic volume of one-timer documents has decreased from 39.1% to 18.3%. While there are many one-timer files observed (26.2%), the lower value for one-timer bytes (18.3%) implies that they tend to be small in size. Across all three servers, 15-26% of files and 6-21% of distinct bytes were accessed only a single time. This is similar to the behavior observed in the 1994 data, so it is retained as an invariant in Table 1.1.
0 0.2 0.4 0.6 0.8 1 1 10 100 1K 10K 100K 1M 10M 100M 1G Cumulative Frequency
File Size in Bytes UofW
UofC UofS
Figure 1.1. Cumulative Distribution (CDF) of File Sizes, by server
4.
Workload Characterization
File and Transfer Size Distributions
In the next stage of workload characterization, we analyze the file size dis-tribution and the transfer size disdis-tribution.
Figure 1.1 shows the cumulative distribution function (CDF) for the sizes of the distinct files observed in each server’s workload. Similar to the CDF plotted in [Arlitt et al. 1997], most files range from 1 KB to 1 MB in size. Few files are smaller than 100 bytes in size, and few exceed 10 MB. However, we note that the size of the largest file observed has increased by an order of a magnitude from 28 MB in 1994 to 193 MB in 2004.
Similar to the approach used in the 1996 study, we further analyze the file and transfer size distributions to determine if they are heavy-tailed. In particular, we study the tail of the distribution, using the scaling estimator approach [Crovella et al. 1999] to estimate the tail indexα.
Table 1.7 shows the α values obtained in our analysis. We find tail index values ranging from 1.02 to to 1.31. The tails of the file size distributions for our three data sets all fit well with the Pareto distribution, a relatively simple heavy-tailed distribution. Since the file size and transfer size distributions are heavy-tailed, we indicate this as an unchanged invariant in Table 1.1.
Figure 1.2 provides a graphical illustration of the heavy-tailed file and transfer size distributions for the Saskatchewan workload, using a log-log complemen-tary distribution (LLCD) plot. Recall that the cumulative distribution function F(x) expresses the probability that a random variableX is less than x. By definition, the complementary distribution isF¯ = 1−F(x), which expresses the probability that a random variableX exceedsx[Montgomery et al. 2001]. An LLCD plot shows the value ofF¯(x)versusx, using logarithmic scales on both axes.
-5.5 -5 -4.5 -4 -3.5 -3 -2.5 -2 -1.5 -1 -0.5 0 0 1 2 3 4 5 6 7 8 9 Log10(P[X > x]) Log10(size - mean)
Figure 1.2. File Size Distribution, UofS,α= 1.02 -8 -7 -6 -5 -4 -3 -2 -1 0 -2 -1 0 1 2 3 4 5 6 7 8 9 Log10(P[X > x]) Log10(size - mean)
Figure 1.3. Transer Size Distribu-tion, UofS,α= 1.17
In Figure 1.2, the bottom curve is the empirical data; each subsequent curve is aggregated by a factor of 2. This is the recommended default aggregation factor for use with theaesttool [Crovella et al. 1999].
On an LLCD plot, a heavy-tailed distribution typically manifests itself with straight-line behavior (with slopeα). In Figure 1.2, the straight-line behavior is evident, starting from a (visually estimated) point at 10 KB that demarcates the tail of the distribution. This plot provides graphical evidence for the heavy-tailed distributions estimated previously.
Table 1.7. Comparison of Heavy-Tailed File and Transfer Size Distributions
Item Waterloo Calgary Saskatchewan
File Size Distribution α= 1.10 α= 1.31 α= 1.02 Transfer Size Distribution α= 0.86 α= 1.05 α= 1.17
File Referencing Behavior
In the next set of workload studies, we focus on the file referencing pattern for the Calgary Web server. In particular, we study the concentration of references, the temporal locality properties, and the document inter-reference times. We do not study the geographic distribution of references because this information cannot be determined from the sanitized access logs provided.
Concentration of References. The term “concentration” of references
refers to the non-uniform distribution of requests across the Web documents accessed in the log. Some Web documents receive hundreds or thousands of requests, while others receive relatively few requests.
0 0.2 0.4 0.6 0.8 1 0 0.2 0.4 0.6 0.8 1 Cumulative Frequency
Fraction of Files (Sorted by Reference Count) UofW UofC UofS
Figure 1.4. Cumulative Distribu-tion for ConcentraDistribu-tion
1 10 100 1000 10000 100000 1e+06 1e+07 1 10 100 1000 10000 100000 1e+06 Accesses to Document Document Rank UofS UofC UofW
Figure 1.5. Reference Count Ver-sus rank
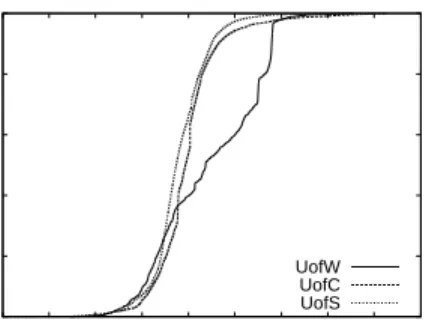
Our first step is to assess the referencing pattern of documents using the approach described in [Arlitt et al. 1997]. Similar to the 1996 results, a few files account for most of the incoming requests, and most of the bytes trans-ferred. Figure 1.4 shows a plot illustrating concentration of references. The vertical axis represents the cumulative proportion of requests accounted for by the cumulative fraction of files (sorted from most to least referenced) along the horizontal axis. High concentration is indicated by a line near the upper left corner of the graph. As a comparison, an equal number of requests for each document would result in a diagonal line in this graph. Clearly, the data set in Figure 1.4 shows high concentration.
Another approach to assess non-uniformity of file referencing is with a popu-larity profile plot. Documents are ranked from most popular (1) to least popular (N), and then the number of requests to each document is plotted versus its rank, on a log-log scale. A straight-line behavior on such a graph is indicative of a power-law relationship in the distribution of references, commonly referred to as a Zipf (or Zipf-like) distribution [Zipf 1949].
Figure 1.5 provides a popularity profile plot for each workload. The general trend across all three workloads is Zipf-like. There is some flattening in the popularity profile for the most popular documents. This flattening is attributable to Web caching effects [Williamson 2002].
Temporal Locality. In the next set of experiments, we analyze the
ac-cess logs to measure temporal locality. The term “temporal locality” refers to time-based correlations in document referencing behavior. Simply expressed, documents referenced in the recent past are likely to be referenced in the near future. More formally stated, the probability of a future request to a document is inversely related to the time since it was most recently referenced [Mahanti et al. 2000].
0 0.02 0.04 0.06 0.08 0.1 0.12 10 20 30 40 50 60 70 80 90 100 Fraction of References
Position In LRU Stack UofW
UofC UofS
Figure 1.6. Temporal Locality Characteristics
Note that temporal locality is not the same as concentration. High con-centration does not necessarily imply high temporal locality, nor vice versa, though the two concepts are somewhat related. For example, in a data set with high concentration, it is likely that documents with many references are also referenced in the recent past.
One widely used measure for temporal locality is the Least Recently Used Stack Model (LRUSM). The LRUSM maintains a simple time-based relative ordering of all recently-referenced items using a stack. The top of the stack holds the most recently used document, while the bottom of the stack holds the least recently used item. At any point in time, a re-referenced itemDis pulled out from its current positionP, and placed on top of the stack, pushing other items down as necessary. Statistics are recorded regarding which positionsP tend to be referenced (called the stack distance). An item being referenced for the first time has an undefined stack distance, and is simply added to the top of the stack. Thus the size of the stack increases only if a document that does not exist already in the stack arrives.
Temporal locality is manifested by a tendency to reference documents at or near the top of the stack. We perform an LRUSM analysis on the entire access log and plot the reference probability versus the LRU stack distance.
Figure 1.6 is a plot of the relative referencing for the first 100 positions of the LRUSM. In general, our analysis shows a low degree of temporal locality, as was observed in the 1996 paper.
The temporal locality observed in 2004 is even weaker than that observed in the 1994 data. We attribute this to two effects. The first effect is the in-creased level of load for the Web servers. As load increases, so does the level of “multiprogramming” (i.e., concurrent requests from different users for unre-lated documents), which tends to reduce temporal locality. The second effect is due to Web caching [Williamson 2002]. With effective Web caching, fewer re-quests propagate through to the Web server. More importantly, only the cache
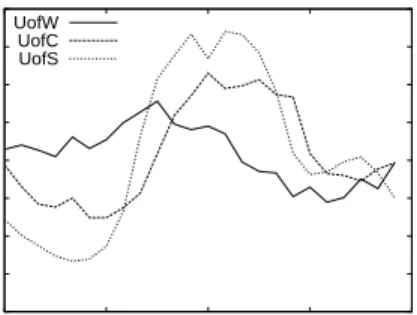
0 0.01 0.02 0.03 0.04 0.05 0.06 0.07 0.08 0:00 6:00 12:00 18:00 24:00 Fraction of Requests Hour UofW UofC UofS
Figure 1.7. Distribution of hourly request arrival rate, by server
misses in the request stream reach the server. Thus Web servers tend to see lower temporal locality in the incoming request stream [Williamson 2002].
Inter-reference Times. Next, we analyze the access logs to study the
inter-reference times of documents. Our aim is to determine whether the arrival process can be modeled with a fixed-rate Poisson process. That is, we need to know if the inter-reference times for document requests are exponentially distributed and independent, with a rate that does not vary with time of day.
Figure 1.7 shows a time series representation of the number of requests received by each server in each one hour period of their respective access logs. The aggregate request stream follows a diurnal pattern with peaks and dips, and thus cannot be modeled with a fixed-rate Poisson process. This observation is consistent with the 1996 study, and is easily explained by time of day effects. For instance, most people work between 9:00am and 6:00pm, and this is when the number of requests is highest.
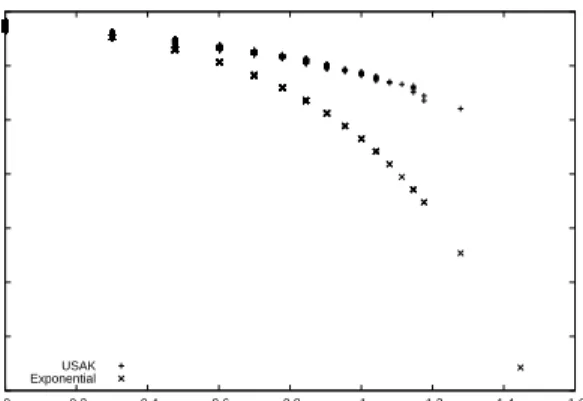
Similar to the approach in [Arlitt et al. 1997], we study the request arrival process at a finer-grain time scale, namely within a one-hour period for which we assume the arrival rate is stationary. The intent is to determine if the distribution of request inter-arrival times is consistent with an exponential distribution, and if so, to assess the correlation (if any) between the inter-arrival times observed. Figure 1.8 shows a log-log plot of the complementary distribution of observed inter-arrival times within a selected hour, along with an exponential distribution with the same mean inter-arrival time. The relative slopes suggest that the empirical distribution differs from the exponential distribution, similar to the 1996 findings.
Finally, using the approach proposed by Paxson and Floyd [Paxson et al. 1995], we study the inter-arrival times of individual busy documents in detail. We use the same threshold rules suggested in the 1996 study, namely that a “busy”
-14 -12 -10 -8 -6 -4 -2 0 0 0.2 0.4 0.6 0.8 1 1.2 1.4 1.6 Log 10 (P[X>x])
Log 10 (Inter-Arrival Time in Seconds) Inter-reference time analysis (a) USASK Server
USAK Exponential
Figure 1.8. Inter-Reference Time Analysis
document is one that is accessed at least 50 times in at least 25 different non-overlapping one-hour intervals.
We study if the inter-arrival times for these busy documents are exponentially-distributed and independent. The Anderson-Darling (A2) test [Romeu 2003] is a goodness-of-fit test suitable for this purpose. It compares the sampled distri-bution to standard distridistri-butions, like the exponential distridistri-bution. We express our results as the proportion of sampled intervals for which the distribution is statistically indistinguishable from an exponential distribution. The degree of independence is measured by the amount of autocorrelation among inter-arrival times.
Unfortunately, we do not have definitive results for this analysis. The dif-ficulty is that Web access logs, as in 1996, record timestamps with 1-second resolution. This resolution is inadequate for testing exponential distributions, particularly when busy Web servers record multiple requests with the same arrival time (i.e., an inter-arrival of 0, which is impossible in an exponential distribution). We do not include our findings in this chapter because we could not ascertain ourA2 coefficient values for this test. However, since the doc-ument inter-arrival times closely follow the 1996 results for the two previous levels of analysis, we have no evidence to refute the invariant in Table 1.1. We believe that the inter-reference times for a busy document are exponentially distributed and independent.
Remote Requests. While we do not have actual IP addresses or host names
recorded in our logs, the sanitized host identifier included with each request indicates whether the host was “local” or “remote”. For the Saskatchewan data set, 76% of requests and 83% of bytes transferred were to remote hosts. For
the Calgary data set, remote hosts issued 88% of requests and received 99% of the bytes transferred.2
These proportions are even higher than in the 1994 workloads. We conclude that remote requests still account for a majority of requests and bytes transferred. This invariant is recorded Table 1.1.
Limitations. We could not analyze the geographic distribution of clients
as in [Arlitt et al. 1997] because of sanitized IP addresses in the access logs. Also, we do not analyze the impact of user aborts and file modifications in this study because we do not have the error logs associated with the Web access logs. The error logs are required to accurately differentiate between user abort and file modifications.
5.
Summary and Conclusions
This chapter presented a comparison of Web server workload characteristics across a time span of ten years. Recent research indicates that Web traffic volume is increasing rapidly. We seek to understand if the underlying Web server workload characteristics are changing or evolving as the volume of traffic increases. Our research repeats the workload characterization study described in a paper by Arlitt and Williamson, using 3 new data sets that represent a subset of the sites in the 1996 study.
Despite a 30-fold increase in overall traffic volume from 1994 to 2004, our main conclusion is that there are no dramatic changes in Web server work-load characteristics in the last 10 years. Improved Web caching mechanisms and other new technologies have changed some of the workload character-istics (e.g., Successful request percentage) observed in the 1996 study, and had subtle influences on others (e.g., mean file sizes, mean transfer sizes, and weaker temporal locality). However, most of the 1996 invariants still hold true today. These include one-time referencing behaviors, high concentration of references, heavy-tailed file size distributions, non-Poisson aggregate request streams, Poisson per-document request streams, and the dominance of remote requests. We speculate that these invariants will continue to hold in the future, because they represent fundamental characteristics of how humans organize, store, and access information on the Web.
In terms of future work, it would be useful to revisit the performance impli-cations of Web server workload characteristics. For example, one could extend this study to analyze caching design issues to understand if the changes ob-served in these invariants can be exploited to improve Web server performance. It will also be interesting to study other Web server access logs from
cial and research organizations to see if they experienced similar changes in Web server workloads. A final piece of future work is to formulate long-term models of Web traffic evolution so that accurate predictions of Web workloads can be made.
Acknowledgements
Financial support for this work was provided by iCORE (Informatics Circle of Research Excellence) in the Province of Alberta, as well as NSERC (Natural Sciences and Engineering Research Council) of Canada, and CFI (Canada Foun-dation for Innovation). The authors are grateful to Brad Arlt, Andrei Dragoi, Earl Fogel, Darcy Grant, and Ben Groot for their assistance in the collection and sanitization of the Web server access logs used in our study.
References
Arlitt, M. and Williamson, C. (1997) Internet Web Servers: Workload Charac-terization and Performance Implications. IEEE/ACM Transactions on
Net-working, Vol. 5, No. 5, pp. 631-645.
Barford, P., Bestavros, A., Bradley, A. and Crovella, M. (1999) Changes in Web Client Access Patterns: Characteristics and Caching Implications. World
Wide Web Journal, Special Issue on Characterization and Performance
Eval-uation, pp. 15-28.
Cherkasova, L. and Karlsson, M. (2001) Dynamics and Evolution of Web Sites: Analysis, Metrics and Design Issues. Proceedings of the 6th IEEE Symposium
on Computers and Communications, Hammamet, Tunisia, pp. 64-71.
Crovella, M. and Taqqu, M. (1999) Estimating the Heavy Tail Index from Scal-ing Properties. Methodology and ComputScal-ing in Applied Probability, Vol. 1, No. 1, pp. 55-79.
Harel, N., Vellanki, V., Chervenak, A., Abowd, G. and Ramachandran, U. (1999) Workload of a Media-Enhanced Classroom Server. Proceedings of the 2nd
IEEE Workshop on Workload Characterization, Austin, TX.
Hernandez-Campos, F., Jeffay, K. and Donelson-Smith, F. (2003) Tracking the Evolution of Web Traffic: 1995-2003. Proceedings of 11th IEEE/ACM
International Symposium on Modeling, Analysis and Simulation of Computer and Telecommunications Systems (MASCOTS), Orlando, FL, pp. 16-25.
Mahanti, A., Eager, D. and Williamson, C. (2000) Temporal Locality and its Impact on Web Proxy Cache Performance. Performance Evaluation, Special Issue on Internet Performance Modeling, Vol. 42, No. 2/3, pp. 187-203. Montgomery, D., Runger, G. and Hubele, N. (2001) Engineering Statistics.
John Wiley and Sons, New York.
Moore, G. (1965) Cramming More Components onto Integrated Circuits.
Odlyzko, A. (2003) Internet Traffic Growth: Sources and Implications.
Pro-ceedings of SPIE Optical Transmission Systems and Equipment for WDM Networking II, Vol. 5247, pp. 1-15.
Paxson, V. and Floyd, S. (1995) Wide-area Traffic: The Failure of Poisson Modeling. IEEE/ACM Transactions on Networking, Vol. 3, No. 3, pp. 226-244.
Pitkow, J. (1998) Summary of WWW Characterizations. Proceedings of the
Sev-enth International World Wide Web Conference, Brisbane, Australia, pp.
551-558.
Press, L. (2000) The State of the Internet: Growth and Gaps. Proceedings of
INET 2000, Japan.
Available at: http://www.isoc.org/inet2000/cdproceedings/8e/8e 4.htm#s21 Romeu, J. (2003) Anderson-Darling: A Goodness of Fit Test for Small Samples
Assumptions. Selected Topics in Assurance Related Technologies, Vol. 10, No. 5, DoD Reliability Analysis Center.
Available at: http://rac.alionscience.com/pdf/A DTest.pdf
Schaller, B. (1996) The Origin, Nature, and Implications of Moore’s Law. Avail-able at: http://mason.gmu.edu/˜rschalle/moorelaw.html
Williamson, C. (2002) On Filter Effects in Web Caching Hierarchies. ACM
Transactions on Internet Technology, Vol. 2, No. 1, pp. 47-77.
Zipf, G. (1949) Human Behavior and the Principle of Least Effort. Addison-Wesley Press, Inc., Cambridge, MA.
![Figure 1.2. File Size Distribution, UofS, α = 1.02 -8-7-6-5-4-3-2-1 0 -2 -1 0 1 2 3 4 5 6 7 8 9Log10(P[X > x])Log10(size - mean)](https://thumb-us.123doks.com/thumbv2/123dok_us/650816.2578494/12.918.241.775.207.829/figure-file-size-distribution-uofs-log-log-size.webp)