ICANS-XI Internah& Collaboration on Advanced Neutron Sowces KEK, Tsukuba, October 22-26.1990
Machine Control and Online Data Analysis using PV-Wave’
G.S. Smith, WA. Hamilton, R. 0. Nelson and G.P. Cort
Manuel Lujan Jr. Neutron Scattering Center Los Alamos, New Mexico 87545 USA
ABSTRACT: By combining the commercially available image processing program WAVE with the LANSCE Data Acquisition Command Language (DACL), we have developed a computer program for the LANSCE neutron reflectometer (SPEAR). The instrument specific portion of the program is written in WAVE; whereas, the data acquisition part is composed of generic DACL building blocks. This approach allows one to acquire, archive, and retrieve data just as is done on any other instrument in the facility; however, it also allows one to easily customize the instrument specific program for the special needs of SPEAR. The menu options contained within WAVE are used to call machine operating programs, WAVE based data manipulation routines, and external FORTRAN routines. Several examples will be given which illustrate how the WAVE programs are written and used.
I. INTRODUCTION
One of the problems facing instrument scientists at large experimental facilities is how to minimize the amount of time spent in programming computers for. data acquisition. One method is to develop a facility-wide computer program which covers the needs of every i-nstrument. This has the advantage of being a single program written and maintained by a relatively few number of people. By the same token, it quite often has the disadvantage of being so complicated that only those people who wrote it can add any modifications and that even minor changes can be quite involved. On the other hand, a different program for each instrument could be written for-data acquisition and online analysis. This gives each instrument scientist the flexibility to add any changes that he wishes without worrying about the consequences these changes may have for other instruments. However, this has the obvious disadvantage that many of the routines developed for a single spectrometer can easily be generalized for use on several instruments and amounts to a duplication of effort.
For the neutron reflectometer (SPEAR) at LANSCE, we have recently developed a program which is partly based on general use routines and partly instrument specific, This is done using two basic building blocks. The first is the LANSCE Data Acquisition Control Language (DACL)*. This program was written as a general use program for the control of the LANSCE Fastbus data acquisition hardware which is designed specifically. for collection of time-of-flight data. The second portion of the program is specific to SPEAR and is based on the commercial interactive image processing language, PV-WAVE’.
II. THE SOFTWARE BUILDING BLOCKS
DACL is an extension of Digital Control Language (DCL)3 written at LANSCE to control the data acquisition hardware and collection process. Using a data base stored in VAX3 memory, DACL allows the experimenter to configure an ensemble of CAMAC and FASTBUS hardware that controls the data acquisition process, the sample environment, and detector position. Additional commands initialize scalers and time histogramming memories, start and stop data collection, and generate VMS3 files that save the data base and data histograms from FASTBUS. Each DACL
command generally provides a simple function in a single module, and complex functions are available through DCL3 procedures.
Although DACL provides an interface between the user and the Fastbus .hardware, it is still difficult to master for the casual experimenter. Besides, one wishes to insulate the user from having to learn this language simply to operate the instrument. Also, ‘DACL does not provide a means for on line data inspection and reduction in a way that is useful for every experiment. This is essential for making basic experimental decisions such as when there is enough statistical data. We have found that the .software package .WAVE provides the necessary features.
:’
“WAVE is an interactive ‘language’ for navigating through large data sets, selecting important subsets of the data and translating the results into useful charts, scatter plots, contour plots, surfaces, and images.‘14 The features of WAVE used in performing these tasks are simple high level commands for plotting data, creating interactive menus and windowing; data manipulanon based on vectors and arrays; programing structure which has components of FORTRAN, PASCAL and BASIC, and the ability to link WAVE programs and subprograms to FORTRAN and PASCAL subroutines as well as executing DCL and DACL commands and command files. These WAVE functions give one the ability to visualize data in many ways with a relatively few number of programming commands.
III. REFLECTOMETRY ON SPEAR
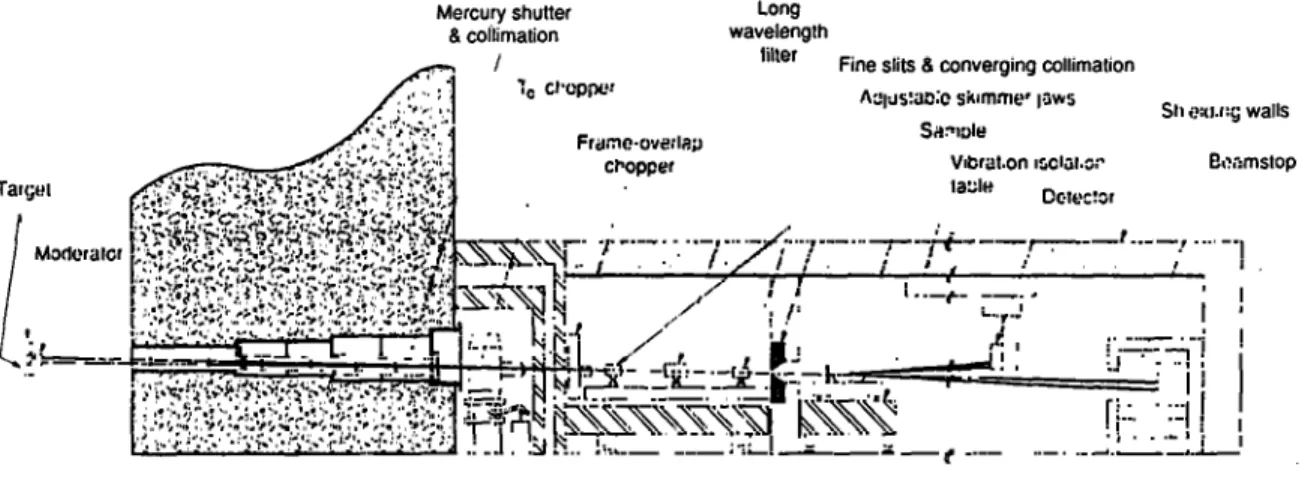
To understand the utility of using WAVE for reflectometry data, one must first understand something about the measurements. Fig. 1 is a schematic diagram of SPEARSv6. The neutron beam from the LANSCE target is collimated into two beams within the biological bulk shielding. Either both or each of the shutters for these beams may be used. The beams are inclined at 1 and
1.5 degrees with respect to horizontal for studying either solid or liquid surfaces. At the exit of the bulk shielding, there is a T,, chopper for reducing the background due to contamination by delayed neutrons produced when the initial flash of high energy neutrons contacts the shielding within the instrument.
SPEAR
Mercury shutter Long 8 coilimation wavelength
filler Fine slits 8 converging collimation
AzI;Is:~I**:c sklm.me* ~sws SWlDk
Sh 0u.l::; walls Franc.cwe:lrp
ct-opper Vdxd.on 8cl,3.s:- Ecomslop lazle Cae:!sr
Following the TO chopper shielding cave, is the beam handling area. In this room, there is a frame overlap chopper for selecting the wavelength frame (l-16A or 16-32
A).
Also, there is a set of frame overlap mirrors which filter out long wavelength neutrons (>32A). It is particularly important to remove these long wavelength neutrons since they will contaminate the low reflectivity measurements of succeeding frames. This entire room is surrounded by shielding walls to prevent any background scattering from reaching the sample and detector.The paths of the two neutron beams converge to a point at the sample position. The reflected neutrons are then detected by an 0rdela7 model 1202N linear position sensitive detector. Generally, this detector is oriented vertically and, for small angles, its height is adjusted so that it may intercept both the direct and the reflected beams (although during a reflection measurement the direct beam is blocked to prevent damaging the detector). This allows for an accurate determination of the angle of reflection. With this arrangement, the data can be easily visualized by plotting the intensity as a function of time and position on the detector. This is the primary function of our WAVE routines.
IV. THE WAVE PROGRAM
The main WAVE program consists of four major subroutines. The choice of one of these four subroutines is made by clicking on menu options offered whenever the program is first run. These menu items are labeled OPERATION, SETUP, QUICK LOOK, and ANALYZE. Whenever one of these menu items is chosen, a submenu giving the available options is presented. The first main menu items is OPERATION. Its submenu offers the basic machine operation commands RUN, PAUSE, RESUME, END AND SAVE, and END AND DON’T SAVE. By clicking on any one of these options a command file is executed. In this way, the user needn’t be troubled with remembering commands or knowing DCL or DACL. Each successful run will begin with the RUN option and end with the END AND SAVE option which automatically archives the data.
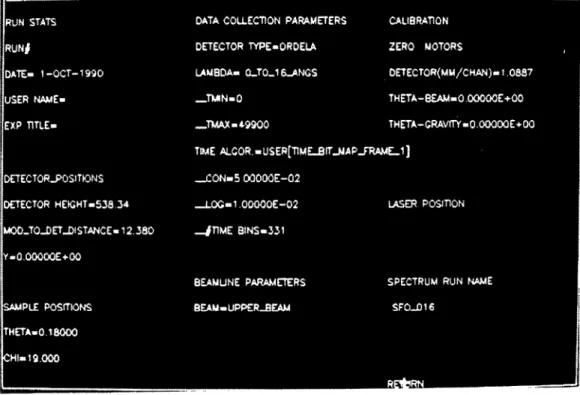
Clicking on the second main menu item, SETUP, will cause the display of the setup submenu. As illustrated in Fig. 2, this a 2-dimensional menu which contains many of the instrument configuration parameters which may be selected. The options are grouped by function into titled sections. The main sections are RUN STATS, DETECTOR POSITIONS, SAMPLE
POSITIONS, DATA COLLECTION PARAMETERS, BEAMLINE PARAMETERS,
CALIBRATION, LASER POSITION, and SPECTRUM RUN NAME. These are used to setup the instrument before a run begins, and typicaly, these only need to be fixed once before beginning a run. If an option in the SETUP submenu is selected, it can be changed using either keyboard input or by another pop-up menu. After changing a parameter, that parameter changes from white to red. The red color indicates that the parameter has been selected for change, but it is not changed. After selecting the parameters in a section, one clicks on the section title to execute those changes.
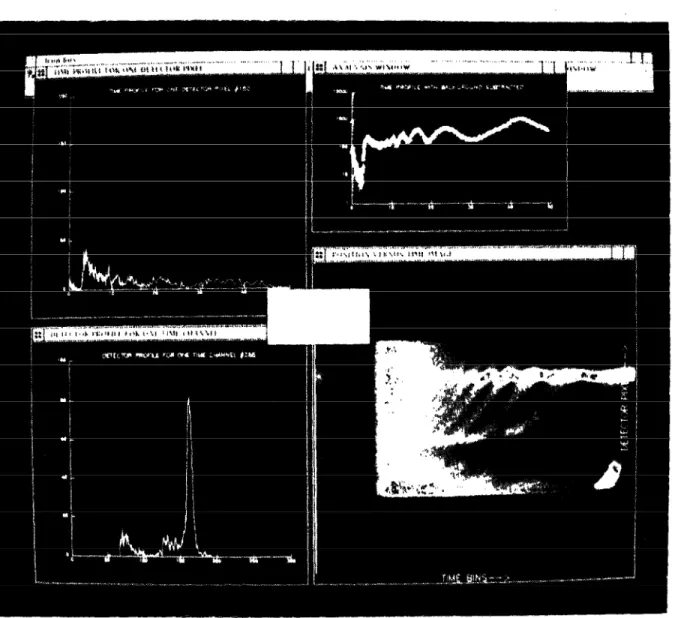
Fig. 3. This is an example of the QUICK LOOK option. Clockwise from the bottom right, we have the data image, a slice through the data image parallel to the detector axis, a slice through the data image parallel to the time axes,. and finally a time profile summed over several detector pixels.
The QUICK LOOK main menu item allows one to examine the current data set stored either in the Fastbus hardware memory or the data stored in the data archive. This_subroutine is the most important part of the WAVE program used on SPEAR.. Upon selecting thrs option, four wrndows appear which fill the’screen. Immediately afterward, a 3dimensional plot (referred to as an ‘image’y of the data appears on the screen where the x-axis is the time channel number, the y-axis is the detector pixel number and the intensities are represented by a blue-green-red color scale. A black and white photograph of this. is shown in the lower right corner if Fig. 3. This representation gives the user an instant overall view of the data. As can be seen in the figure, the brightest spot on the right represents the critical edge, and the individual elliptical shapes are the interference fringes. This representation also gives an immediate impression of the amount of diffuse scattering from the sample. The submenu items presented while the QUICK LOOK option is active are intended for reducing the image further. The DETECTOR PROFILE and TIME PROFlLE options allow one to plot a slice through a chosen point on the image. The DETECTOR PROJECTION and TIME PROJECTION selections produce plots where all of the data is collapsed onto either the detector or time axes, respectively.
The next QUICK LOOK submenu option is labeled CRUDE ANALYSIS. As this name implies, this is used as a frost step in reducing the image plot to a reflectivity curve. The two options in this selection are SUM WITH NO BACKGROUND SUBTRACTION and AUTO BOX. Both of these options allow one to select a minimum and maximum detector pixel value and sum the intensity in each time channel between these detector pixels. In the AUTO BOX option, a linear background defined by the two chosen detector pixels points is subtracted from the data. An example of a SUM WITH NO BACKGROUND SUBTRACTION is plotted in the upper right hand box as shown in Fig. 3. This data can be stored and divided by the incident spectrum to obtain a reflectivity curve.
There are two reasons for the term crude in CRUDE ANALYSIS. First, you can see that the specular peaks have an elliptical shape, this is because the finite resolution of the instrument allows for sampling over a range of incident and exit beam angles. Therefore, at a nominal setting for angle and time (or wavelength) there is a spread of the specularly reflected beam on the detector. At a given time, the spread in angles yields a spread in the values of the normal component of the wave vector, q,. In fact, the direction of the major axis of each of these ellipses is along the direction of constant q, all of which converge to 28/2 (or the horizon) at time t=O. Since the program doesn’t account for this tilt in the spectral peaks, using CRUDE ANALYSIS effectively diminishes the resolution of the instrument, and only a proper conversion of the data into reciprocal space should be used for the final data analysis.
The next QUICK LOOK submenu option is FILTER IMAGE. This is simply a choice of band pass or logarithmic filters to enhance the weak scattering in the image. Following the FILTER IMAGE option, SAVE ANALYZED DATA is used to save either the reduced data set created by CRUDE ANALYSIS or the entire data array can be saved for use in more rigorous analysis. The final option within QUICK LOOK is the PRINT COLOR IMAGE option. This simply calls a WAVE subroutine which creates a color PostScript* file to be sent to a color printer. After the data has been examined and reduced using the QUICK LOOK OPTIONS, the final main menu option becomes useful.
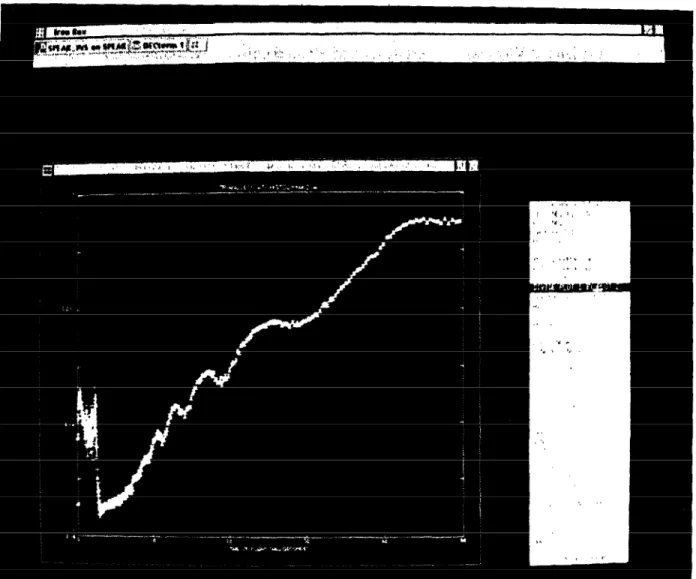
The last main menu option is the ANALYSIS option. This calls our WAVE program for plotting 2-dimensional curves. As can be seen in Fig. 4, most of the menu items in this selection are self explanatory. Most often, we use this program to plot the saved, reduced data, plot a second file (the incident spectrum), divide these and normalize the critical edge to one. The other selections such as log-linear plotting, adding error bars, resealing the axes, changing the color, size, and type of plotting symbol are available for enhancing the plots. Also, using the header infomlation stored in the saved reduced data file, the data can be instantly converted from time-of-flight to wavelength or to qZ in A-*. These plots may be sent to a PostScript printer for hardcopy output.
Fig. 4. This is a photograph of the ANALYZE option. In this mode, standard two dimensional manipulations of the data such as dividing by the spectrum, choosing plot axes, and converting to reciprocal space are performed.
V. DISCUSSION
The WAVE language has enabled us to write routines to perform complicated image and data processing with a minimal amount of time invested. We’ve illustrated several of the functions contained in the WAVE program developed for SPEAR. Using these image processing routines, we get an instant on-line overview of the data. In fact, we have discovered features in the data (especially in the diffuse scattering) that were not apparent using conventional contour and linear plots Fig. 3 (bottom right). The WAVE routines have allowed us to tailor the programs to the needs of the instrument while at the same time the raw data is obtained and stored as it is on any other instrument at LANSCE. Also, the menu options in WAVE have allowed us to present a set of options to our users for operating the instrument and performing the data analysis. Similarly, WAVE routines could be written for use on any of the LANSCE instruments and are especially suited for multi-detector measurements.
References
1. “Precision Visual’s Workstation Analysis and Visualization Environment*‘, PV-WAVE is a trademark of Precision Visuals Inc. of Boulder, Colorado.
2. R.O. Nelson, G. Cart, A. Gjovig, 3. A. Goldstone, D.B. McMillan, J. Ross, J. Seal, and D.R. Machen, IEEE Transactions on Nuclear Science, 34, ~1017 (1987).
3. VAX, VMS, and DCL are trademarks of Digital Equipment Corporation. 4. “PV-WAVE Overview,” Copyright 1988 by Precision Visuals Inc. pp 1-2.
5. “A Neutron Reflectometer for LANSCE?, Report of a Workshop Heald at the Los Alamos National Laboratory November 2-3 1987,” ed. D.K. Hyer, Los Alamos National Laboratory Conference Report, LA- 11301 -C( 1988).
6. “Condensed Matter Research at LANSCE,” ed D.K. Hyer, Los Alamos National Laboratory Publication, LALP 90-7(1990).
7. OrdeIa.Inc., Oak Ridge, Tennessee.
8. PostScript is a trademark of Adobe Systems Incorporated.
Q(M.Furusaka): How much is the software? Is it fast?
A(R.Pynn): I haven’t heard any complaints about speed. I’m afraid I can’t remember the price. It depends somewhat on the number of copies you buy. I suggest you contact the company directly.