DOI: 10.1534/genetics.108.087866
Single-Nucleotide-Polymorphism-Based Association Mapping
of Dog Stereotypes
Paul Jones,* Kevin Chase,
†Alan Martin,* Pluis Davern,
‡Elaine A. Ostrander
§and Karl G. Lark
†,1*The WALTHAM Centre for Pet Nutrition, Waltham on the Wolds, Leicsestershire LE14 4RT, United Kingdom, †Department of Biology, University of Utah, Salt Lake City, Utah 84112,‡Sundowners Kennels, Gilroy,
California 95020 and§National Human Genome Research Institute, National Institutes of Health, Bethesda, Maryland 20892
Manuscript received February 5, 2008 Accepted for publication March 12, 2008
ABSTRACT
Phenotypic stereotypes are traits, often polygenic, that have been stringently selected to conform to specific criteria. In dogs,Canis familiaris, stereotypes result from breed standards set for conformation, performance (behaviors), etc. As a consequence, phenotypic values measured on a few individuals are representative of the breed stereotype. We used DNA samples isolated from 148 dog breeds to associate SNP markers with breed stereotypes. Using size as a trait to test the method, we identified six significant quantitative trait loci (QTL) on five chromosomes that include candidate genes appropriate to regulation of size (e.g.,IGF1,IGF2BP2 SMAD2, etc.). Analysis of other morphological stereotypes, also under extreme selection, identified many additional significant loci. Less well-documented data for behavioral stereotypes tentatively identified loci for herding, pointing, boldness, and trainability. Four significant loci were identified for longevity, a breed characteristic not under direct selection, but inversely correlated with breed size. The strengths and limitations of the approach are discussed as well as its potential to identify loci regulating the within-breed incidence of specific polygenic diseases.
T
HE dog, ‘‘man’s best friend,’’ shares a large number of the complex phenotypes observed in human pop-ulations, including variation in morphology and behavior, as well as many types of polygenic disease. In the past decade, Canis familiaris has emerged as an excellent system for genetic analysis of complex phenotypes. Most of the advantages offered by the canine system over other mam-malian systems derive from its population structure (Ostrander and Kruglyak2000; Sutter et al.2004; Parkerand Ostrander2005; Goldstein et al.2006; Karlssonet al.2007; Parkeret al.2007). There are.350 distinct breeds recognized in the world today, many of which are isolates that have been, for the most part, selected for morphology and behavior. Over hundreds of years humans and dogs have formed a multitude of mutalistic relationships harnessing the phenotypic flexibility of the dog genome. New dog breeds were often developed by crossing individuals of unique breeds bearing desired features, followed by strong selection for the desired phenotypes (hunting ability, coat color, skull shape, body size, etc.), thus increasing the frequency of selected genotypes in the modern-day population. To be a registered member of a breed, both parents of an individual must have been registered members of the same breed. As a result, genetic heterogeneity is reduced within breeds, but is high across breeds (Parker et al.2004; Lindblad-Tohet al. 2005). Consequently, many phenotypes are either fixed or close to fixation in a large number of populations.
Genetic isolates have provided the key analyses of complex polygenic disease (Lindblad-Tohet al.2005; Goldstein et al. 2006; Karlsson et al. 2007; Parker
et al.2007) as well other phenotypes. However, the use of large numbers of such isolates has not, to date, been applied to allele trait association. The dog presents a unique opportunity to examine the power of this approach. Dog breeds, in which regions of the genome are ‘‘fixed,’’ can be treated in a manner similar to recombinant inbred populations: ‘‘Fixed’’ portions of a breed’s genome will remain invariant as long as the breeding population remains closed. These ‘‘fixed’’ aspects will continue to produce consistent phenotypes, and therefore the phenotype and genotype need not be measured on the same animal. Thus, both the allele frequency of a single nucleotide polymorphism (SNP) in fixed regions of the genome and the phenotype are characteristics of a breed. As a result, associating breed-specific genotypes with ‘‘fixed’’ phenotypes in multiple breeds (across-breed mapping) presents a powerful tool for identifying quantitative trait loci (QTL) that may form the genetic basis for the phenotypic diversity observed in dog breeds.
Similar approaches have been described using inbred mouse strains (Grupe et al. 2001; Liao et al. 2004; Pletcheret al. 2004; Wanget al. 2005), and these have
1Corresponding author:Department of Biology, University of Utah, 257 S.
1400 East, Room 201, Salt Lake City, UT 84102. E-mail: [email protected]
been combined with classical QTL analysis (Parket al. 2003; Dipetrilloet al.2004; Wanget al.2004; Cervino
et al.2005). However, the number of inbred mouse lines available are far fewer than the number of dog breeds, and the number of phenotypes offered by mice much fewer than what is offered by the nearly 300 breeds of domestic dog. Moreover, the genome structure of any inbred mouse line is far more restrictive than the ge-nomes that characterize a dog breed. Gege-nomes of dog breeds have far more heterozygosity and have survived for centuries in quite variable environments. In short, the selective environments experienced by any dog breed have been far less restricted than those used during the inbreeding procedures that give rise to an inbred mouse.
Ideally, two types of data are required for across-breed association analysis: (1) a common set of well-distributed, highly informative SNPs that characterize the entire ge-nome for each of many breeds and (2) a careful quan-titative evaluation of the fixed phenotypes associated with each breed. The phenotypes most amenable to this mapping strategy are those that have been under strin-gent selection, such as morphology and behavior. Here we analyze the genetic basis for size using across-breed mapping and then present examples of the technique applied to other classes of traits: additional morpholog-ical features, behavior, and the relationship between size and longevity.
MATERIALS AND METHODS
A total of 148 domestic dog breeds were characterized for a variety of sex-averaged phenotypes: height, weight, other mor-phology characters, longevity, and behavior. Phenotypic values used for the different breeds are summarized in supplemental Table 1. Height at the withers and weight were obtained from the published American Kennel Club (AKC) breed standards (American Kennel Club 1998). The residuals from the regression of WT0.33onto height were derived and used as a measure of shape (e.g., breeds that are heavier or lighter than other breeds of the same height; see supplemental Figure 1). ‘‘Short coat’’ (Wilcox andWalkowicz1995) was coded as a qualitative variable: 1 for all breeds with a very short coat as the standard and 0 for all others. ‘‘Ear bend’’ (Wilcoxand Walkowicz1995) was scored as the degree of bend in the ear on a scale from 1 (hanging low) to 4 (completely erect; cropped ears were not scored). ‘‘Tail curve’’ (Wilcox and Walkowicz1995) was scored as the degree of curve in the tail on a scale of 1 (straight) to 5 (tightly curled). Additional phenotypes were measured from breed pictures (Palmer 1994; Wilcoxand Walkowicz1995; http://images.google. com/) using the metrics described in Figure 1. Because the pictures utilized were not standardized, only ratios of these metrics could be used. The following ratios were defined using the metrics in Figure 1: (1) snout:head½a/(a1b); (2) snout height:head ½c/(a 1 b); (3) head:body ½(a 1 b)/e; (4) leg:body½(h1i)/e; (5) tail:body½f/e; (6) neck:body½j/e; and (7) chest:body (g/e).
Longevity data (supplemental Table 1) were compiled from a variety of sources (Michell 1999; http://users.pullman. com/lostriver/longhome.htm; KC/BSAVA 2004; Egenvall et al.2005). These represent data primarily from owner surveys.
One of us, Pluis Davern, an experienced dog trainer and judge (http://www.sundownerskennels.com/training.html; http://www. infodog.com/judges/17422/juddat.htm; http://www.akc.org/ breeders/resp_breeding/Articles/truetoform.cfm), scored be-havioral phenotypes as qualitative variables (0, 1, or NA). Four distinguishing patterns of dog behavior were scored: pointing, herding, boldness, and trainability. Additional behavioral data were taken from Hartand Miller(1985). Behavioral scores for the 148 breeds are in supplemental Table 1.
DNA collection and isolation:DNA samples were collected from dogs participating in AKC or otherwise sanctioned events, including dog shows, performance events, and obedi-ence and behavior trials. Samples were collected as either whole blood or by cheek swab by registered veterinarians or licensed veterinary technicians after obtaining the owner’s written consent. AKC or other registration numbers were collected on each dog, as was owner contact information, pedigree data, health history, and when possible, permission to recontact owners regarding future queries was also ob-tained. Wherever possible, care was taken to obtain samples from dogs unrelated at the grandparent level.
Blood samples were collected as whole blood in acid citrate dextrose or EDTA anticoagulation tubes. Buccal swabs were collected using standard protocols with Cytosoft cytology brushes (Medical Packaging, Camarillo, CA). DNA was ex-tracted from the brushes using a QIAamp blood mini kit (QIAGEN, Valencia, CA) following the manufacturer’s pro-tocol. DNA was extracted from the blood samples using a standard phenol/chloroform extraction method (Maniatis et al. 1982). Coded samples were aliquoted and stored for long-term use at70°. Information was entered into a My SQL custom database.
All procedures were performed in accordance with appro-vals from the Animal Care and Use Committees from the University of Utah, the National Human Genome Research Institute at the National Institutes of Health, and the Waltham Centre for Pet Nutrition, Mars.
Genotypes: Multiple breeds were characterized using a common set of SNP markers. Variation in the informativeness of marker alleles is presented in supplemental Figure 2. SNPs were selected for use that met the following criteria: (i) SNPs with aqscore.45 that have flanking sequence occurring only once in the genome sequence, (ii) SNPs that passed Illumina in-house suitability testing, (iii) SNPs where the minor allele was observed in$2 of 11 breeds tested; (iv) SNPs for which the minor allele was observed in$1 of 11 breeds as necessary, included to achieve complete coverage. The 25,073 SNPs resulting were filtered such that SNPs meeting all four criteria were added to the final data set sequentially if they were at least 380 Mb from all SNPs already in the data set. SNPs meeting criteria i, ii, and iv were then added, maintaining the minimal spacing. The resultant 4608 SNPs were submitted to Illumina to generate three oligo pools. DNA samples were submitted to Illumina for fast-track Golden Gate analysis (Fanet al.2006). For the experiments described, 2801 dogs representing 147 breeds were used. One hundred twenty-nine of these breeds were represented by $10 dogs (supplemental Figure 3, supplemental Table 3). DNA from each dog was genotyped using 1536 markers, of which 674 were spaced across the 38 canine autosomes. A total of 862 additional markers were con-centrated in regions of interest that showed maximal variation in allele frequency between breeds. The focused selections were chosen to further characterize areas that allowed breeds to be easily distinguished and may be linked to traits of interest (e.g., Sutter et al. 2007). As a result, the median distance between markers was 409 kb although only 26% of the genome was within 250 kb of a marker (supplemental Table 2). Details of SNP probe sequences associated with QTL and of the sequences in which these markers are imbedded are presented in supplemental Table 4 (see supplemental table legend). Relevant marker allele frequencies in different breeds are presented in supplemental Table 5.
SNP association:We tested for correlations between breed allele frequency (xi) and breed-characterized phenotypes (yi)
using a weighted Pearson product correlation:
rxy¼ P
wiðxixwÞ ðyiywÞ ffiffiffiffiffiffiffiffiffiffiffiffiffiffiffiffiffiffiffiffiffiffiffiffiffiffiffiffiffiffiffiffiffiffiffiffiffiffiffiffiffiffiffiffiffiffiffiffiffiffiffiffiffiffiffiffiffiffiffiffiffi P
wiðxixwÞ2PwiðyiywÞ2
p ;
where yw¼
P
wiyi=
P
wi; xw¼
P
wixi=
P
wi andwi¼ ffiffiffiffiffini p
, whereniis the number of animals for breedi.
Two measures of significance were important: single SNPP -value and genomewide P-value (e.g., the probability of a particularrxyvalue in a single test and the multi-test correction
when testing all SNPs across the genome, respectively). We used permutation tests to establish the null distribution of the rxy statistic for each SNP and for each phenotype. A
generalized extreme value distribution was fit to the empirical ‘‘null’’ data using the gevFit function of the fExtremes package (Wuertz 2006) for R (R Development Team 2006). The Kolmogorof–Smirnoff test (Conover1971) of the R package (ks.test) was used to test the goodness of fit. Distributions with a ks.test P-value of#0.01 were considered poorly estimated and dropped from further analysis. The significance of rxy
values were estimated using the cumulative probability func-tion (pgev) andlog10transformed for convenience (logP).
For each permutation, the maximum score across all SNPs was recorded as the single genome-scan maximum. Genome-scan maximum values from 1000 permutations were used to estimate the null distribution of a genomewide scan. The 90, 95, and 99% percentiles of this distribution were used as the thresholds from genomewide significance of 0.1, 0.05, and 0.01, respectively.
Power to detect association: We estimated the power to detect association with a neighboring marker allele as a function of the number of breeds available. In Figure 2, it can be seen that the power to identify an association drops off rapidly as the number of breeds decreases. This loss of power becomes particularly relevant when phenotypes have been evaluated in only a small number of breeds.
Markers were considered informative if they had awide range of allele frequencies across breeds. Conversely, a SNP for which both alleles displayed equal frequency across all breeds was uninformative. We estimated the power to detect an associa-tion as a funcassocia-tion of allele-frequency variaassocia-tion among breeds. The significance (logP) of a single-marker test for differently modeled situations is graphed in Figure 3 (y-axis) as a function of the distance between the SNP markers (x-axis). Three patterns of variation in the SNP allele frequency among breeds were considered (Figure 3, insets): histograms representing the number of breeds (y-axis) in each allele-frequency bin (x-axis). The ability to detect QTL increases with increasing variation of its occurrence in different breeds.
of breed count used for weights (Chambers1992). The ‘‘glm’’ function of R was used with the option family¼‘‘binomial’’ to carry out a logistic regression (Hastieand Pregibon1992). The ‘‘regress’’ function was used to carry out a mixed-model analysis (Cliffordand McCullagh2006) with allele counts as the fixed effects and the breed similarity matrix as the random effects. The variance matrix between breeds was calculated as the similarity between all pairs of breeds using markers separated by at least 500,000 bp. We defined the similarity between two breeds as one minus the average absolute difference in allele frequency across all markers (see supplemental Table 6 for all similarity values). Thus, breeds that are identical had a similarity score of 1 and breeds that were completely different had similarity scores of 0. A leave-one-out strategy was used to predict breed phenotypes with the mixed model. Coefficients estimated from the data with a breed left out were used to predict the phenotype of that breed (see supplemental Figure 4).
RESULTS
Morphology: A number of genes regulating size or shape have been identified in different mammals (hu-mans, mice, rats, or dogs). Several of these regulate rel-atively large amounts of phenotypic variation (e.g.,IGF-1, IGF-2). Identifying QTL containing such candidate genes provided evidence suggesting that the method proposed was robust.
Selected regions of the genome were examined using a SNP scan of 148 breeds. Using association analysis, several QTL were identified for size (WT) and shape (HT and residuals of WT0.33 regressed on to height).
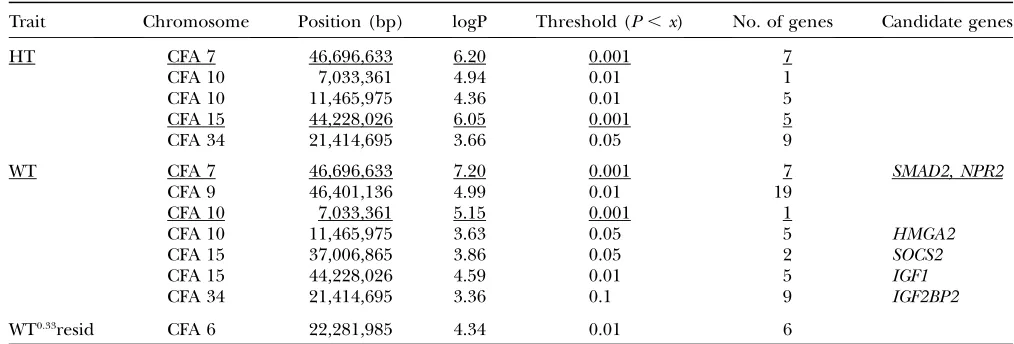
Table 1 presents the location and characterization of the loci for which the most evidence was accrued. Loci regulating both height-at-the-withers and body weight are located onCanis familiarisautosome (CFA) 7, 10, 15, and 34, whereas the locus on CFA 9 regulates only body weight. When Wt0.33 is regressed onto height at the withers, a variation in shape can be distinguished that represents differences between breeds that range from dogs that are thin for their height (pursuit hounds such as the greyhound, Afghan hound, or whippet, as well as some smaller dogs such as the fox terrier) to ones that have a large body mass for their height (see supplemen-tal Figure 3). The locus on CFA 6, associated with this phenotype, was not associated with either height or weight. In the Portuguese water dog (Larket al. 2006), a highly significant locus on CFA 12 that regulates an inverse correlation between limb bone length and width was identified. This locus was not identified with genomewide significance in the present across-breeds WT0.33 residual scan, but it was found in that scan at a significance that validated the pre-identified locus from the Portuguese water dog. Such instances of lowered significance may reflect a low frequency of breeds in which a locus has been fixed.
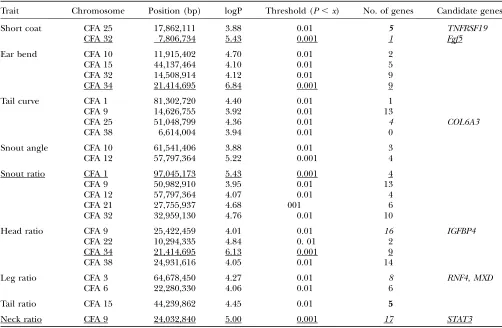
associating SNPs from multiple breeds with breed-specific metrics may facilitate association mapping of complex, polygenic phenotypes (across-breed mapping). Mapping breed characters: In many breeds, a num-ber of other desired morphological traits have been under stringent selection and thus should be fixed. Descriptions of these phenotypes are presented in the materials and methods. Their distribution among breeds is presented in supplemental Table 1. We have used across-breed association mapping to identify pu-tative QTL for many of these (Table 2). In all, 10 traits were associated with 26 loci distributed over 14 chro-mosomes at a significance better thanP,0.01. As ex-pected, many of these QTL (10) were identified at high significance, exceeding a genomewide threshold ofP# 0.001. QTL for two aspects of snout size or shape were associated with the same SNP on CFA 12; both the length of tail and the degree to which ears are erect were associated with a locus on CFA 15 that also is associated with overall size (see Table 1); similarly, size of snout and erectness of ears were associated with another size locus on CFA 34; and two closely linked loci on CFA 9 regulate variation in the size of the neck or head. Again, suggestive candidate genes were found associated with some of these QTL:TNFRSF19andFgf5with short coat and COL6A3 with the degree of tail curvature. As expected, this mapping technique appears to be very powerful for phenotypes that are very close to fixation and also are found in a large number of breeds, the optimal proportion approaching 50% of the breeds analyzed.
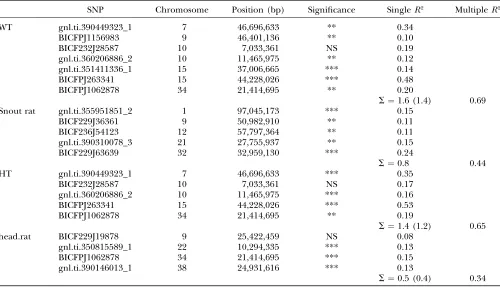
Additional tests for significance and effects of breed structure: QTL identified by single-marker tests may implicate causative regions of the genome, or they may represent false positives: shadow effects resulting from autocorrelations in the data. False-positive results may be caused by unequal sharing of genome regions be-tween the breeds (breed structure), coselection of multiple unlinked regions, and/or codependence of unlinked genome regions (interactions). Multiple-regression analysis provides an estimate of the indepen-dence of the loci regulating a trait. QTL that deviate from the additive-independent model will not remain significant in a multiple regression and may represent false positives or more complex effects. QTL may appear less significant (or not significant) in a multiple re-gression if they were coselected with other loci, or if they are involved in interactions with other loci. Table 3 presents the results of multiple-regression analyses of those traits in Tables 1 and 2 that are associated with multiple loci. Several loci either were not significant or demonstrated marginal significance. In all but one instance, the sum of the significant single regressionR2 values greatly exceeded the multipleR2value, suggesting that some loci were not causative or that interactions and/or coselection were occurring. In the case of weight, there was an apparent interactive effect, P ¼
0.0009, between the major locus on CFA 15 (associated with SNP BICFPJ263341 at 44 Mbp) and the locus on CFA 10 (associated with SNP gnl.ti.360206886_2 at 11.5 Mbp). This interaction remains significant in the regression (0.026) and in the mixed multiple-TABLE 1
Details of QTL for size-related traits
Trait Chromosome Position (bp) logP Threshold (P,x) No. of genes Candidate genes
HT CFA 7 46,696,633 6.20 0.001 7
CFA 10 7,033,361 4.94 0.01 1
CFA 10 11,465,975 4.36 0.01 5
CFA 15 44,228,026 6.05 0.001 5
CFA 34 21,414,695 3.66 0.05 9
WT CFA 7 46,696,633 7.20 0.001 7 SMAD2, NPR2
CFA 9 46,401,136 4.99 0.01 19
CFA 10 7,033,361 5.15 0.001 1
CFA 10 11,465,975 3.63 0.05 5 HMGA2
CFA 15 37,006,865 3.86 0.05 2 SOCS2
CFA 15 44,228,026 4.59 0.01 5 IGF1
CFA 34 21,414,695 3.36 0.1 9 IGF2BP2
WT0.33resid CFA 6 22,281,985 4.34 0.01 6
regression model (0.003; see below). Coselection can mimic a significant interaction effect in this situation (seediscussion). For one trait, the ratio of head to body metrics (‘‘head ratio’’), the sum of the three significant individualR2 values was only slightly greater than the multipleR2value, suggesting that these loci might be acting independently.
Considerable population structure exists among dog breeds (Parkeret al. 2004). Using the popgen (Marchini 2004) package of R, we estimated measures of diversity among these breeds (Nicholsonet al.2002). The mean ‘‘c’’ (analogous to FST) value is 0.25 with individual
breed values ranging from 0.05 to 0.61. In an across-breed association analysis, noncausative (shadow) loci may result from effects of population substructure due to genetic relatedness among breeds. To test for this, we used a mixed-model analysis (see materials and methods) to predict trait values of weight as well as head:body ratio (head ratio). We found that all of
the significant QTL for weight or head ratio (Table 3) remained significant in a mixed model correcting for genetic relatedness of breeds, with P-values ranging from 102to,105for weight and,103for the three significant head/rat loci.
Examples illustrating the future potential of the mapping technique:Longevity and size:In general, dogs representing breeds of small size (e.g., Pekingese, toy poodle, terrier breeds) live appreciably longer than those from larger-sized breeds (e.g., Great dane, St. Bernard, Irish wolfhound) (Egenvallet al.2005). We have mapped loci for longevity using multiple breeds spanning a comprehensive range of sizes. An analysis of breed longevity had been compiled by K. Cassidy (http:// users.pullman.com/lostriver/longhome.htm), but many of the breeds for which we had genotypes were not included in that database. We therefore prepared a similar database for all breeds genotyped in our study using a variety of website resources (supplemental Table TABLE 2
QTL associated with breed morphological characteristics
Trait Chromosome Position (bp) logP Threshold (P,x) No. of genes Candidate genes
Short coat CFA 25 17,862,111 3.88 0.01 5 TNFRSF19
CFA 32 7,806,734 5.43 0.001 1 Fgf5
Ear bend CFA 10 11,915,402 4.70 0.01 2
CFA 15 44,137,464 4.10 0.01 5
CFA 32 14,508,914 4.12 0.01 9
CFA 34 21,414,695 6.84 0.001 9
Tail curve CFA 1 81,302,720 4.40 0.01 1
CFA 9 14,626,755 3.92 0.01 13
CFA 25 51,048,799 4.36 0.01 4 COL6A3
CFA 38 6,614,004 3.94 0.01 0
Snout angle CFA 10 61,541,406 3.88 0.01 3
CFA 12 57,797,364 5.22 0.001 4
Snout ratio CFA 1 97,045,173 5.43 0.001 4
CFA 9 50,982,910 3.95 0.01 13
CFA 12 57,797,364 4.07 0.01 4
CFA 21 27,755,937 4.68 001 6
CFA 32 32,959,130 4.76 0.01 10
Head ratio CFA 9 25,422,459 4.01 0.01 16 IGFBP4
CFA 22 10,294,335 4.84 0. 01 2
CFA 34 21,414,695 6.13 0.001 9
CFA 38 24,931,616 4.05 0.01 14
Leg ratio CFA 3 64,678,450 4.27 0.01 8 RNF4,MXD
CFA 6 22,280,330 4.06 0.01 6
Tail ratio CFA 15 44,239,862 4.45 0.01 5
Neck ratio CFA 9 24,032,840 5.00 0.001 17 STAT3
1). Figure 4 compares longevity/size data between the two databases. The negative correlation between age of death (AOD) and size is obvious. The slope of the regression of size onto longevity is the same in both data sets, although the difference in intercepts indicates that the database that we developed yields an average age of death that is older. This may be due to the fact that Cassidy’s data utilized information from both veterinar-ian records and owner responses to questionnaires, whereas our data were biased toward owner surveys, which typically prefer to reference longer-lived animals. Although this may produce an inflated mean value of AOD, it presents a more sensitive signal for genetic analysis. We therefore utilized our larger database, together with the genotyping used in Table 1, to identify QTL for breed-associated age of death (Table 4).
Included in Table 4 are data indicating the presence or absence of size loci associated with the same SNP. Seven loci were identified, three of which, CFA 7, 10, and 15 were associated with significant size (as in weight) loci. These were also the most significant loci for longevity. A fourth, on CFA 34, was associated with a less-significant weight locus. Loci on CFA 9, 23, and 25,
although quite significant for age of death, were not significant for size with the exception of the locus on CFA 9, which is linked to a very significant size locus (see Table 1). When these age-of-death loci were combined in a multiple regression, three on CFA 10, 25, and 34 were no longer significant and the multiple R2was ap-proximately half the value of the sum of the single R2 values.
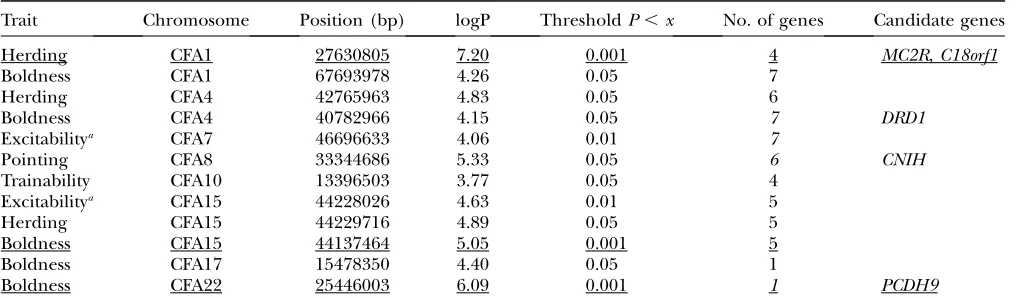
Behavior: Two aspects of dog behavior that appear to be highly breed specific are herding and pointing. Pluis Davern, a nationally recognized dog trainer qualified to judge a large number of breeds (http://www.infodog. com/judges/17422/juddat.htm), scored the 148 geno-typed breeds for two additional phenotypes: ‘‘boldness vs.timidity’’ and ‘‘trainability.’’ Behavioral scores for the 148 breeds are presented in supplemental Table 3. Using these scores, we identified several loci of interest (Table 5). We identified one locus for pointing on CFA 8 with a genomewide significance threshold of 0.01,P,
0.05. Three loci were detected for herding; these were located on CFA 1 (P,0.01) and on CFA 4 and CFA15 (0.01,P,0.05). While the boldness and trainability gestalts are subjective, and at best descriptive, we TABLE 3
Single- and multiple-regression results for selected traits with multiple QTL
SNP Chromosome Position (bp) Significance SingleR2 MultipleR2
WT gnl.ti.390449323_1 7 46,696,633 ** 0.34
BICFPJ1156983 9 46,401,136 ** 0.10
BICF232J28587 10 7,033,361 NS 0.19
gnl.ti.360206886_2 10 11,465,975 ** 0.12
gnl.ti.351411336_1 15 37,006,665 *** 0.14
BICFPJ263341 15 44,228,026 *** 0.48
BICFPJ1062878 34 21,414,695 ** 0.20
S¼1.6 (1.4) 0.69
Snout rat gnl.ti.355951851_2 1 97,045,173 *** 0.15
BICF229J36361 9 50,982,910 ** 0.11
BICF236J54123 12 57,797,364 ** 0.11
gnl.ti.390310078_3 21 27,755,937 ** 0.15
BICF229J63639 32 32,959,130 *** 0.24
S¼0.8 0.44
HT gnl.ti.390449323_1 7 46,696,633 *** 0.35
BICF232J28587 10 7,033,361 NS 0.17
gnl.ti.360206886_2 10 11,465,975 *** 0.16
BICFPJ263341 15 44,228,026 *** 0.53
BICFPJ1062878 34 21,414,695 ** 0.19
S¼1.4 (1.2) 0.65
head.rat BICF229J19878 9 25,422,459 NS 0.08
gnl.ti.350815589_1 22 10,294,335 *** 0.13
BICFPJ1062878 34 21,414,695 *** 0.15
gnl.ti.390146013_1 38 24,931,616 *** 0.13
S¼0.5 (0.4) 0.34
nevertheless found one significant (P,0.01) locus for trainability on CFA 10 as well as five for boldness on CFA 15 and 22 (P,0.01) and on CFA 1, 4, and 17 (0.01,P
, 0.05). In a multiple regression, all of the loci for boldness remained significant. The locus on CFA 15 is interesting in that it does not appear to be related to size, as approximately equal numbers of large and small breeds were found to be bold (see supplemental Table 3), and boldness and size were not correlated (r¼0.18; P¼0.3). Possible candidate genes are listed in Table 5 for herding and pointing, along with two of the boldness QTL. Included in Table 5 are data for excitability (comprising 56 breeds) taken from Hartand Miller (1985). Two significant QTL were identified on CFA 7 and 15. Both coincided with major-size loci. Unlike the relationship between boldness and size, excitability was highly correlated with size (r¼ 0.8;P,1012, despite the small data set (56 breedsvs. the 148 used in the analysis of boldness).
DISCUSSION
Three powerful genetic procedures are now available using a canine model:
1. Segregation in planned crosses or within a breed population can be used to identify loci for simple and
complex phenotypes. This approach takes advantage of the large LD distances that can be attributed to founder effects and bottlenecks (for example, Mignotet al. 1991; Aclandet al. 1998, 1999; Lingaas
et al. 1998; Van deSluiset al. 1999; Jonasdottiret al. 2000; Chaseet al. 2005a, 2006; Todhunteret al. 2005). 2. LD mapping across breeds has been used to reduce haplotypes of simple and complex phenotypes to reasonably small DNA sequences and often to iden-tify single genes (Clarket al.2006; Goldsteinet al. 2006; Karlsson et al. 2007; Parker et al. 2007; Sarganet al. 2007).
3. The across-breed mapping method described here, which combines association with multiple-breed LD mapping, thereby associating small regions of the genome with the phenotype, can be used.
et al. 2007). In addition, we have found a number of loci affecting morphology, some of which may be indepen-dent regulators of the relation of the size of the skull to the post-cranial body. For these and other traits, the LD
distance associated with any SNP is 500 kb. This is much smaller than the LD distance associated with markers when mapping within a single breed (Sutter
et al.2004). Nevertheless, as seen in Tables 1, 2, and 5, many genes remain to be explored in searching for alleles that regulate the phenotypes in question (in the data presented, this number ranges from 1 to 19, depending on the QTL).
Most often, across-breed mapping identifies markers that tend to be near or at fixation (homozygous) in breeds with the associated phenotype. Breeds in which the phenotype is still segregating will not contribute to the power of QTL identification. However, they will provide a resource in which the association can be validated using within-breed segregation analysis. Such breeds are readily identified from the across-breed SNP genotyping database. It should be possible now to validate the most significant (P # 0.001) of the other loci in Table 2 using breeds in which the implicated SNPs are segregating½e.g., the locus on CFA 32 for short coat (Table 2) was identified by segregation analysis using dachshunds or corgis (Housley and Venta 2006).
Limitations to across-breed mapping will always ne-cessitate validation using within-breed segregation anal-ysis. One limitation of the method is the potential for false positives that may arise from population structure, whereby causative regions of the genome displaying significant associativeP-values cannot be distinguished from noncausative ones. Our simple association analysis has made the assumption that dog breeds are indepen-TABLE 4
QTL associated with AOD and the probability that size is also associated with that SNP
Trait Chromosome
Position
(bp) logP
Threshold P,x
Age of death CFA 7 46,696,633 7.06 0.001
Size CFA 7 46,696,633 7.73 0.001
Age of death CFA 9 48,230,567 4.18 0.01
Size CFA 9 48,230,567 2.82 .0.1
Age of death CFA 10a 7,033,361 4.46 0.01
Size CFA 10a 7,033,361 5.15 0.001
Age of death CFA 15 44,228,026 8.94 0.001
Size CFA 15 44,228,026 4.59 0.01
Age of death CFA 23 35,509,334 4.12 0.01
Size CFA 23 35,509,334 2.58 .0.1
Age of death CFA 25a 18,193,826 3.94 0.05
Size CFA 25 18,193,826 2.55 .0.1
Age of death CFA 34a 21,414,695 3.73 0.05
Size CFA 34 21,414,695 3.36 0.1
Trait, chromosome (CFA), logP, and significance (genome-wideP-value threshold) are as in Table 2. Genomewide signif-icance thresholds for logP for association with AOD were 3.27 forP# 0.1, 3.45 forP#0.05, and 3.95 forP#0.01. Most significant are in italics. Thresholds for size were 3.26 for P#0.1, 3.45 forP#0.05, and 4.00 forP#0.01.
aLoci no longer significant in a multiple-regression model (see text).
TABLE 5
QTL associated with behavior
Trait Chromosome Position (bp) logP ThresholdP,x No. of genes Candidate genes
Herding CFA1 27630805 7.20 0.001 4 MC2R,C18orf1
Boldness CFA1 67693978 4.26 0.05 7
Herding CFA4 42765963 4.83 0.05 6
Boldness CFA4 40782966 4.15 0.05 7 DRD1
Excitabilitya CFA7 46696633 4.06 0.01 7
Pointing CFA8 33344686 5.33 0.05 6 CNIH
Trainability CFA10 13396503 3.77 0.05 4
Excitabilitya CFA15 44228026 4.63 0.01 5
Herding CFA15 44229716 4.89 0.05 5
Boldness CFA15 44137464 5.05 0.001 5
Boldness CFA17 15478350 4.40 0.05 1
Boldness CFA22 25446003 6.09 0.001 1 PCDH9
The genomewide SNP scan (see Table 2) was used to associate SNP markers with several behavioral phenotypes: pointing, herd-ing, boldness, and trainability. Scoring for these phenotypes is presented in supplemental Table 3. From left to right (top), col-umns list the trait, chromosome, nucleotide position on the chromosome, the logP value of the significance, the genomewide threshold of significance, the number of known genes in the LD interval (400 kb), and possible candidate genes. More significant loci are underlined. The genomewide significance thresholds for the four traits were herding, 0.01,P,0.05¼4.38 andP#0.01 ¼5.04; pointing, 0.01,P,0.05¼4.69 andP#0.01¼5.69; boldness, 0.01,P,0.05¼4.09P#0.01¼4.81; and trainability, 0.01,P,0.05¼3.48 andP#0.01¼3.86.
a
dent of each other. However, this is rarely the case. Breed structure is the network of haplotype regions shared between breeds. For example, we would expect a high proportion of sharing between the genomes of the standard and the toy poodle, although we expect sig-nificant differences in regions with loci related to control of size. The meanFSTbetween the breeds used
in our study is 0.25 (SD¼0.11), indicating that they have not diverged greatly. Moreover, principal component (PC) analysis of the allele frequencies (data not pre-sented) shows that the allele shared between breeds is not coherent (e.g., the first PC explains only 4% of the total variation in allele frequency). Thus, different breeds share different parts of the genome.
Reviewing similar techniques applied to inbred mouse strains, Payseur and Place (2007) have sum-marized the power and pitfalls of the technique (e.g., they showed that unequal relatedness between strains can give rise to false-positive associations, since causative regions of the genome may be co-inherited with non-causative regions). Studies in the mouse suggest exten-sions to this technique in the dog as more robust SNP and phenotype data become available: (1) use of SNP haplotypes spanning a small physical distance (e.g., 300 kb) instead of single SNP alleles (Karlssonet al.2007; SalmonHillbertzet al.2007; Sutteret al.2007), (2) correction for relatedness between breeds using mixed-model analysis, (3) balanced representation of breeds, and (4) correction for nonsystenic LD by testing multiple loci in the same model.
We have used an across-breed averaged correction for breed structure to correct for effects of breed structure on weight and head-to-body ratio and a multi-QTL regression model to rule out nonsystenic LD among loci that we have detected. Nevertheless, interactions and coselection can result in false positives and, as with mouse inbred strains, it will always be necessary to validate loci.
The current data set has several limitations. In Figure 2, we presented evidence that significance is limited to 250 kb on each side of a SNP. By this criterion, our database analyzes only 26% of the genome with the remainder not considered in the association mapping that identified the loci used in the multiple-regression model in Table 3. Therefore, within-breed validation of segregating loci will be required to completely rule out nonsystemic LD. Beyond shadow effects, there remain other complex effects, such as interactions between loci and/or coselection of loci during breed formation that may confound results. The data in Table 3 indicate that such effects may be present for most of the traits examined.
In the future, genotyping platforms should offer deeper coverage of the genome (50,000 well-placed and informative SNPs), more robust and balanced breed representation, and more dogs per breed (30– 50). Finally, improved phenotypic characterization of breed stereotypes is needed.
Phenotypes that have been under stringent selection are best suited to across-breed association mapping, and this is apparent in the data in Table 2 where highly significant values for several stringently selected mor-phological QTL were observed. Similarly, stringent selection for behavior may be responsible for the be-havioral loci identified here. Candidate genes associated with these loci (Table 5) include ones that might be expected to play a major role in regulating behavior: MC2R on CFA 1 (27,381,939 bp) is a melanocortin re-ceptor, and C18orf1 (27,572,327 bp) has been impli-cated in schizophrenia. DRD1, on CFA 4 (40,743,436 bp), encodes a dopamine subtype receptor. CNIH, on CFA 8 (33,396,000 bp), has been implicated in cranial nerve development. Finally, PCDH9, on CFA 22 (24 273 482 bp), encodes a protein localized to syn-aptic junctions and believed to be involved in specific neural connections and signal transduction. Although the behaviors involved are poorly defined, the pres-ence of candidate genes appropriate to behavior is encouraging.
Despite the likely possibility of false positives, the across-breed mapping technique can focus attention on loci that may regulate genetic differencesbetweenbreeds when these cannot be investigated using segregation within breeds. In an extensive study of within-breed longevity involving many different breeds, Galiset al. (2007) were unable to find evidence for an inverse cor-relation between longevity and size and neither have we seen such an inverse correlation in Portuguese water dogs that display a range of sizes approaching threefold (our unpublished data). The peculiar inverse correla-tion between longevity and size seen in Figure 4 is strictly a between-breed phenomenon and provides an excel-lent example of a trait that can be approached with across-breed mapping. The data in Table 4 suggest that a subset of loci, which control body size, also contribute to longevity, with some playing a greater role in the aging process than others.
Across-breed mapping depends on variants of the genomic architecture that are relatively fixed in a large number of different breeds. Given accurate estimations of breed-disease frequency, this technique can be used to determine the impact of the breed-fixed genome regions on the disease. All of these breeds represent ‘‘successful’’ genome architectures. While some may be more or less prone to a disease, they are still functional productive genomes. It is not likely that a large number of breeds harbor a single deleterious mutation that can be detected in this fashion. Thus, it is likely that one of several functional genome variants will predispose to a disease state as, for example, one might encounter with size loci where particular alleles may predispose toward orthopedic diseases.
only if disease reporting is accurate. While databases of disease frequency exist, they are often based on breeder-directed health surveys and inherent biases exist. More useful may be the growing number of veterinary school databases spanning several years.
The quality of genotypic data is paramount as well. Ideally, large public databases providing comprehensive SNP data on50 independent lineages for most AKC-recognized dog breeds should be made available as the genotypic breed standard for future mapping studies. Such an effort, termed CanMap (http://www.sciencemag. org/cgi/content/full/sci;317/5845/1668), is currently underway in an effort initially involving investigators from Cornell, the University of California at Los Angeles, and the National Human Genome Research Institute (Pennisi2000). The initial end point will be a public repository of dense SNP profiles of about a dozen dogs from each of nearly a hundred breeds, plus a set of wild canids, which together will be an invaluable resource for the genetic dissection of complex polygenic diseases, a large number of which are common to both dogs and humans.
In summary, across-breed mapping is another facet of the canine model that complements within-breed map-ping and LD mapmap-ping. It implicates new regions of interest and can provide validation of previously iden-tified loci.
We thank the thousands of pet owners who provided samples and data about their dogs for their participation and support of this work and the many dog show organizers who kindly allowed us to have collection stands to gather these samples for dog research. We thank John Fondon, III, and Heidi Parker for helpful comments regarding this manuscript. We gratefully acknowledge funding from the Judith Chiara Family Trust and National Institutes of Health GM063056 (K.G.L. and K.C.), the Intramural Program of the National Human Genome Research Institute (E.A.O.), and Mars (A.M. and P.J.).
LITERATURE CITED
Acland, G. M., K. Ray, C. S. Mellersh, W. Gu, A. A. Langstonet al.,
1998 Linkage analysis and comparative mapping of canine pro-gressive rod-cone degeneration (prcd) establishes potential locus homology with retinitis pigmentosa (RP17) in humans. Proc. Natl. Acad. Sci. USA96:3048–3053.
Acland, G. M., K. Ray, C. S. Mellersh, W. Gu, A. A. Langstonet al.,
1999 A novel retinal degeneration locus identified by linkage and comparative mapping of canine early retinal degeneration. Genomics59:134–142.
AmericanKennelClub, 1998 The Complete Dog Book.Howell Book
House, New York.
Cervino, A. C., G. Li, S. Edwards, J. Zhu, C. Laurieet al., 2005
In-tegrating QTL and high-density SNP analyses in mice to identify Insig2 as a susceptibility gene for plasma cholesterol levels. Genomics86:505–517.
Chambers, J. M., 1992 Linear models, pp. 99–116 inStatistical
Mod-els in S, edited by J. M. Chambersand T. J. Hastie. Wadsworth &
Brooks/Cole, Belmont, CA.
Chase, K., D. R. Carrier, F. R. Adler, T. Jarvik, E. A. Ostrander
et al., 2002 Genetic basis for systems of skeletal quantitative traits: principal component analysis of the canid skeleton. Proc. Natl. Acad. Sci. USA99:9930–9935.
Chase, K., D. F. Lawler, D. R. Carrier and K. G. Lark,
2005a Genetic regulation of osteoarthritis: a QTL regulating
cra-nial and caudal acetabular osteophyte formation in the hip joint of the dog (Canis familiaris). Am. J. Med. Genet.135A:334–335. Chase, K., D. Carrier, F. Adler, E. Ostrander and K. Lark,
2005b Interaction between the X chromosome and an auto-some regulates size sexual dimorphism in Portuguese water dogs. Genome Res.15:1820–1824.
Chase, K., D. Sargan, K. Miller, E. A. Ostranderand K. G. Lark,
2006 Understanding the genetics of autoimmune disease: two loci that regulate late onset Addison’s disease in Portuguese wa-ter dogs. Int. J. Immunogenet.33:179–184.
Clark, L. A., J. M. Wahl, C. A. Rees and K. E. Murphy,
2006 Retrotransposon insertion in SILV is responsible for merle patterning of the domestic dog. Proc. Natl. Acad. Sci. USA103:1376–1381.
Cleveland, W. S., 1981 LOWESS: a program for smoothing
scatter-plots by robust locally weighted regression. Am. Stat.35:54. Clifford, D., and P. McCullagh, 2006 regress: Gaussian linear
models with linear covariance structure. R package version 1.0–0. http://galton.uchicago.edu/clifford/.
Conover, W. J., 1971 Practical Nonparametric Statistics, pp. 295–301,
309–314. John Wiley & Sons, New York.
Dipetrillo, K., S. W. Tsaih, S. Sheehan, C. Johns, P. Kelmenson
et al., 2004 Genetic analysis of blood pressure in C3H/HeJ and SWR/J mice. Physiol. Genomics17:215–220.
Egenvall, A., B. N. Bonnett, A. Hedhammar and P. Olson,
2005 Mortality in over 350,000 insured Swedish dogs from 1995–2000: II. Breed-specific age and survival patterns and rela-tive risk for causes of death. Acta Vet. Scand.46:121–136. Fan, J. B., M. S. Cheeand K. L. Gunderson, 2006 Highly parallel
genomic assays. Nat. Rev. Genet.7:632–644.
Galis, F., I. VanDerSluijs, T. J. VanDooren, J. A. Metzand M.
Nussbaumer, 2007 Do large dogs die young? J. Exp. Zoolog.
B Mol. Dev. Evol.308:119–126.
Goldstein, O., B. Zangerl, S. Pearce-Kelling, D. Sidjanin, J. Kijas
et al., 2006 Linkage disequilibrium mapping in domestic dog breeds narrows the progressive rod-cone degeneration interval and identifies ancestral disease-transmitting chromosome. Ge-nomics88:541–550.
Grupe, A., S. Germer, J. Usuka, D. Aud, J. K. Belknapet al., 2001 In
silico mapping of complex disease-related traits in mice. Science.
292:1915–1918.
Hart, B. L., and M. F. Miller, 1985 Behavioral profiles of dog
breeds. J. Am. Vet. Med. Assoc.186:1175–1180.
Hastie, T. J., and D. Pregibon, 1992 Generalized linear models,
pp. 195–246 inStatistical Models in S, edited by J. M. Chambers
and T. J. Hastie. Wadsworth & Brooks/Cole, Belmont, CA.
Housley, D. J., and P. J. Venta, 2006 The long and the short of it:
evidence that FGF5 is a major determinant of canine ‘hair’-itabil-ity. Anim. Genet.37:309–315.
Jonasdottir, T. J., C. S. Mellersh, L. Moe, R. Heggebo, H. Gamlem
et al., 2000 Genetic mapping of a naturally occurring hereditary renal cancer syndrome in dogs. Proc. Natl. Acad. Sci. USA97:
4132–4137.
Karlsson, E. K., I. Baranowska, C. M. Wade, N. H. C. Salmon
Hillbertz, M. C. Zodyet al., 2007 Efficient mapping of
Men-delian traits in dogs through genome-wide association. Nat. Genet.
39:1321–1328
KC/BSAVA, 2004 KC/BSAVA Purebred dog health survey. United Kingdom Kennel Club and British Small Animal Veterinary Asso-ciation. http://www.thekennelclub.org.uk/item/549.
Lark, K. G., K. Chaseand N. B. Sutter, 2006 Genetic architecture
of the dog: sexual size dimorphism and functional morphology. Trends Genet.22:537–544.
Liao, G., J. Wang, J. Guo, J. Allard, J. Chenget al., 2004 In silico
genetics: identification of a functional element regulating H2-Ealpha gene expression. Science306:690–695.
Lindblad-Toh, K., C. M. Wade, T. S. Mikkelsen, E. K. Karlsson, D.
B. Jaffeet al., 2005 Genome sequence, comparative analysis and
haplotype structure of the domestic dog. Nature438:803–819. Lingaas, F., T. Aarskaug, M. Sletten, I. Bjerkas, U. Grimholtet al.,
1998 Genetic markers linked to neuronal ceroid lipofuscinosis in English setter dogs. Anim. Genet.29:371–376.
Maniatis, T., E. F. Fritschand J. Sambrook, 1982 Molecular
Marchini, J. L., 2004 popgen: Statistical and Population Genetics.
R package version 0.0–4. http://www.stats.ox.ac.uk/marchini/ software.html.
Michell, A. R., 1999 Longevity of British breeds of dog and its
re-lationships with sex, size, cardiovascular variables and disease. Vet. Rec.145:625–629.
Mignot, E., C. Wang, C. Rattazzi, C. Gaiser, M. Lovett et al.,
1991 Genetic linkage of autosomal recessive canine narcolepsy with a mu immunoglobulin heavy-chain switch-like segment. Proc. Natl. Acad. Sci. USA88:3475–3478.
Nicholson, G., A. V. Smith, F. Jo´ nsson, O´ . Gu´ stafsson, K.
Stefa´ nsson et al., 2002 Assessing population differentiation
and isolation from single-nucleotide polymorphism data. JRSS(B)
64:695–715.
Ostrander, E. A., and L. Kruglyak, 2000 Unleashing the canine
genome. Genome Res.10:1271–1274.
Palmer, J., 1994 The Illustrated Encyclopedia of Dog Breeds.Wellfleet
Press, Edison, NJ.
Park, Y. G., R. Clifford, K. H. Buetow and K. W. Hunter,
2003 Multiple cross and inbred strain haplotype mapping of complex-trait candidate genes. Genome Res.13:118–121. Parker, H. G., and E. A. Ostrander, 2005 Canine genomics and
genetics: running with the pack. PLoS Genet.1:e58.
Parker, H. G., L. V. Kim, N. B. Sutter, S. Carlson, T. D. Lorentzen
et al., 2004 Genetic structure of the purebred domestic dog. Sci-ence304:1160–1164.
Parker, H. G., A. V. Kukekova, D. T. Akey, O. Goldstein, E. F.
Kirknesset al., 2007 Breed relationships facilitate fine-mapping
studies: a 7.8-kb deletion cosegregates with Collie eye anomaly across multiple dog breeds. Genome Res.17:1562–1571. Payseur, B. A., and M. Place, 2007 Prospects for association
map-ping in classical inbred mouse strains. Genetics175:1999–2008. Pennisi, E., 2000 Human genome: finally, the book of life and
in-structions for navigating it. Science288:2304–2307.
Pletcher, M. T., P. McClurg, S. Batalov, A. I. Su, S. W. Barneset al.,
2004 Use of a dense single nucleotide polymorphism map for in silico mapping in the mouse. PLoS Biol.2:e393
R DevelopmentCoreTeam, 2006 R: A language and environment for
statistical computing. R Foundation for Statistical Computing. Vienna. http://www.R-project.org.
SalmonHillbertz, N. H., M. Isaksson, E. K. Karlsson, E. Hellme´ n,
G. R. Pielberget al., 2007 Duplication of FGF3, FGF4, FGF19
and ORAOV1 causes hair ridge and predisposition to dermoid sinus in Ridgeback dogs. Nat Genet.39(11): 1318–1320. Sargan, D. R., D. Withers, L. Pettitt, M. Squire, D. J. Gouldet al.,
2007 Mapping the mutation causing lens luxation in several ter-rier breeds. J. Hered.98:534–538.
Sutter, N. B., M. A. Eberle, H. G. Parker, B. J. Pullar, E. F. Kirkness
et al., 2004 Extensive and breed-specific linkage disequilibrium inCanis familiaris.Genome Res.14:2388–2396.
Sutter, N. B., C. D. Bustamante, K. Chase, M. M. Gray, K. Zhao
et al., 2007 A single IGF1 allele is a major determinant of small size in dogs. Science316:112–115.
Todhunter, R. J., R. Mateescu, G. Lust, N. I. Burton-Wurster, N.
L. Dykeset al., 2005 Quantitative trait loci for hip dysplasia in a
cross-breed canine pedigree. Mamm. Genome16:720–730.
van deSluis, B. J., M. Breen, M. Nanji, M.vanWolferen, P.deJong
et al., 1999 Genetic mapping of the copper toxicosis locus in Bedlington terriers to dog chromosome 10, in a region syntenic to human chromosome region 2p13-p16. Hum. Mol. Genet.8:
501–507.
Wang, J., G. Liao, J. Usukaand G. Peltz, 2005 Computational
ge-netics: From mouse to human? Trends Genet.21:526–532. Wang, X., R. Korstanje, D. Higgins and B. Paigen, 2004
Hap-lotype analysis in multiple crosses to identify a QTL gene. Ge-nome Res.14:1767–1772.
Wilcox, B., and C. Walkowicz, 1995 The Atlas of Dog Breeds.T. F. H.
Publications, Neptune City, NJ.
Wuertz, D., 2006 fExtremes: Rmetrics: Extreme Financial Market
Data, R package version 240.10068. http://www.rmetrics.org.