Can digital technologies help
reduce the immigrant–native
educational achievement gap?
Rodrigues, Margarida
2018
This publication is a Science for Policy report by the Joint Research Centre (JRC), the European Commission’s science and knowledge service. It aims to provide evidence-based scientific support to the European
policymaking process. The scientific output expressed does not imply a policy position of the European Commission. Neither the European Commission nor any person acting on behalf of the Commission is responsible for the use that might be made of this publication.
Contact information
European Commission, Joint Research Centre
Address: Edificio Expo. c/Inca Garcilaso, 3. 41092 Seville (Spain) E-mail: [email protected] Tel.: +34 954488318 JRC Science Hub https://ec.europa.eu/jrc JRC109246 EUR 28889 EN
PDF ISBN 978-92-79-76842-2 ISSN 1831-9424 doi:10.2760/953261
Luxembourg: Publications Office of the European Union, 2018 © European Union, 2018
The reuse of the document is authorised, provided the source is acknowledged and the original meaning or message of the texts are not distorted. The European Commission shall not be held liable for any consequences stemming from the reuse.
How to cite this report: Rodrigues, Margarida; Can digital technologies help reduce the immigrant-native educational achievement gap?, EUR 28889 EN, Publications Office of the European Union, Luxembourg, 2018; ISBN 978-92-79-76842-2; doi:10.2760/953261; JRC109246
All images © European Union 2018 Title
Can digital technologies help reduce the immigrant–native educational achievement gap? Abstract
Results using the PISA 2015 data suggest that ICT-related policies have the potential to decrease immigrant– native achievement gap. In particular, policies targeting the use of ICT seem to be the most promising.
3 Table of Contents
Foreword... 5
Executive summary ... 6
1. Introduction ... 7
2. Data and sample ... 9
3. Immigrant population in PISA: achievement and socio-economic status ... 12
4. Immigrant students and digital technologies: descriptive statistics ... 15
4.1 Age at which students start to use digital technologies ... 15
4.2 Access to digital technologies at school and outside school ... 17
4.3 Use of digital technologies at school and outside school ... 18
4.4 Students’ self-reported ICT competence level ... 22
5. Immigrant–native achievement gap in PISA: the role of digital technologies ... 24
5.1 Explaining the achievement gap: traditional factors ... 25
5.2 Explaining the achievement gap: ICT-related variables ... 27
5.3 A more in-depth look at the several ICT-related variables ... 29
5.4 Use of digital technologies and students’ achievements ... 31
6. Conclusions ... 34
References ... 36
Annex A – Further tables ... 37
Annex B – Other issues ... 49
Annex C - Results for mathematical and reading literacy ... 52
Country codes and abbreviations ... 54
List of Tables ... 55
4
Note
This report is part of the FIT Administrative Agreement agreed between DG EDUCATION AND CULTURE (EAC) and DG JOINT RESEARCH CENTRE (JRC).
Acknowledgements
The author would like to thank JRC-B4 colleagues and DG EAC-A4 colleagues for their useful comments and suggestions for improving earlier versions of this report.
5
Foreword
Joint Research Centre (JRC) research on Learning and Skills for the Digital Era started in 2005. The aim was to provide evidence-based policy support to the European Commission in relation to harnessing the potential of digital technologies to encourage innovation in education and training practices; improve access to lifelong learning; and impart the new (digital) skills and competences needed for employment, personal development and social inclusion. More than 20 major studies have been undertaken on these issues resulting in more than 120 different publications.
Recent work on capacity building for the digital transformation of education and learning, and for the changing requirements for skills and competences, has focused on the development of digital competence frameworks for citizens (DigComp), educators
(DigCompEdu), educational organisations (DigCompOrg) and consumers
(DigCompConsumers). A framework for opening-up Higher Education Institutions (OpenEdu) was also published in 2016, along with a competence framework for entrepreneurship (EntreComp). Some of these frameworks are accompanied by (self-) assessment instruments. Additional research has been undertaken on Learning Analytics, massive open online courses (MOOCs) (MOOCKnowledge, MOOCs4inclusion), Computational thinking (Computhink) and policies for the integration and innovative use of digital technologies in education (DigEduPol).
This report was produced on behalf of the Directorate-General for Education and Culture (DG EAC) and addresses the question “Can digital technologies help reduce the immigrant–native educational achievement gap?”. Using Programme for International Student Assessment (PISA) 2015 data, the findings outlined in the report point to a positive answer. They show that information and communication technology (ICT)-related variables are associated with the achievement gap, thus supporting the idea that ICT-related policies have the potential to reduce this gap. In particular, policies targeting the use of ICT seem to be the most promising.
More information on all our studies can be found on the JRC Science Hub: https://ec.europa.eu/jrc/en/research-topic/learning-and-skills.
Yves Punie
Deputy Head of Unit
DG JRC Unit Human Capital and Employment European Commission
6
Executive summary
It is well established in the literature that students from immigrant backgrounds tend to perform worse in terms of several educational outcomes than their native counterparts, even after controlling for socio-economic factors. Digital technologies may help reduce these gaps by, for instance, facilitating the learning of the language of the host country and allowing access to educational material in native languages.
Using the recent Programme for International Student Assessment (PISA) 2015 data, the aim of this report is twofold. First, it describes the access to and use of digital technologies among 15-year-old students, comparing immigrant and native students. We show that immigrant students start using digital technologies later in life but, at 15 years old, use it more intensively than native students for almost all the types of use analysed. The perceived information and communication technology (ICT) competence level is, overall, similar for immigrant and native students and, when different, is generally higher for immigrants.
Second, the report explores the drivers of the immigrant–native science achievement gap in PISA, paying special attention to ICT-related variables. Our findings indicate that current differences in these variables are associated with the achievement gap and support the idea that ICT-related policies have the potential to decrease the immigrant– native achievement gap. The evidence suggests that, at school, the intensity of ICT use by immigrant students should be lessened. In contrast, outside school, immigrant students would benefit from more intense use of ICT for schoolwork and general purposes.
Despite these overall conclusions, our analysis also unveils the need for country- and context-specific policies. The extensive analysis presented in this report with regard to countries and immigrant generations should therefore be taken into account to guide policy actions.
7
1. Introduction
Immigrants tend to achieve less in terms of their educational and labour market performance than the native population (OECD, 2015). In a thorough analysis of the educational outcomes of an immigrant population, Flisi et al. (2016) concluded that, in general, immigrant students tend to perform worse than their native counterparts in terms of acquired skills and completed educational levels and that these gaps remain in the adult phase. This situation is confirmed by the recently released Programme for International Student Assessment (PISA) 2015 data (see Section 3). Given that these inequalities emerge early in immigrants’ lives, the time spent in the school system is crucial to closing up immigrant–native educational gaps and ensuring the socio-economic integration of immigrants (De Paola and Brunello, 2016).
In recent years, several stakeholders have argued that the use of digital technologies in learning can make an effective contribution to the inclusion of immigrants and refugees in the receiving country (Lupiañez et al., 2015; Colucci et al., 2017). In fact, digital technologies may open up new learning opportunities, facilitate and personalise education, and supply more engaging learning materials better targeted to immigrants’ needs, potentially increasing motivation and educational achievement (Kozma and Wagner, 2006; Redecker et al., 2010). For immigrants, digital technologies may facilitate the learning of the language of the host country and open up the possibility of accessing and exploring learning materials in their own languages (European Commission, 2016).
The empirical evidence on whether or not digital technologies improve immigrants’ educational outcomes is extremely scarce. An example of such evidence was provided by Verhallen and Bus (2010): in a randomised experiment with 92 five-year-old children from immigrant and low-income backgrounds in the Netherlands, these authors showed that the use of digital books significantly improved the children’s vocabulary in the language of the host country. In a more recent study, Rodrigues and Biagi (2017) reviewed the empirical literature on the effect of digital technologies on the educational achievement of students from low socio-economic backgrounds and provided an empirical analysis of PISA 2015 data. The authors found that the use of digital technologies has some potential to help disadvantaged students break the cycle of social exclusion, but that it depends on how intensely the technologies are used and for what purposes. However, immigrant students face cumulative disadvantages that go beyond low socio-economic status (SES), such as language barriers and other integration issues. This report analyses the use of digital technologies by immigrant students and examines whether or not digital technologies play a role in the existing immigrant–native educational achievement gap and whether or not these technologies could contribute to its reduction. PISA 2015 data were used for this purpose.
The report is organised as follows. Section 2 presents the PISA data, the definition of the PISA immigration statuses and the working sample. Section 3 characterises the immigrant population in PISA in terms of achievement in the science test and in terms of SES, having native students as the reference category. Section 4 presents descriptive statistics on several questions related to digital technologies, comparing immigrant and native students in each of the countries analysed. In Section 5, we explore the drivers of the immigrant–native achievement gap in PISA. In particular, after exploring traditional factors, such as socio-economic background, language barriers and school characteristics, we examine the role of information and communication technology
(ICT)-8 related variables. Then, we identify the countries for which differences in ICT-related variables explain a relatively high proportion of the remaining achievement gap, that is, after traditional factors have been accounted for. Section 5 ends with a multivariate analysis, conducted in order to understand how the use of digital technologies is associated with students’ achievements and to determine whether or not this association differs between immigrant and native students. In Section 6, we offer our conclusions.
9
2. Data and sample
This report uses data from PISA 2015. PISA is a large-scale international assessment that has taken place every three years since 2000 and that aims to assess 15-year-old students’ performance mainly in the domains of reading, mathematics and science. PISA 2015 focused on science as the major domain and defines science literacy as “the ability to engage with science related issues, and with the ideas of science, as a reflective citizen. A scientifically literate person is willing to engage in reasoned discourse about science and technology. This requires the competencies to explain phenomena scientifically, to evaluate and design scientific enquiry, and to interpret data and evidence scientifically” (OECD 2016, p. 50).
In addition to gathering data on student achievement, PISA collects extensive information on students’ and schools’ characteristics. Starting from the first wave, an optional separate questionnaire on students’ familiarity with digital devices has been given to participating countries – the “ICT Familiarity Questionnaire”. Therein, students are asked about their access to digital technologies at home and at school, if and with what intensity they use them and for what activities. In the PISA 2015 wave, most of the European Union (EU) Member States administered the ICT Familiarity Questionnaire. Only Cyprus, Malta, Romania and part of the United Kingdom, namely Scotland1, did not and therefore data from these countries are not included in the report.
In PISA, the different immigration statuses are defined as follows:
Native students are those who have at least one parent born in the country of assessment.
Second-generation immigrant students are those born in the country of assessment but whose parents were born in another country.
First-generation immigrant students are those students born outside the country of assessment and whose parents were also born in another country.
For a thorough description of the immigrants’ profiles and performances in PISA 2015, see Hippe and Jakubowski (forthcoming) and OECD (2016, Chapter 7).
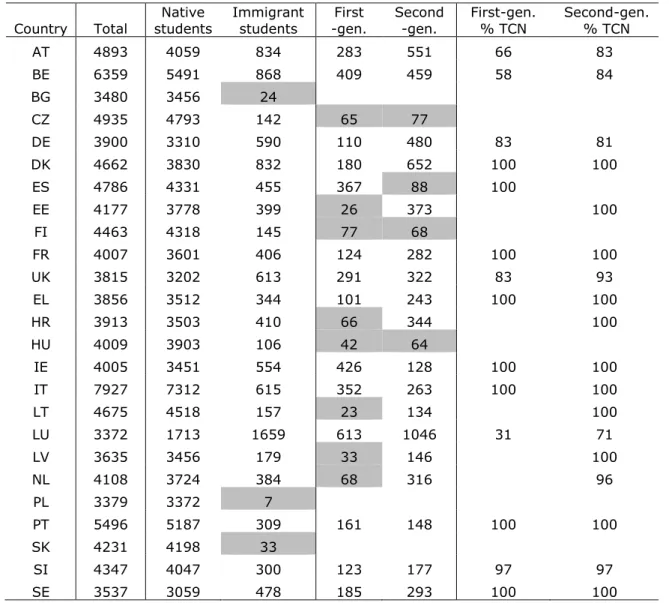
Table 1 shows the sample size for the different immigration statuses by country, for only the sample that has complete information on the ICT-related variables to be analysed (see below) – this is the working sample that will be used in the multivariate analyses. Clearly, in some of the countries the sample size of some immigrant generations is very limited, which raised doubts about the representativeness of the immigrant population in those countries. We followed the Organisation for Economic Co-operation and Development (OECD) recommendation and only considered an immigration group if it was constituted of at least 100 individuals (OECD, 2012, p. 81). This means that:
Data for Bulgaria, Poland and Slovakia were not analysed.
For the Czech Republic, Finland and Hungary, we only report statistics for immigrant students, without distinguishing between first- and second-generation immigrants.
For Spain, we considered only the first-generation immigrants.
Only the second-generation immigrants were analysed for Estonia, Croatia, Lithuania, Latvia and the Netherlands.
1 Hence, the results presented in this report for the United Kingdom refer to only England, Northern Ireland
10 For the remaining 13 countries, both immigrant generations were analysed (Austria, Belgium, Germany2, Denmark, France, the United Kingdom, Greece, Ireland, Italy, Luxembourg, Portugal, Slovenia and Sweden).
Table 1 – Sample size by country and immigration status
Country Total Native students Immigrant students First -gen. Second -gen. First-gen. % TCN Second-gen. % TCN AT 4893 4059 834 283 551 66 83 BE 6359 5491 868 409 459 58 84 BG 3480 3456 24 CZ 4935 4793 142 65 77 DE 3900 3310 590 110 480 83 81 DK 4662 3830 832 180 652 100 100 ES 4786 4331 455 367 88 100 EE 4177 3778 399 26 373 100 FI 4463 4318 145 77 68 FR 4007 3601 406 124 282 100 100 UK 3815 3202 613 291 322 83 93 EL 3856 3512 344 101 243 100 100 HR 3913 3503 410 66 344 100 HU 4009 3903 106 42 64 IE 4005 3451 554 426 128 100 100 IT 7927 7312 615 352 263 100 100 LT 4675 4518 157 23 134 100 LU 3372 1713 1659 613 1046 31 71 LV 3635 3456 179 33 146 100 NL 4108 3724 384 68 316 96 PL 3379 3372 7 PT 5496 5187 309 161 148 100 100 SK 4231 4198 33 SI 4347 4047 300 123 177 97 97 SE 3537 3059 478 185 293 100 100
Source: Own computation based on PISA 2015 data.
Table 1 shows that a large majority of the immigrant population in our sample is from non-EU Member States, i.e. third-country nationals (TCNs)3. In fact, in many of the host countries TCNs account for more than 95% of the immigrant sample. Only in Austria, Belgium, Germany and Luxembourg is the proportion of immigrants from within the EU noteworthy. Therefore, the results from this report refer mainly to TCN students.
2 Information on migration background is missing for a substantial proportion of the German sample, so the results for Germany should be interpreted with caution (OECD, 2016).
3 First-generation TCN students are those that were born in a non-EU Member State and whose parents were
born in a non-EU Member State. Second-generation TCN students are those that were born in the country of assessment but whose parents were born in a non-EU Member State.
11 For the descriptive statistics in Sections 3 and 4, we present data for all countries (except Bulgaria, Poland and Slovakia) and use the maximum number of observations for each of the relevant variables to give the most complete picture possible of the ICT-related variables across EU Member States. However, the econometric analyses in Section 5 focus on the 13 EU countries with a large enough sample of first- and second-generation immigrants. In addition, therein, we limit the analysis to the observations that do not have any missing information for the variables used4.
4 This implies a decrease of around 50,000 observations, of which 84% relate to native students and 9% and
7% relate to second- and first-generation immigrant students, respectively. We notice that immigrant students, especially first-generation ones, are more likely to have missing data on the ICT-related items. In particular, the results for first-generation immigrants in Denmark, France and Sweden should be interpreted with caution given that almost half of that cohort has missing values for the ICT-related variables and therefore may not be representative of the entire populations of first-generation immigrants in those countries.
12
3. Immigrant population in PISA: achievement and
socio-economic status
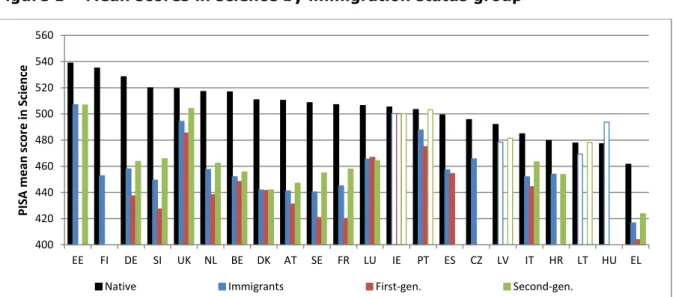
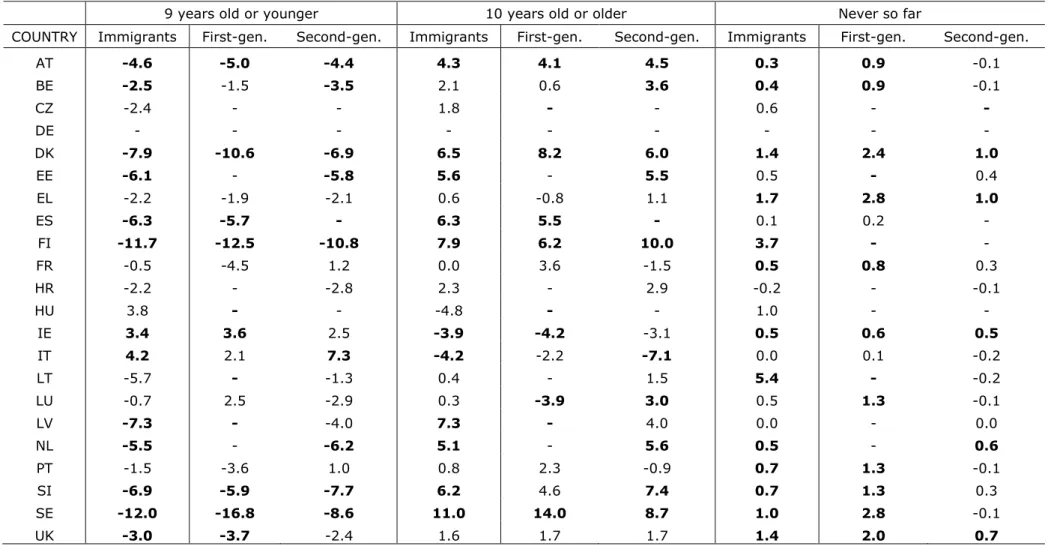
In almost all countries, the science skills of immigrant students lag substantially behind those of native students (Figure 1). With the exception of Ireland, Latvia, Lithuania and Hungary, this immigrant–native achievement gap is statistically significant. In fact, Ireland is the only country where the achievement gap is not statistically different between either of the immigrant generations and native students. In Portugal, Latvia and Lithuania, the gap is not statistically significant for second-generation immigrants.
The gap, with respect to native students, tends to be larger for first-generation than for second-generation immigrants. The difference in mean scores between first-generation immigrants and native students is particularly striking for France, Sweden, Slovenia and Germany, reaching 90 PISA points. Despite the smaller gap for second-generation immigrant students, for some countries it still amounts to more than 60 PISA points, namely Austria, Belgium, Denmark and Germany.
Figure 1 – Mean scores in science by immigration status group
Source: Own computations based on PISA 2015 data.
Note: The figure shows the average science score for each immigration status group. Countries are presented in descending order of native students’ mean scores. Unfilled bars indicate that the difference, with respect to natives’ mean score, is not statistically significant at the 5% significance level. See Table A.1 in Annex A for the full set of results.
It is important to acknowledge that the immigrant population is heterogeneous across and within countries (OECD/European Union, 2015) and that the immigrant–native achievement gap could be partly explained by differences in SES (Flisi et al., 2016). For instance, while some countries are long-standing destinations for immigrants with many recent and highly educated immigrants (Luxembourg and the United Kingdom) or immigrants educated to only a low level (Austria, France, Germany and the Netherlands), others are new destination countries with many recent immigrants educated to a low level (Greece, Italy, Spain and Portugal). Others have recently received a significant number of humanitarian immigrants (Denmark, Finland and Sweden) (OECD/European Union, 2015).
400 420 440 460 480 500 520 540 560 EE FI DE SI UK NL BE DK AT SE FR LU IE PT ES CZ LV IT HR LT HU EL PIS A me an sc o re in S ci e n ce
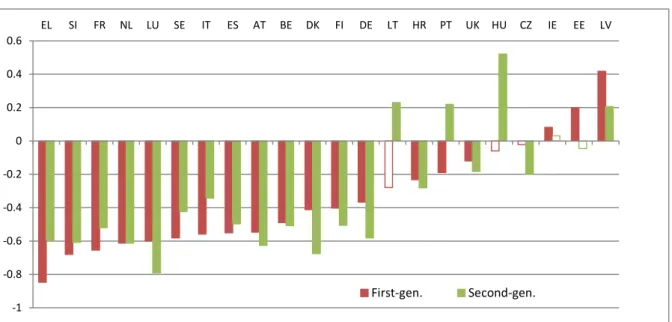
13 Figure 2 shows the difference between the socio-economic indices5 of immigrant and native students by country, revealing that, in general, immigrant students come from lower socio-economic backgrounds. However, there are some exceptions and the position of first- and second-generation immigrants varies across countries. Both generations of immigrant students in Latvia have a significantly higher SES than native students. In Ireland and Estonia, this is the case for first-generation immigrant students only, while in Lithuania, Portugal and Hungary the SES of second-generation immigrants is higher than that of native students. In the remaining countries, immigrant students do come, on average, from lower socio-economic backgrounds. In some of these countries, first-generation immigrants are the most disadvantaged group of students, namely in Greece, Slovenia, France, Sweden, Italy and Spain. In other countries, it is the second-generation immigrant student population that comes, on average, from a lower socio-economic background, namely in Luxembourg, Denmark, Finland, Austria, Germany and the United Kingdom.
Figure 2 – Differences between the socio-economic indices of immigrant and native students
Source: Own computations based on PISA 2015 data.
Note: The figure shows the difference between the migrant and native students’ PISA index of Economic, Social and Cultural Status (ESCS) averages. A negative difference indicates that immigrant students have, on average, a lower SES than native students, and vice versa. Countries are presented in ascending order of the difference for first-generation immigrants. Unfilled bars indicate that the difference is not statistically significant at the 10% significance level. See Table A.2 in Annex A for the full set of results.
It is clear that there are cross-country differences in the composition of the (first- and second-generation) immigrant population with respect to SES. In addition, there are certainly other differences that are not taken into account, such as cultural ones. Indeed, the OECD (2016) considers that “several push factors affect the selectivity of host countries such as colonial, linguistic or cultural links, proximity to the country of origin”, etc.
5 To measure socio-economic status, we rely on the index provided by PISA, i.e. the index of economic, social
and cultural status (ESCS). This index summarises information on home possessions (family wealth, cultural and educational resources) and parental education and occupational statuses.
-1 -0.8 -0.6 -0.4 -0.2 0 0.2 0.4 0.6 EL SI FR NL LU SE IT ES AT BE DK FI DE LT HR PT UK HU CZ IE EE LV First-gen. Second-gen.
14 For these reasons, we avoided carrying out pooled analyses for this report. Rather, we consistently report descriptive statistics and results from multivariate analyses separately for each country and immigrant generation. Furthermore, all the descriptive statistics presented below control for SES, which implies that the remaining differences between groups with different immigration statuses are not attributed to differences in this factor.
15
4. Immigrant students and digital technologies: descriptive
statistics
This section presents descriptive statistics on several questions related to digital technologies. In particular, we consider the age at which students start to use digital technologies, the access to digital devices at the time of the survey (age 15) both at home and at school, the different activities for which students use digital devices and the students’ perceived ICT competence. For each of these topics, we start by providing a definition of the variables used, followed by descriptive statistics for the differences between immigrant and native students.
In addition, we also inspect whether or not there are differences with respect to age at arrival in the host country. This is an important aspect because migrating earlier in life may aid integration into the host country’s society and education system, possibly decreasing the likelihood of disadvantages for immigrants (see, for example, Lemmermann and Riphahn, 2017). For this purpose, we separate first-generation immigrants into three groups – arriving at age 5 or before; arriving between age 6 and 9; arriving at age 10 or after – in the countries where there is a sufficient number of observations in each group, namely Austria, Belgium, Spain, the United Kingdom, Ireland, Italy and Luxembourg. Among these countries, on average, 37% of first-generation immigrant students arrived at 5 years old or younger, 28% arrived between 6 and 9 years old and the remaining 35% arrived at 10 years of age or older.
4.1 Age at which students start to use digital technologies
One of the items in the ICT Familiarity Questionnaire asks students how old they were when they first used a digital device, such as “desktop computers, portable laptops, notebooks, smartphones, tablet computers, cell phones without internet access, game consoles, or internet-connect television”.
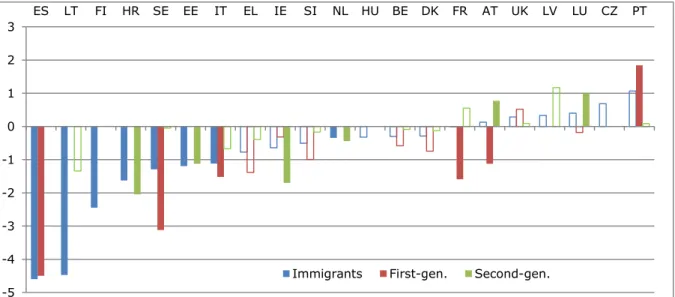
Figure 3 shows the difference between the proportions of immigrant and native students that report having used digital devices for the first time before the age of 10, after controlling for SES. This difference is not significant in the Czech Republic, Greece, Croatia, Portugal, Luxembourg, France or Lithuania. In the cases where the difference is significant, the overall pattern is that a larger proportion of immigrant students than of native students starts using digital devices after the age of 10. This difference is particularly relevant in Finland and Sweden, where the difference is higher than 10 percentage points (p.p.). In Sweden, this difference is mainly driven by first-generation immigrants, with the difference for this group amounting to more than 15 p.p. In Denmark, the difference for first-generation immigrants is also higher than 10 p.p. In fact, in Sweden and Denmark, only 68% and 80% of first-generation immigrants report using digital devices before the age of 10, compared with 87% and 91% of native students, respectively. For second-generation immigrants, the difference is smaller in magnitude, but still significant and higher than 5 p.p. in Sweden, Denmark, Slovenia, the Netherlands and Estonia.
The proportion of immigrant students reporting to have started using digital devices earlier in life is higher than that of native students in only very few cases. This positive difference is statistically significant for first-generation immigrants in Ireland and for second-generation immigrants in Italy.
16 Figure 3 – Differences between the share of immigrant and native students reporting to have started using digital devices before the age of 10, after controlling for socio-economic status
Source: Own computations based on PISA 2015 data.
Note: A negative difference indicates that a lower share of immigrant students has, on average, reported to have started using digital devices before the age of 10. Unfilled bars indicate that the difference is not statistically significant at the 10% significance level. Countries are presented in ascending order of the difference for immigrants as a whole (or for first-generation immigrants in the second graph). In Germany, students did not answer this question and therefore these data are not included in the graph. See Table A.3 in Annex A for the full set of results. Results by age at arrival are available from the author upon request.
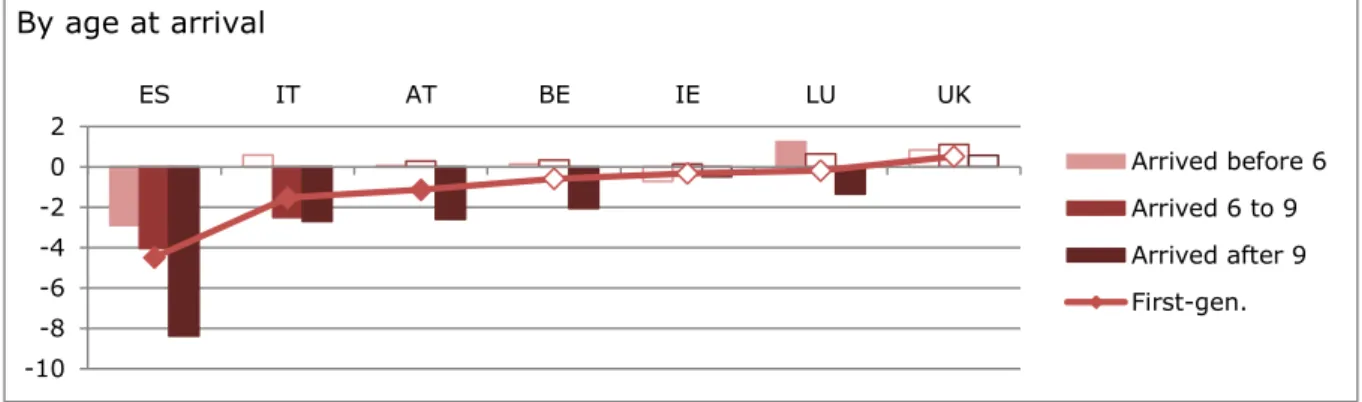
In most cases, the comparison between native and first-generation immigrant students by age at arrival does not reveal a uniform pattern. In Spain and the United Kingdom, the negative difference is accounted for mainly by immigrants that arrived in the host country later in life. However, in Luxembourg, a higher share of immigrants that arrived after the age of 9 reported to have started using digital devices earlier in life than their native counterparts. -20 -15 -10 -5 0 5 10 SE FI DK LV SI ES EE LT NL AT UK BE CZ EL HR PT LU FR IE HU IT
Immigrants First-gen. Second-gen.
-20 -15 -10 -5 0 5 10 ES AT UK BE IT LU IE By age at arrival Arrived before 6 Arrived 6 to 9 Arrived after 9 First-gen.
17
4.2 Access to digital technologies at school and outside school
In the ICT Familiarity Questionnaire, students are asked whether or not they have access to an array of digital devices for use at home and at school. In this report, the following definitions of access to digital devices are used:
Access at home: access to an internet connection and one computer, or cell phone, or tablet or ebook reader.
Access at school: access to computer, laptop or tablet and an internet connection6.
Access to ICT at school is widespread across countries and within countries, and across all groups of students: at least 98% of students, regardless of their immigration status, have access to ICT at school.
Therefore, the only difference worth exploring is the difference in access to ICT at home, which is shown in Figure 4. The general pattern points to slightly more access for native students. However, the differences are small and, in the majority of countries, are lower than 2 p.p., with the exception of immigrant students in Lithuania and Finland and first-generation immigrant students in Spain and Sweden, with gaps of 4.5 and 3 p.p., respectively.
Figure 4 – Differences between the share of immigrant and native students reporting to have access to digital devices at home, after controlling for socio-economic status
6 We found substantial variation in the answers of students from the same schools and therefore used the
mode answer within each school. -5 -4 -3 -2 -1 0 1 2 3 ES LT FI HR SE EE IT EL IE SI NL HU BE DK FR AT UK LV LU CZ PT
18 Source: Own computations based on PISA 2015 data.
Note: A negative difference means that a lower share of immigrant students has, on average, reported to have access to digital devices. Unfilled bars indicate that the difference is not statistically significant at the 10% significance level. Countries are presented in ascending order of the difference for immigrants as a whole (or for first-generation immigrants in the second graph). In Germany, students did not answer this question and therefore these data are not included in the graph. See Table A.4 in Annex A for the full set of results, including those on access to ICT at school. Results by age at arrival are available upon request.
In terms of access to ICT at home, it is clear that the differences between immigrant and native students are larger the later the immigrants arrived in the host country. However, again, the differences are not very large, with the notable exception of immigrants arriving after the age of 9 in Spain.
4.3 Use of digital technologies at school and outside school
In the ICT Familiarity Questionnaire, students are asked how often they use digital devices for several activities outside school (not necessarily at home) and at school7. Many of the activities refer to similar types of uses of ICT and therefore are grouped together into the following broad uses8:
H_schoolwork: use of ICT outside school to do schoolwork;
H_Communication: use of ICT outside school to communicate with colleagues and/or teachers about schoolwork;
H_General: use of ICT outside school for general purposes (gaming, information, entertainment, social purposes);
S_Education: use of ICT at school for educational purposes;
S_General: use of ICT at school for general purposes (chatting online and using email).
Figure 5 shows the differences between the share of immigrant and native students that report using ICT for each of the different purposes at least once per week, after controlling for SES. The general picture for ICT use shows that a larger share of immigrant students than native students uses ICT intensively for educational purposes,
7 It should be highlighted that the items referring to the use of ICT at school are very general. In particular, it
is unclear whether students are using ICT in the classroom during lessons or outside the classroom for individual purposes. The precise question is: “How often do you use digital devices for the following activities at school?” Most of the items refer to activities outside the classroom (downloading, doing homework, posting work). Other activities may take place in the classroom, but the items do not refer to that explicitly (practising and drilling, playing simulations, browsing the internet for schoolwork). Hence, the reader should not interpret the results on S_education as indicating the effect of ICT at school in general.
8 See Annex B for the list of items that are included in each of these types of ICT use. See also Rodrigues and
Biagi (2017) for further discussion on this issue. -10 -8 -6 -4 -2 0 2 ES IT AT BE IE LU UK By age at arrival Arrived before 6 Arrived 6 to 9 Arrived after 9 First-gen.
19 both outside and at school. Conversely, a lower share of immigrant students uses ICT intensively for general purposes outside school. However, there is some heterogeneity across countries and immigrant generations.
In Austria, France and Sweden, a larger share of immigrant students (both first- and second-generation immigrants) than native students report using ICT intensively outside school for schoolwork and for communication. In Italy and Ireland, this is the case for only first-generation immigrants, while in Germany this is the case for only second-generation immigrants. First-second-generation immigrant students in Portugal are the only ones that reported using ICT less often for schoolwork than native students. In Denmark, Belgium and Slovenia, the difference in ICT use for schoolwork is not statistically different across the three groups of students.
In contrast, the use of ICT outside school for general purposes is similar for native and immigrant students in most of the countries. In cases where the differences are significant, the proportion of native students that reported using ICT outside school is higher than that of immigrant students. With the exception of Estonia, the use of ICT outside school for general purposes is not statistically different between second-generation immigrants and native students. In contrast, in Germany, Slovenia, Denmark, Sweden, Belgium, Spain and Austria, first-generation immigrants reported using ICT less often than native students for this purpose. However, the magnitude of these differences is not as pronounced as it is for the use of ICT outside school for educational purposes.
At school, ICT is used for educational purposes more intensively by both immigrant generations in Ireland and Luxembourg. In Sweden, France and Germany, and especially in Greece and Slovenia, the difference is only significant for first-generation immigrants. In Austria and Estonia, the difference is significant for only second-generation immigrants. Only in the United Kingdom, Portugal and the Netherlands did immigrants report using ICT at school for educational purposes less often than native students. Finally, we notice that, in general, the differences in the use of ICT are more marked for immigrants arriving later in life in the host country9. For instance, first-generation immigrants arriving in the host country after the age of 9 tend to use ICT more often to communicate about schoolwork and at school for educational purposes, but also tend to use ICT less often at home for general purposes, than native students. However, there is some heterogeneity across countries.
20 Figure 5 – Differences between the share of immigrant and native students reporting the use of digital devices for each purpose at least once per week, after controlling for socio-economic status
-5 0 5 10 15 20 PT HR DK NL BE UK IT SI ES LV HU EL LT AT DE EE LU SE CZ IE FR FI
H_schoolwork:
outside school for schoolwork
Immigrants First-gen. Second-gen. -5 0 5 10 15 20 PT CZ HU HR ES EE LU BE EL LV SI DE IT DK LT NL IE UK FR AT FI SE
H_communication:
outside school for communication about schoolwork
-6 -4 -2 0 2 CZ ES FI DE EE DK BE FR HR NL SE LV SI LU AT LT EL UK IE PT HU IT
21 Source: Own computations based on PISA 2015 data.
Note: A negative difference indicates that a lower share of immigrant students reported using digital devices. Unfilled bars indicate that the difference is not statistically significant at the 10% significance level. Countries are presented in ascending order of the difference for immigrants as a whole. See Table A.5 in Annex A for the full set of results and Annex B for the graphs by age at arrival in the host country.
-15 -10 -5 0 5 10 15 20 NL PT BE DK UK HR ES SE HU IT FR DE LV AT IE LT EL EE LU CZ SI FI
S_education:
at school for educational purposes
Immigrants First-gen. Second-gen. -10 -5 0 5 10 15 LV IT FI HU BE NL PT UK FR DE DK CZ IE SI LU ES HR EE AT SE EL LT
22
4.4 Students’ self-reported ICT competence level
In the ICT Familiarity Questionnaire, students are asked a few questions related to their level of competence in using ICT. The OECD provides an index – the variable COMPICT – that results from combining all of these items and aims to measure students’ perceived ICT competence10.
Figure 6 reveals that, in some countries, the perceived ICT competence of immigrant students from both generations is statistically similar to that of native students, namely in Portugal, France, Austria, Denmark, Germany, Slovenia and Greece. In Hungary, the Netherlands, Latvia, Lithuania, Estonia and Croatia, this is also the case for the generation of immigrant students for which data are available.
Belgium is the only country where the perceived ICT competence of both immigrant generations is higher than that of native students. In Sweden and Ireland, this is also the case, but for only second-generation immigrants, while in Italy it is the case for only first-generation immigrants. Finally, in the United Kingdom and Spain the perceived ICT competence of first-generation immigrant students is significantly lower than native students.
The comparison between first-generation immigrants that arrived in the host country at different points in their lives and native students reveals some heterogeneity. For instance, in Belgium, first-generation immigrant students reported higher competence levels than native students, regardless of their age at arrival. In contrast, in the United Kingdom and Spain, immigrant students tend to report lower ICT competence levels and the difference is mainly accounted for by those arriving later in life. Ireland is the only country with considerable differences across the groups of first-generation immigrants: compared with native students, the perceived ICT competence level is similar for immigrants arriving at age 5 or younger; higher for those arriving between the ages of 6 and 9; and lower for those arriving at age 10 or above.
10 The five items are the following: (i) "I feel comfortable using digital devices that I am less familiar with"; (ii)
"If my friends and relatives want to buy new digital devices or applications, I can give them advice"; (iii) "I feel comfortable using my digital devices at home"; (iv) "When I come across problems with digital devices, I think I can solve them"; and (v) "If my friends and relatives have a problem with digital devices, I can help them".
23 Figure 6 – Differences between perceived ICT competence levels of immigrant and native students, after controlling for socio-economic status
Source: Own computations based on PISA 2015 data.
Note: The perceived ICT competence level has a within-country average of 0 and standard deviation of 1. A negative difference indicates that immigrant students reported a lower level of ICT competence. Unfilled bars indicate that the difference is not statistically significant at the 10% significance level. Countries are presented in ascending order of the difference for immigrants as a whole (and for first-generation immigrants in the second graph). See Table A.6 in Annex A for the full set of results.
-0.15 -0.10 -0.05 0.00 0.05 0.10 0.15 0.20 0.25 ES PT HU UK NL FR LV LT AT EE IT DK DE SI EL SE IE HR LU BE CZ FI Immigrants First-gen. Second-gen.
-0.30 -0.20 -0.10 0.00 0.10 0.20 0.30 UK ES IE AT IT BE LU By age at arrival Arrived before 6 Arrived 6 to 9 Arrived after 9 First-gen.
24
5. Immigrant–native achievement gap in PISA: the role of
digital technologies
In Figure 1, the average achievement in science by immigration status for the entire PISA sample is shown. It demonstrates that, in general, there is a substantial achievement gap between immigrant and native students. This section aims to understand the factors that explain this gap. First, the variables that have already been extensively explored in the literature are examined, such as socio-economic background, language spoken at home and school-related factors11 (see, for example, Schepf, 2007; Schneeweis, 2011; Dustmann et al., 2012; Entorf, 2015). To the best of our knowledge, this report presents the first evidence in this regard based on the most recent PISA wave. Next, we move on to the central purpose of this study, i.e. to assess the extent to which ICT-related variables explain the achievement gap that remains after controlling for the factors just mentioned.
In this section, we include only the 13 countries for which the sample sizes for both first- and second-generation immigrants were sufficient to be included in the analyses12. Methodologically, for each country, a multivariate analysis was performed in which the dependent variable is the student science score in PISA and the independent variables are the immigrant indicators (𝐹𝑖𝑟𝑠𝑡 𝑔𝑒𝑛 and 𝑆𝑒𝑐𝑜𝑛𝑑 𝑔𝑒𝑛), and student age and gender (𝑋)13:
𝑃𝐼𝑆𝐴 𝑠𝑐𝑜𝑟𝑒𝑖𝑠= 𝛼 + 𝛽1𝐹𝑖𝑟𝑠𝑡 𝑔𝑒𝑛𝑖𝑠+ 𝛽2𝑆𝑒𝑐𝑜𝑛𝑑 𝑔𝑒𝑛𝑖𝑠+ 𝛾𝑋𝑖𝑠+𝜀𝑖𝑠
The estimated coefficients for the immigrant generations in this model (𝛽1 and 𝛽2) give the raw generation-specific immigrant–native achievement gap (this is Model 0). We then explore the drivers of the achievement gaps by adding sequentially other explanatory variables (𝑍):
𝑃𝐼𝑆𝐴 𝑠𝑐𝑜𝑟𝑒𝑖𝑠= 𝛼 + 𝛽1𝐹𝑖𝑟𝑠𝑡 𝑔𝑒𝑛𝑖𝑠+ 𝛽2𝑆𝑒𝑐𝑜𝑛𝑑 𝑔𝑒𝑛𝑖𝑠+ 𝛾𝑋𝑖𝑠+𝛾𝑍𝑖𝑠+ 𝜀𝑖𝑠
As we add covariates in vector 𝑍, the variation in the immigrant coefficients (𝛽1 and 𝛽2) will reveal whether or not the variable just added reduces or widens the achievement gap. For instance, if coefficients 𝛽1 and 𝛽2 do not change, we can deduce that the variable added is not associated with the immigrant–native achievement gap. However, if the immigrant coefficients do change, then we assume that part of the gap is associated with differences between immigrant and native students in that same variable. In order to clearly assess the contribution of the different factors considered in 𝑍, each of the factors is added sequentially to the model.
In particular, if the inclusion of one variable (e.g. SES) reduces the immigrant coefficients, then we can deduce that part of the gap is due to differences in that variable. In other words, if the SES was the same for immigrant and native students, then the achievement gap would be smaller in magnitude than it actually is. In turn, this means that the current differences in SES contribute to widening the achievement gap. Conversely, the inclusion of one variable (e.g. school-related factors) may increase the immigrant coefficients’ magnitude, i.e. they would become more negative. This indicates
11 We also examined the role of participation in early childhood education. However, this factor did not change
the main results for the ICT-related variables and therefore we did not include it in the analysis presented.
12 Austria, Belgium, Denmark, Germany, France, the United Kingdom, Greece, Ireland, Italy, Luxembourg,
Portugal, Slovenia and Sweden.
13 This model includes age and gender because these are clearly exogenous and hence not changeable by
policies. See Annex C for some of the results on mathematics and reading literacy. Despite slight differences for some countries and immigrant generations, the overall conclusions presented below hold for these domains.
25 that, had this variable been the same for both groups of students, the achievement gap would be larger than it actually is. In other words, the current differences between immigrant and native students in terms of that variable do in fact already contribute to closing up the achievement gap.
5.1 Explaining the achievement gap: traditional factors
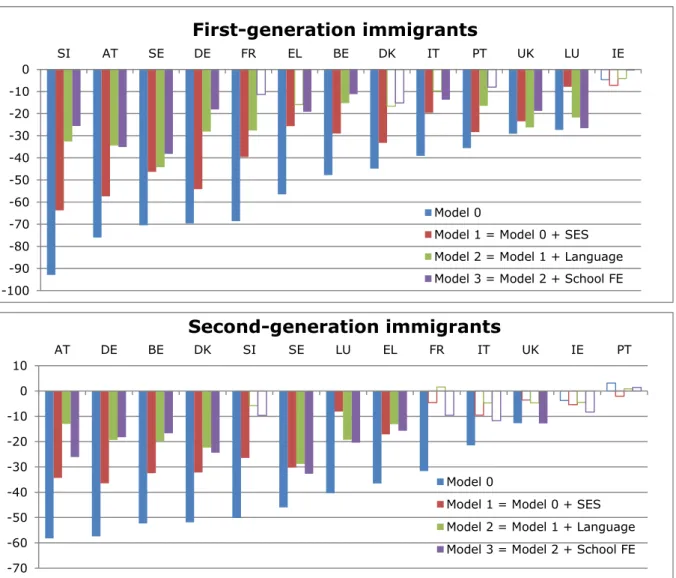
Figure 7 shows the evolution of the raw immigrant–native achievement gap (Model 0 – blue bar) as we add sequentially the traditional explanatory variables: SES (Model 1 – red bar), language spoken at home (Model 2 – green bar) and school-related factors (Model 3 – purple bar)14.
Figure 7 – Changes in the immigrant–native achievement gaps by controlling for traditional factors
Source: Own computations based on PISA 2015 data.
Note: Unfilled bars indicate that the difference is not statistically significant at the 10% significance level. Countries are presented in ascending order of the difference for the raw gap. See Table A.7 in Annex A for the full set of results.
14 Since it is possible that there are correlations between the variables added, the order in which we introduced
each may have affected the results. For instance, had we introduced the language spoken at home first and SES second would have produced slightly different results.
-100 -90 -80 -70 -60 -50 -40 -30 -20 -10 0 SI AT SE DE FR EL BE DK IT PT UK LU IE
First-generation immigrants
Model 0Model 1 = Model 0 + SES Model 2 = Model 1 + Language Model 3 = Model 2 + School FE
-70 -60 -50 -40 -30 -20 -10 0 10 AT DE BE DK SI SE LU EL FR IT UK IE PT
Second-generation immigrants
Model 0Model 1 = Model 0 + SES Model 2 = Model 1 + Language Model 3 = Model 2 + School FE
26 As far as the raw gap is concerned (Model 0), immigrant students – both first- and second-generation – have lower levels of science achievement in PISA than native children, with the notable exceptions of both immigrant generations in Ireland and second-generation immigrants in Portugal. In general, among immigrant students, the first-generation immigrants tend to perform worse than their second-generation counterparts. Only in Belgium, Denmark and Luxembourg are the immigrant–native gaps higher for second-generation immigrants than for first-generation immigrants.
The first-generation achievement gap ranges from 27 points in Luxembourg to more than 90 points in Sweden. Even though smaller than the first-generation gap in most countries, the second-generation gap is still far from negligible, ranging from 13 points in the United Kingdom to 60 points in Austria.
Which factors contribute to this achievement gap? Clearly, SES plays a crucial role in explaining the immigrant–native achievement gap. In fact, when we control for students’ socio-economic background (Model 1), the relative situation of both first- and second-generation immigrants improves in all countries. For first-second-generation immigrants, the gap decreases by at least 20% across all countries. This decrease is equivalent to more than 30 PISA points in Slovenia, France and Greece. In percentage terms, the decrease is particularly notable in Luxembourg – 70% (equivalent to 20 PISA points) – and in Italy and Greece – around 50%. For second-generation immigrants, the gap disappears (or becomes statistically insignificant) in France, Italy and the United Kingdom. This suggests that, in these countries, educational policies do not need to address the particular needs of second-generation immigrants directly, since the immigrant gap could be decreased by policies that provide additional support for all students with a disadvantaged background. For the remaining countries, controlling for SES significantly decreases the second-generation immigrant–native achievement gap, by at least 30%. However, it is clear that even after controlling for SES the gap remains statistically significant in the large majority of the countries. This suggests that educational policies specifically addressing immigrant students are needed to tackle their lower levels of achievement.
Another factor that could be relevant is the language spoken at home. Across the 13 countries, on average, 65% of first-generation immigrant students and 50% of second-generation immigrant students speak a language at home that is different from the language in which the PISA test was conducted, which may hinder their communication and performance at school.
To assess whether such a “language penalty” is associated with the lower levels of achievement among immigrant students, we add to the previous model a dummy variable that indicates whether or not students speak a different language at home from the one of the test (Model 2). The results are not as consistent across countries as those obtained when the SES variable was included. For instance, in Sweden the language penalty is not associated with the achievement gap, since the immigrant coefficients barely change. In the United Kingdom and, especially, in Luxembourg, controlling for languages increases the magnitude of the gap, suggesting that, in fact, in these countries, speaking a different language at home puts immigrants in a better position than their native counterparts. In contrast, as expected, the immigrant–native achievement gap is reduced in most of the countries when the language penalty variable is applied, especially in Austria, Belgium, Germany, Denmark, Slovenia and Italy. In fact,
27 in this model, the achievement gap is no longer significant for first-generation immigrants in Italy, Greece and Denmark or for second-generation immigrants in Slovenia; these results indicate that educational policies targeting immigrants’ language skills could be particularly effective in these countries.
Next, we consider school-related factors by adding to the model school fixed effects (FE) that effectively control for all the factors that are common to students attending the same school (Model 3). Our question here is the following: what would be the effect on the immigrant–native gap if immigrant and native students were to attend schools with exactly the same characteristics (same school SES, peer effects, immigrant segregation levels, school policies, teacher quality, etc.)? It is important to note that we are not identifying specific school factors; rather, we are interested in knowing whether or not schools are closing or widening the immigrant–native achievement gap that remains after controlling for SES and language spoken at home.
In France and Portugal, adding the school FE results in a non-significant difference in achievement between first-generation immigrants and native students. This indicates that differences in the characteristics of the schools attended by first-generation immigrants and natives are currently contributing to the observed achievement gap and that removing these differences would effectively eliminate the achievement gap. Conversely, the immigrant–native achievement gap increases (i.e. becomes more negative) in Greece, Italy and Luxembourg, suggesting that school characteristics in fact contribute to narrowing the gap in these countries. This is also the case for second-generation immigrants in Austria and Germany.
In the majority of the remaining countries, the gap is not significantly affected by controlling for the school FE. This may be due to several reasons: either school characteristics do not contribute in any way to the gap or different school characteristics have opposing effects, which, overall, result in a very small effect on the immigrant– native achievement gap. However, it was out of the scope of this study to analyse in depth which specific school characteristics contribute to widening or narrowing the achievement gap.
5.2 Explaining the achievement gap: ICT-related variables
After controlling for these three crucial factors (Model 3), it should be highlighted that the immigrant–native achievement gap is no longer significant for (i) first-generation immigrants in France, Denmark and Portugal; or (ii) second-generation immigrants in Italy, Slovenia, France, Ireland and Portugal. In the remaining cases, the gap cannot be completely explained by the factors explored so far. The achievement gap is still particularly large (close or larger than 20 PISA points) in Austria, Luxembourg and Sweden as well as for first-generation immigrants in Slovenia and second-generation immigrants in Denmark.
In this section, departing from the last gap obtained in the last section (Model 3) - i.e. after controlling for SES, language spoken at home and school-related factors - we explore the role played by ICT-related variables. Therefore, we further add to the model the following variables (Model 4): the age at which students first used digital devices; students’ access to ICT at home and at school; the intensity of ICT use in these different
28 locations and for different purposes15 (H_schoolwork, H_communication, H_general, S_education and S_general); and the students’ perceived ICT competence index.
Figure 8 shows how the achievement gap is affected by introducing these ICT-related variables for each of the immigrant generations.
Figure 8 – Changes in the remaining immigrant–native achievement gap when controlling for ICT-related factors
Source: Own computations based on PISA 2015 data.
Note: Unfilled bars indicate that the difference is not statistically significant at the 10% significance level. Countries are presented in ascending order of the difference in the gap after controlling for SES, language spoken at home and school-related factors (Model 3 – purple bars). See Table A.8 in Annex A for the full set of results.
15 For this purpose, indices for the intensity of ICT use for the different types of use are computed by summing
the students’ answers to questions related to each of the activities constituting the type and location of ICT use. Each of the variables is then standardised to a mean of 0 and a standard deviation of 1. See Annex B. -45 -40 -35 -30 -25 -20 -15 -10 -5 0 SE AT LU SI EL UK DE DK IT FR BE PT IE
First-generation immigrants
Model 3Model 4 = Model 3 + All ICT
-35 -30 -25 -20 -15 -10 -5 0 5 SE AT DK LU DE BE EL UK IT SI FR IE PT
Second-generation immigrants
Model 329 The inclusion of all the ICT-related factors reduces the gap in the majority of countries, suggesting that the current differences in these variables between immigrant and native students are associated with the achievement gap.
Adding all the ICT-related variables reduces the first-generation immigrant–native achievement gap in all the countries for which it was still significantly different from 0 after controlling for the other factors. In the United Kingdom and Belgium, this reduction is rather small. In contrast, the decrease is substantial in Luxembourg and Sweden (8 PISA points, corresponding to 29% and 20%, respectively) and in Germany and Greece (3 PISA points, equivalent to 17%). This result indicates that the differences in ICT-related variables between first-generation immigrant students and native students contribute to the achievement gap and that, if these factors were equalized, the achievement gap would be substantially smaller. Furthermore, the gaps are no longer significant in Greece and Italy after adding the ICT-related variables; however, they were also non-significant before introducing the school FE.
The second-generation immigrant–native gap is also reduced in the majority of the countries after the inclusion of the ICT-related variables. The exceptions are the United Kingdom and Italy, where the gap increases, suggesting that the current ICT use by immigrant students in these countries in fact contributes to reducing the achievement gap. The gaps decrease the least in Belgium and Germany and the most in Luxembourg, Denmark and Greece, with decreases of 5 PISA points, which correspond to decreases of 24%, 20% and 36%, respectively.
In conclusion, the results from this analysis reveal that the immigrant–native achievement gap is statistically significant and remains high in several countries even after controlling for all of the factors considered (including the ICT-related factors). This means that having access to and using digital technologies is not the only solution to eliminating the immigrant–native achievement gap; however, the results show that ICT-related variables partly explain the achievement gap.
Therefore, our results provide evidence that ICT-related policies could potentially decrease the immigrant–native achievement gap. In particular, the ICT-related variables seem to be particularly pertinent for specific combinations of countries and immigrant generations; these variables explain more than 15% of the achievement gap that remains after controlling for SES, language and school FE:
in Germany and Sweden, for first-generation immigrants; in Denmark, for second-generation immigrants;
in Luxembourg and Greece, for both first- and second-generation immigrants. However, we stress that these results cannot be directly interpreted as proof of a causal relationship, since the differences in the ICT-related variables could be capturing differences in other variables not accounted for (willingness to integrate, motivation to learn, etc.).
5.3 A more in-depth look at the several ICT-related variables
In this section, we look more in depth at the several ICT-related variables with the aim of identifying which of these variables explain the largest part of the immigrant–native achievement gap. We focus the analysis on the combinations of countries and immigrant
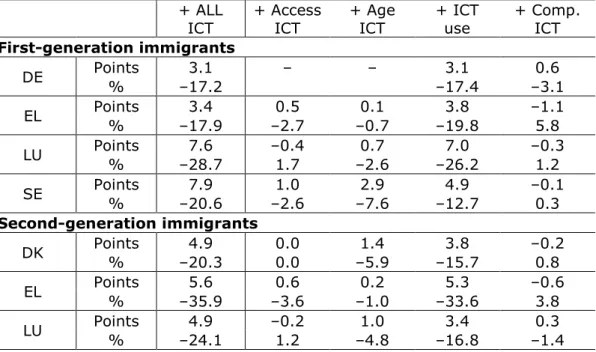
30 generations identified above for which the role of ICT-related variables was found to be most prominent (the results are available for all the 13 countries in Annex A, Table A.8). The first column of Table 2 shows the changes in achievement gaps in the selected countries, in both PISA points and percentage terms, after including all the ICT-related variables (this is the change visualised in Figure 8). The following columns show results if only one of each of the ICT-related variables is individually included in the model.
Table 2 – Immigrant–native achievement gaps: an in-depth look at the ICT-related variables for selected countries
+ ALL
ICT + Access ICT + Age ICT + ICT use + Comp. ICT First-generation immigrants DE Points 3.1 – – 3.1 0.6 % –17.2 –17.4 –3.1 EL Points 3.4 0.5 0.1 3.8 –1.1 % –17.9 –2.7 –0.7 –19.8 5.8 LU Points 7.6 –0.4 0.7 7.0 –0.3 % –28.7 1.7 –2.6 –26.2 1.2 SE Points 7.9 1.0 2.9 4.9 –0.1 % –20.6 –2.6 –7.6 –12.7 0.3 Second-generation immigrants DK Points 4.9 0.0 1.4 3.8 –0.2 % –20.3 0.0 –5.9 –15.7 0.8 EL Points 5.6 0.6 0.2 5.3 –0.6 % –35.9 –3.6 –1.0 –33.6 3.8 LU Points 4.9 –0.2 1.0 3.4 0.3 % –24.1 1.2 –4.8 –16.8 –1.4
Source: Own computations based on PISA 2015 data.
Note: The column + ALL ICT shows the changes in the immigrant–native achievement gaps once all ICT-related variables are controlled for, in the model already controlling for SES, language spoken at home and school FE. The remaining columns show the changes in the immigrant–native achievement gaps when only the specified ICT-related variable is controlled for (+ Access ICT – access to ICT at home and at school; + Age ICT – age at which student started to use digital devices; + ICT use – the several uses of ICT; or + Comp. ICT – the students’ perceived ICT competence level). See Table A.8 for the full set of results.
It is clear that across all countries most of the gap decreases generated by the ICT-related variables are driven by the ICT use variables. In Sweden (for first-generation immigrants) and in Denmark and Luxembourg (for second-generation immigrants), the age at which students start using digital technologies also plays a role, reducing the achievement gap by at least 5%. Considering the descriptive statistics presented in Section 4.1, it is apparent that in all these three countries immigrants start using digital devices later on in their lives than their native counterparts. Hence, the policy implication in such cases is straightforward: reducing the age at which immigrant children start using digital devices would be associated with a reduction of the immigrant–native achievement gap.
However, the policy implications on the types of ICT use are not as straightforward. First, there is not a single type of ICT use, but five of them. Second, the descriptive statistics show that, in general, immigrant students tend to use ICT more intensively than native students for some types of use, while for other ICT uses the opposite is true.
31 Third, the direction of the change with regard to type of ICT use depends on the returns associated with each of them (i.e. whether the type of ICT use is positive or negative for achievement) and whether the returns are uniform or different across immigration groups. Fourth, some of these patterns are not the same across all countries and immigrant generations.
Hence, delineating which types of ICT use should change, and in what direction, is crucial, in order to effectively diminish the achievement gap. For this purpose, we performed a multivariate analysis relating the several types of ICT use to student achievement, as presented in the following section.
5.4 Use of digital technologies and students’ achievements
In this subsection we present results from the following econometric specification: 𝑃𝐼𝑆𝐴 𝑠𝑐𝑜𝑟𝑒𝑖𝑠= 𝛼 + 𝜌𝐼𝑛𝑡𝑒𝑛𝑠𝑖𝑡𝑦 𝑜𝑓 𝐼𝐶𝑇 𝑢𝑠𝑒𝑠𝑖𝑠+ 𝛾𝑊𝑖𝑠+ 𝛿𝑠+ 𝜀𝑖𝑠
where 𝑃𝐼𝑆𝐴 𝑠𝑐𝑜𝑟𝑒 is the student’s achievement in the PISA science test, 𝑊 is a set of control variables (age, gender, immigration status, language spoken at home and socio-economic index) and 𝛿𝑠 represents school FE. 𝐼𝑛𝑡𝑒𝑛𝑠𝑖𝑡𝑦 𝑜𝑓 𝐼𝐶𝑇 𝑢𝑠𝑒𝑠 is the set of the main variables of interest, i.e. the indices that capture the intensity of ICT use for the different purposes at school or outside school16: H_schoolwork, H_communication, H_general, S_education and S_general.
Table 3 presents the results from this specification and the association (𝜌) between the intensity of ICT use and science achievement for each immigration status group (columns (1), (2) and (4)), and whether or not these associations are different across groups (columns (3) and (5)).
The main conclusions from Table 3 are as follows:
First, overall, there is a positive association between achievement and the intensity of ICT use outside school for schoolwork (H_schoolwork). However, in Germany, Denmark and Luxembourg, this association is stronger for first- than for second-generation immigrants, suggesting that this group, in particular, could benefit from a more intense use of ICT for this purpose.
Second, in general, the results indicate that all students in all countries may be overusing ICT for communication about schoolwork (H_communication), and in some countries this is even more the case for immigrant students (first-generation in Germany and Luxembourg, and second-(first-generation in Greece). Third, while the use of ICT outside school for general purposes (H_general) is not
associated with science achievement in Luxembourg or Germany, there is evidence that it is positively correlated with immigrants’ achievements in Denmark. This suggests that a higher intensity of this type of ICT use by immigrants would contribute to closing the achievement gap in this country. In Greece and Sweden, this is also the case, but for only second-generation immigrants.
Fourth, the use of ICT at school for educational purposes (S_education) is negatively associated with science achievement (except in Germany). The negative association is particularly strong for first-generation immigrants in
16 To directly compare changes in the distribution of usage intensity for the different types of uses, these
32 Denmark and for second-generation immigrants in Sweden. In Greece and Luxembourg, both immigrant generations would benefit from a less intense use of ICT at school for educational purposes.
Table 3 – Results from the multivariate analysis
Native First-generation Second-generation ICT uses ρ ρ Diff. from native ρ Diff. from native
(1) (2) (3) (4) (5) DE H_schoolwork 0.36 24.59** ** 1.83 H_commun. –12.78*** –28.39*** –4.75 * H_general 3.60* 11.64 –0.17 S_education –2.03 –1.82 –6.79Ϯ S_general –3.51** –13.20 1.11 DK H_schoolwork 11.52*** 37.58*** ** 10.82* H_commun. –24.03*** –17.34* –25.20*** H_general 7.12*** 25.76*** * 15.31*** Ϯ S_education 0.40 –29.04*** *** –1.02 S_general –11.02*** –9.83 –8.54* EL H_schoolwork 0.81 2.47 9.05 H_commun. –16.39*** –9.92 –23.48*** H_general 9.59*** 3.52 14.48*** S_education –9.00*** –27.01* –18.03*** S_general –8.56*** 6.49 –0.41 LU H_schoolwork 0.13 12.01** ** 0.25 H_commun. –11.58*** –18.57*** –6.93** H_general 2.24 1.67 0.31 S_education –11.01*** –16.02*** –11.18*** S_general –2.08 –5.58 –4.84 SE H_schoolwork 13.10*** 17.22 7.37 H_commun. –28.44*** –29.15*** –16.77* H_general 1.73 1.41 12.86** Ϯ S_education –5.29* –3.38 –18.75** Ϯ S_general –4.59** –0.38 –0.88
Source: Own computations based on PISA 2015 data.
Note: All coefficients (ρ) shown result from the same regression. Within-school estimates and controlling for individual characteristics. Columns (3) and (5) indicate whether or not the association coefficients for first-generation and second-generation immigrants are statistically different (Diff.) from those for native students (***p<0.001; **p<0.05; *p<0.1; Ϯ p<0.15). See Table A.9 in Annex A for the full set of results.
In summary, and also taking into account the results presented in Table A.8, Annex A, for all countries, our findings indicate that immigrants’ achievement levels could be improved by a more intense use of ICT at home for schoolwork and for general purposes. The evidence indicates that immigrant students may be overusing ICT at school for educational purposes, perhaps suggesting that, at school, immigrants may be in need of face-to-face support.
33 Finally, the cross-country differences should be highlighted and taken into account for specific policy recommendations.