A Speckle Tracking Echocardiographic Study for Correlation
Between Global Left Ventricular Strain and Severity of Aortic
Stenosis
1
Wael Ahmed Maklad*,
2Mahmoud Shawky Abd El Moneum
1,2Department of Cardiology, Faculty of Medicine, Banha University, Egypt
Global longitudinal strain (GLS) measured by Two-dimensional speckle tracking imaging (2D-STI) has been shown to be useful for assessing subtle changes in the left ventricular function with increasing severity of aortic stenosis (AS) in patients with preserved left ventricular ejection fraction (LVEF). To evaluate the relation between the severity of valve stenosis and GLS measured by 2D-STI in AS patients with normal LVEF. We studied 65 subjects (age, 53_75 years) with normal LVEF (≥50%) but without overt coronary artery disease. Patients were stratified into four groups (control, mild, moderate and severe AS), the clinical characteristics and echocardiographic findings were compared among the groups. Using dedicated software, we measured GLS in the apical four, two and three -chamber views. LVEF was not significantly different among the four groups. However, GLS showed significant differences among the four groups (controls;18.9±1.4, mild: 18.8±1.3, moderate: 15.35±1.6and severe: 12.42±1.4, ANOVA P = 0.001), GLS was significantly correlated with AVA, mean PG and LV mass index. Despite unchanged LVEF, GLS gradually decreased as severity of AS increases. GLS measured by 2D-STI is useful to assess subtle changes in LV function in AS patients.
Keywords: aortic stenosis, left ventricle, echocardiography, left ventricular function.
INTRODUCTION
Aortic Stenosis (AS) has become the most frequent valvular heart disease in the western world with an increasing prevalence in the elderly, while in older subjects it is a major cause of morbidity. (Carabello BA et al., 2009:956-66)
Several studies have demonstrated that the development and progression of AS is at least partially an active
atherosclerotic process including infiltration of
inflammatory cells, extracellular lipid depositions, and
active calcification. (Otto CM et al., 2014:744-756)
The most common clinical presentation in patients with a known diagnosis of AS who are followed prospectively is a gradual decrease in exercise tolerance, fatigue, or
an excessive rise in end-diastolic pressure leading to pulmonary congestion. Alternatively, exertional symptoms may be a result of the limited ability to increase cardiac output with exercise. More severe exertional dyspnea, with orthopnea, paroxysmal nocturnal dyspnea, and pulmonary edema reflects varying degrees of pulmonary venous hypertension. These are relatively late symptoms in patients with AS, and intervention now is typically undertaken before this disease stage. (Rosenhek R et al., 2009:127-154)
*Corresponding author: Dr. Wael Maklad, Department of Cardiology, Faculty of Medicine, Banha University, Egypt. Vol. 3(2), pp. 045-051, July, 2017. © www.premierpublishers.org, ISSN: 3102-9869
It is important to follow not only the progression of aortic valve obstruction, but also the progression of LV dysfunction by echocardiography in AS patients. Left ventricular ejection fraction (LVEF) is the most common measure of LV systolic function. However, it often remains normal even in symptomatic patients with severe AS. Thus, it is impossible to assess latent changes in LV function using only LVEF. Two-dimensional (2D) speckle tracking echocardiography (STE) is a promising imaging modality, Similar to tissue Doppler imaging (TDI). It permits offline calculation of myocardial velocities and deformation parameters such as strain and strain rate (SR).
It is well accepted that these parameters provide important insights into systolic and diastolic function, ischaemia, myocardial mechanics and many other pathophysiological processes of the heart. (Pavlopoulos H et al., 2008:479e91)
In contrast to TDI, STE uses a completely different algorithm to calculate deformation: by computing deformation from standard 2D grey scale images, it is possible to overcome many of the limitations of TDI. Reisner SA et al(2004) revealed that two-dimensional speckle-tracking echocardiography (2D-STE) provides a better characterization of subtle changes in LV function than LVEF. The aim of the present study was to evaluate the relation between the severity of valvular obstruction and GLS measured by 2DSTI in AS patients with preserved EF.
PATIENTS AND METHODS
Prospective study included 65 patients, 50 of whom with different degrees of AS & 15 are cardiologicaly free referred for routine cardiovascular assessment, divided
into four groups, control(normal), mild, moderate & severe AS. We excluded patients with mitral valve disease, coronary artery disease (CAD), patients with LV systolic dysfunction (ejection fraction (EF %) <50%) and patients with cardiac rhythm disturbances such as atrial fibrillation or artificial pacing.
All patients undergo Standard 12 leads surface ECG, Routine laboratory samples for complete blood count, kidney function tests, lipid profile, echocardiography to
assess the LV systolic function, complete aortic valve
assessment and evidence of no wall motion abnormalities at rest, 2D
Speckle tracking Echocardiography (STE): 2D
echocardiography images (transmit/receive 1.9/4.0 MHz) were obtained from LV apical LAX, 4C, and 2C views with frame rates of 30–90 frames/s. Digital data were stored and analyzed off-line. LV endocardial surface was traced manually, and the speckle tracking width was modified so as to cover the whole LV wall thickness to obtain curves for peak longitudinal strain of the Inferior septum and lateral wall in the apical four-chamber view (4C-PLS), the Inferior and anterior wall was in the apical two chamber view (2C-PLS), and the infero lateral and anterior septum in the apical three-chamber view (3C-PLS). Left ventricular global longitudinal systolic strain (LV-GLS) was calculated by averaging the peak systolic values of the 6 LV walls. As
shown in (Figure 1).
Statistical analysis
Data are presented as mean ± SD for continuous data and as number (%) for categorical data. Between groups analysis was done using student t-test for continuous data and Chi-square test, level of evidence was detected to be significant at P value<0.05 was considered statistically P value <0.01 was considered highly significant.
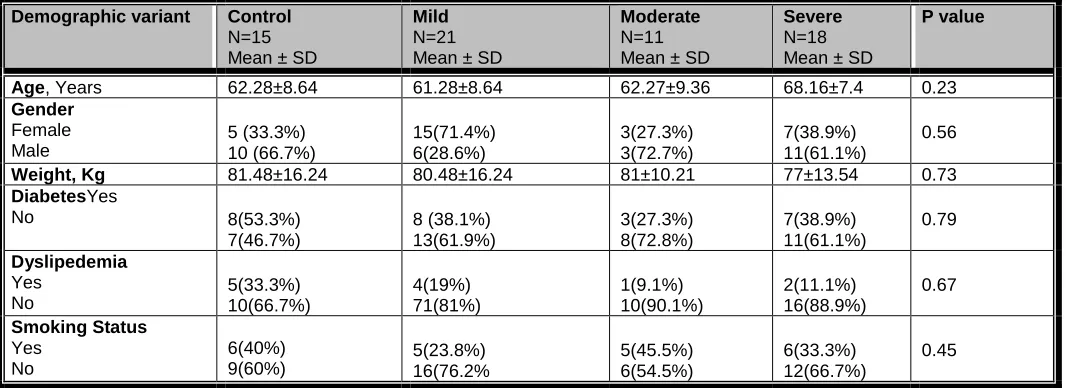
Table 1: Demographic charactaristics of studied groups:
P value Severe
N=18 Mean ± SD
Moderate
N=11 Mean ± SD
Mild
N=21 Mean ± SD
Control
N=15 Mean ± SD
Demographic variant 0.23 68.16±7.4 62.27±9.36 61.28±8.64 62.28±8.64
Age, Years
0.56 7(38.9%) 11(61.1%) 3(27.3%) 3(72.7%) 15(71.4%) 6(28.6%) 5 (33.3%) 10 (66.7%) Gender Female Male 0.73 77±13.54 81±10.21 80.48±16.24 81.48±16.24 Weight, Kg 0.79 7(38.9%) 11(61.1%) 3(27.3%) 8(72.8%) 8 (38.1%) 13(61.9%) 8(53.3%) 7(46.7%) DiabetesYes No 0.67 2(11.1%) 16(88.9%) 1(9.1%) 10(90.1%) 4(19%) 71(81%) 5(33.3%) 10(66.7%) Dyslipedemia Yes No 0.45 6(33.3%) 12(66.7%) 5(45.5%) 6(54.5%) 5(23.8%) 16(76.2% 6(40%) 9(60%) Smoking Status Yes No
Data are presented as mean ±SD or number (percent), N= number
Table 2 : laboratory criteria of studied groups:
P value Severe
No=18 Mean ± SD Moderate
No=11 Mean ± SD Mild
N=21 Mean ± SD Control
N=15 Mean ± SD Lab criteria 0.19 13.22±1.4 13.98±1.52 13.04±1.32 14.5±1.35 Hemoglobin 0.40 1.2±0.21 0.98±0.23 1.33±1.03 1.23±1.13 Creatinine
Data are presented as mean ±SD or number (percent)
Table 3: P value Severe AS No=18 Moderate AS N=11 Mild AS N=21 Control N=15 ECG Variant 0.001 13(72.2%) 5(27.8%) 6 (54.5%) 5(45.5%) 0 (0%) 21(100%) 0 (0%) 15(100%) LVH Yes NO 0.04 5(27.8%) 13(72.2%) 2(18.2%) 9(81.8%) 0(0%) 21(100%) 0 (0%) 15(100%) ST changes Yes NO 0.02 4(22.2%) 14(77.8%) 0 (0%) 11(100%) 0 (0%) 21(100%) 0 (0%) 15(100%) LA abnormality Yes NO 0.001 12(66.7%) 6(33.3%) 4(36.4%) 7(63.6%) 1(4.8%) 20(95.2%) 0 (0%) 15(100%)
T wave inversion
Yes NO
LVH= left ventricular hypertrophy; LA= left atrium; N= number
RESULTS
Demographic characteristics
The study included 65 subjects, 53.8% males and 46.2% females with the mean age 61.28±8.64 years with baseline
clinical characteristics as shown in Table (1). There was
no significant statistical difference between 4 groups (p value >0.05).
Laboratory investigations
Regarding laboratory investigations in studied groups there was no significant statistical difference, p value
ECG study
Baseline ECG analysis in the studied groups shows significant statistically ECG changes (LVH, ST changes, LA abnormality and T wave inversion) with p value less
than 0.05 in severe cases as shown in (Table 3)
Baseline Echocardiographic criteria of the studied population (Table4):
Table 4: Baseline Echocardiographic criteria of the studied population:
P value Severe
N=18 Mean ± SD
Moderate
N=11 Mean ± SD
Mild
No=21 Mean ± SD
Control
No=15 Mean ± SD
Echo data 0.41 3.02±0.39 3.12±0.27 2.95±0.37 2.99±0.39 LVESD 0.25 5.1±0.33 5.26±0.26 4.9±0.37 5±0.34 LVEDD 0.001 3.9±0.38 3.6±0.26 3.3±0.31 3.2±0.41 LAD 0.07 63.89±4.62 62.36±3.17 61.33±1.79 61.01±1.9 EF 0.134 35.5±2.5 35.18±1.53 34.33±1.23 34.22±1.33 FS 0.007 130.2±2.11 118.6±14.6 117±16.8 115±16.1 LVMI 0.05 32.5±4.7 35.72±3.1 34.95±2.85 34.05±2.80 ESV 0.16 107.2±8.3 109±8.33 112.7±9.51 111.7±9.71 EDV 0.001 1.2±0.06 1.1±0.1 0.9±0.1 0.9±0.09 PWT 0.001 1.4±0.08 1.24±0.1 1.03±0.11 0.9±0.12 IVS 0.001 0.7±0.07 0.89±0.08 1.13±0.14 3.15±0.15 AVA 0.001 59.4±7.7 35.7±5.39 15.8±4.88 6±3.85 MPG 0.001 4.7±0.2 3.76±0.33 2.57±0.27 1.77±0.30 PV
LVEDD; left ventricular end diastolic dimension, LVESD; left ventricular end systolic dimension. LAD; left atrial diameter, EF; ejection fraction, FS; fractional shortestatisticalning, LVMI; left ventricular mass index. ESV; end systolic volume, EDV; end diastolic volume, PWT; posterior wall thickness, AVA; aortic valve area. IVS; inter ventricular septum, MPG; mean pressure gradient, PV; peak velocity.
Speckle tracking criteria of studied groups (Table 5)
There is statistically significant decrease in GLS with
increasing severity of AS as shown in table (5), and figure
(2).
Table 5 : Speckle tracking criteria of studied groups:
P value Severe N=18 Moderate N=11 Mild N=21 Control N=15 Speckle tracking 0.001 12.42±1.4 15.35±1.6 18.8±1.3 18.9±1.4 GLS
Data are presented as mean ±SD or number (percent), N= number
Fig 2: comparison between studied groups as regard GLS.
DISCUSSION
Because of the statistically significant correlation between AS and LV dysfunction and the higher likelihood of initial poor outcomes, it would be beneficial to know the true prevalence of coronary artery disease in this population and the associated risk factors to stratify patients with AS. It would also be helpful to know who, when, and with which test to screen such patients to achieve the most effective prevention of cardiovascular complications in this high-risk population. (Carabello et al., 2008; 523-661)
The measurement of global LV function is the most common indication for echocardiography, and LV dysfunction is known to be a strong prognostic marker of adverse outcome most commonly assessed by the calculation of EF, AS patients with normal left ventricular ejection fraction (LVEF) are frequently associated with subclinical LV dysfunction. However, LVEF is not known to be a sensitive marker for the detection of subclinical LV systolic dysfunction. The presence of impaired longitudinal function in AS patients has been reported when using
tissue Doppler imaging or speckle tracking
In this study, we demonstrated a significant relationship between GLS assessed by 2D-STE and AS severity in patients with normal EF., As the AS severity progresses, GLS was reduced, whereas EF was unchanged.
In contrary to several studies as the study designed by Hany Younan (2014) in Cardiology Department, Faculty of Medicine, Fayoum University, Egypt 2014. included 80 subjects compairing between 50 patients with severe AS (mean age: 45 ± 9 years) and 30 age-matched healthy individuals (mean age 43 ± 7 years resulted in significant reduction in LV-GLS in patients with AS compared to controls (<0.001), and negatively correlated with left ventricular mass index (LVMI) irrespective of EF%, maximum velocity, peak pressure gradient and mean pressure gradient across the aortic valve and the aortic valve area. Our study demonstrated that GLS gradually decreased from an earlier to later stage of AS with unchanged EF.
Our study is in agreement with a study designed in
Department of Cardiology, and Department of
Cardiovascular Surgery, Juntendo University School of Medicine, Tokyo, Japan 2011(Sakiko Miyazaki et al.,2011: 703–708) they studied 113 AS patients (age, 63.3 ±8.8) years; male, 38%; female 62%, aortic valve area (AVA), 1.0 ± 0.3 cm2; mean pressure gradient (PG, 33.8 ± 22.1mmHg) with normal LVEF (≥50%) but without overt coronary artery disease. Patients were stratified into three groups (mild, moderate and severe AS), and the clinical characteristics and echocardiographic findings were compared among the groups, GLS was measured, the results of this study are that the LVEF was not significantly different among the three groups. However, GLS showed significant differences in GLS among the three groups (mild: 17.1 ± 3.0%, moderate: 16.4 ± 3.0% and severe: 14.5 ± 3.9%, ANOVA P = 0.003). GLS was significantly correlated with AVA, mean PG& LV mass index denoting that Despite unchanged LVEF, GLS gradually decreased as severity of AS increases.
We are in agreement with a larger study(Kusunose K et al.,2014):938-45) included 395 AS patients (70±14 years, 57% men) with aortic valve area <1.3 cm2 evaluated between January to June 2008 (excluding severe other valve disease and LV ejection fraction <50%). AS patients were classified as (a) moderate–severe (n=93; aortic valve area, 1.1–1.3 cm2), (b) standard severe (n=161; aortic valve area, ≤1 cm2; mean gradient ≥40 mm Hg), and (c) paradoxical severe (n=141; aortic valve area, ≤1 cm2 and mean gradient <40 mm Hg), and this study results in that LV-GLS was independent predictor of mortality. LV-GLS <−12.1% was associated with significantly reduced survival.
We are also in agreement with even studies focusing on
congenital AS patients (Susan M et al., 2015.07.042)as
AS with a median age of 15.3 years (range 1.7 to 23.7), highest life time AS peak gradient of 73 mm Hg (22 to 110), most recent AS peak Doppler gradient of 49 mm Hg (0 to90), and ejection fraction of 65 (55 to 79) were included. Strain was measured using 2- dimensional speckle-tracking echocardiography. Cardiac magnetic resonance was used to identify focal fibrosis by late gadolinium enhancement (LGE) and diffuse fibrosis by calculating the extracellular volume fraction (ECV) Compared to age-matched controls (n [ 29), patients with AS had reduced
LV longitudinal strain (17.0 – 3.0% vs 20.6 – 2.2%, p
<0.001), radial strain (28.8 – 8.6% vs 34.9 – 8.5%, p [
0.01), and similar circumferential strain (26.2 – 5.9% vs
26.4 – 3.9%, p [ 0.79). Median ECV in patients with AS
was 0.27 (0.22 to 0.38) and was not significantly correlated with systolic strain.
Patients with LGE (n [ 7) had lower longitudinal strain than
those without LGE (n [ 21; 15.0 – 2.2 vs 17.7 – 3.1, p [
0.036). denoting that in children and young adults with congenital AS and preserved ejection fraction, longitudinal and radial strain were reduced, and decreased longitudinal strain was associated with LGE but not ECV. Decreased left ventricular (LV) global longitudinal strain by 2-dimensional speckle-tracking echocardiography has been found in children with congenital AS who have a normal ejection fraction, but its cause has not been established. One hypothesis is that pressure overload on the left ventricle may compromise myocardial perfusion and lead to ischemia and fibrosis.
Also, in New York 2013 a total of 58 patients with various degrees of isolated congenital aortic stenosis (CAS) and 52 healthy controls were enrolled in a study. (Vehbi Dogan et al., 2013) Conventional and two-dimensional speckle tracking (2DSTE) echocardiography were performed. Global longitudinal strain (-23.1 ± 3.6 and -23.8 ± 4.7), and longitudinal strain rate (LSR) (-1.49 ± 0.32 and -1.76 ± 0.39) values were lower as in our study where as circumferential strain (CS) (-25.9 ± 4.7 and -22.8 ± 6.4) and circumferential strain rate (CSR) (-1.82 ± 0.46 and -1.69 ± 0.49) values were greater in the patient group than in the control subjects. The difference was significant for global LSR and CS (p\0.05) values. Regional analysis showed lower LS values in the basal part of the left-ventricular free wall and lower LSR values in the basal parts of both of the septum and free wall in the patient group (p\0.05). CS values in the antero septal, posterior, and inferior walls were significantly greater in the patients (p\0.05).
Conventional echocardiographic parameters were similar between groups (ejection fraction, pulmonary artery pressure, heart chamber diameters), But aortic velocity was significantly higher (2.1 m/s vs 1.3 m/s, p¼0.001) in the group with AS and the difference increased at peak exercise (2.7 m/s vs 1.7 m/s, p<0.001). Left ventricular global longitudinal strain (GLS) was not only significantly lower in the group with AS (18.6_2.7 vs 21.2_2.8, p¼0.034) when compared with the control group but also the difference became more pronounced during peak exercise (18.1_2.7 vs 23.8_2.3, p<0.001), so GLS is more sensitive than EF for predicting mortality, particularly in patients with an EF>50%. If a certain level of GLS predicts prognosis of asymptomatic AS patients, the assessment of GLS may provide useful information to identify asymptomatic AS patients that might benefit from earlier AVR. Global longitudinal strain measurement by 2DSTE was superior to EF for the prediction of outcome and may become the optimal method for assessment of global LV systolic function. (Carabello BA et al., 2009:956-66)
CONCLUSION
Our study reinforces that LVEF is not a sensitive indicator for the detection of subclinical systolic dysfunction. STE
seems to prevail over other echocardiographic
approaches in the evaluation of subclinical left ventricular myocardial abnormalities in AS patients; it appears to be more sensitive and more independent from various confounders. Also, Reduction in longitudinal peak systolic
strain assessed using 2D speckle tracking
echocardiography (STE) is an early indicator of subclinical left ventricular (LV) dysfunction in AS patients. Global LV strain might provide useful information about the risk of AS patients. Severity of AS was a predictor for the reduction of global left ventricular strain which decrease from earlier to later stage of AS.
RECOMMENDATION
The detection of subclinical cardiovascular complications in AS patients may provide an approach for identifying high risk individuals who may benefit from earlier AVR to prevent such complications. So, it is suggested that all patients with AS should be routinely and repeatedly subjected to tissue Doppler and 2D speckle tracking echocardiography assessment of cardiac functions during long term management. It is recommended to perform this study on a larger scale of patients to get more accurate statistical analysis of the results.
Study limitations
The relatively limited number of the patients could limit the strength of results and conclusion obtained from this study. We could not exclude patients who had subclinical CAD because not all the patients in this study underwent
coronary angiography. These patients may have different GLS Compared with patients that have pure AS.
REFERENCES
Carabello B. A. and Paulus W. J. (2009). Aortic stenosis. Lancet. 2009 Mar 14;373(9667):956-66.
Carabello, Chatterjee K, Freed. Bonow AHA, ACC, guidline for management of patients with valvular heart disease society of cardiovascular, intervention and thoracic surgeons Circulation 118; 523-661 (2008). Hany Younan (MD), Two-dimensional speckle tracking
echocardiography in detection of subclinical left ventricular systolic dysfunction in patients with severe
aortic stenosis 0019-4832/Copyright © 2014,
Cardiological Society of India.
Kusunose K, Goodman A, Parikh R, Barr T, et al. Incremental Prognostic Value of Left Ventricular Global Longitudinal Strain in Patients with Aortic Stenosis and
Preserved Ejection Fraction. Circ Cardiovasc
Imaging. 2014 Nov;7(6):938-45.
Murat Sunbul, Aysel Akhundova, Ibrahim Sari, et al. (2013); Utility of Speckle Tracking Echocardiography in Asymptomatic mild to moderate aortic Stenosis at rest and during supine bicycle exercise test, Journal of the American College of Cardiology · October 2013. Marwick TH, Leano RL, Brown J, et al. Myocardial strain
measurement with 2-dimensional speckle-tracking echocardiography: definition of normal range. JACC Cardiovasc Imaging 2009; 2:80e4.
Otto C M, Prendergast B. Aortic-valve stenosis – from
patients at risk to severe valve obstruction. N Engl J Med. 2014; 371: 744-756.
Pavlopoulos H, Nihoyannopoulos P. Strain and strain rate deformation parameters: from tissue Doppler to 2D speckle tracking. Int J Cardiovasc Imaging 2008; 24:479e91.
Reisner SA, Lysyansky P, Agmon Y, et al: Global longitudinal strain: A novel index of left ventricular systolic function. J Am Soc Echocardiogr 2004;17:630– 633.
Rosenhek R, Baumgartner H. Valvular Heart Disease: A
Companion to Braunwald's Heart Disease,
Philadelphia: Saunders/Elsevier; 2009:127-154. Sakiko Miyazaki, Masao Daimon, et al. Global Longitudinal
Strain in Relation to the Severity of Aortic Stenosis: A
Two-Dimensional Speckle-Tracking Study.
Echocardiography, 28: 703–708. doi:10.1111/j.1540-8175.2011.01419.x
Susan M, Dusenbery,et al. Left Ventricular Strain and Myocardial Fibrosis in Congenital Aortic Stenosis, The American journal of cardiology· September 2015 DOI: 10.1016/j.amjcard.2015.07.042.
Accepted 18 June, 2017.
Citation: Maklad WA, Abd El moneum MS (2017). A Speckle Tracking Echocardiographic Study for Correlation Between Global Left Ventricular Strain and Severity of Aortic Stenosis. International Journal of Cardiology and Cardiovascular Research 3(2): 045-051.