Reconciling user and project manager
perceptions of IT project risk: a Delphi
study
1
Mark Keil*, Amrit Tiwana
†& Ashley Bush
‡* Department of Computer Information Systems, Robinson College of Business, Georgia State University, Atlanta, GA 30303, email: [email protected],†Goizueta Business School, Emory University, Atlanta, GA 30322, and ‡College of Business, Florida State University, Tallahassee, FL 32306, USA
Abstract.In an increasingly dynamic business environment characterized by fast cycle times, shifting markets and unstable technology, a business organization’s survival hinges on its ability to align IT capabilities with business goals. To facili-tate the successful introduction of new IT applications, issues of project risk must be addressed, and the expectations of multiple stakeholders must be managed appropriately. To the extent that users and developers may harbour different per-ceptions regarding project risk, areas of conflict may arise. By understanding the differences in how users and project managers perceive the risks, insights can be gained that may help to ensure the successful delivery of systems. Prior research has focused on the project manager’s perspective of IT project risk. This paper explores the issue of IT project risk from the user perspective and compares it with risk perceptions of project managers. A Delphi study reveals that these two stakeholder groups have different perceptions of risk factors. Through compari-son with a previous study on project manager risk perceptions, zones of concor-dance and discorconcor-dance that must be reconciled are identified.
Keywords: Delphi study, IT project risk, user perceptions
I N T R O D U C T I O N
Paradoxically, as businesses become increasingly dependent on their information systems, neither the frequency nor the magnitude of information technology (IT) failures has decreased significantly over the past decade. Even with the widespread emergence of electronic com-merce – an instance in which the very survival of a firm hinges on its information systems –
1An earlier version of this paper was presented at the Second Southern Association for Information Systems
trends observed in the industry are nothing short of alarming. Few, if any, realms within IT are exceptions; 50% of data warehousing projects typically fail (Watson & Haley, 1997), close to 80% of knowledge management systems never deliver (Tiwana, 2000), and as many as 25% of electronic commerce systems fail during transactions after final implementation (Orr, 1999). A heavy price is paid for these failures; in 1998, the cost of failed IT projects was an estimated $75 billion in the USA alone (Johnson, 2000).
Advocates of IT project risk management claim that, by identifying and analysing threats to success, action can be taken to reduce the chance of failure (Boehm & Ross, 1989; Charette, 1989; Boehm, 1991). The obvious first step in IT project risk management is the identification of the risk factors to be controlled. According to Schmidt et al. (2001), we define a risk factor as a condition that can form a serious threat to the successful completion of an IT project.
Introducing new IT systems into an organization necessitates integrated change, concur-rently attending to technical, human and organizational aspects of IT, while simultaneously accommodating the diverse interests of multiple stakeholder groups. When we speak of man-aging project risk, it is therefore important to ask: ‘From whose perspective – the project manager, the user or some other stakeholder?’ Schmidt et al. (2001) suggest that this is an important area for research. In this paper, we report the results of a Delphi study designed to examine how users’ perceptions of IT project risk compare with the perceptions of project managers. Accordingly, zones of concordance and zones of discordance between the two stakeholder groups are mapped and analysed. The results of the study suggest that, although there are some similarities in the risk factors that users and project managers consider impor-tant, there are also important differences as well.
B AC KG R O U N D
Despite the use of new tools and methodologies, the failure rate for IT projects remains high. Although precise figures on failure rates are hard to come by, it has been reported that more than half of all IT projects have unsatisfactory outcomes (Lyytinen & Hirschheim, 1987). Based on a recent survey conducted by the Standish Group, about 75% of all IT projects are cancelled before completion or are delivered over budget, behind schedule and with fewer features and functions than initially specified (Johnson, 2000). The Standish Group’s figures indicate that the average IT project exceeds its budget by 90% and slips off its schedule by 120%.
The presence of various risk factors in IT projects and the need to manage these risks is well documented in the information systems literature. Failure to understand, identify and manage these risks is often cited as a contributing factor in IT project failures (Alter & Ginzberg, 1978; Ginzberg, 1981; McFarlan, 1981; Charette, 1989; Boehm, 1991; Barki et al., 1993). Many studies (e.g. Ginzberg, 1981; McFarlan, 1981; Barki et al., 1993; Drummond, 1996) suggest that failure to manage risks causes common problems such as cost overruns, unsuit-ability for intended task, unmet user requirements and schedule overruns. McFarlan (1981), for example, states that software projects fail because of ‘the failure to assess individual project risk’.
The failed Taurus project at the London Stock Exchange provides a well-documented example of what can happen when risks are not properly identified and managed (Drummond, 1996). Begun in the late 1980s, Taurus was designed to computerize the share settlement process. By 1989, the projected cost of implementing Taurus was set at £50 million, and the schedule for implementation was October 1991. When the Taurus project was finally cancelled in 1993, the Stock Exchange had spent over £80 million, and securities firms within the City of London had collectively spent an estimated £400 million developing their own systems in preparation for Taurus. In the end, all this spending was for nought. Drummond’s (1996) analy-sis suggests that one reason why Taurus failed was that the risks were not formally identified but only casually observed. As a result, the importance and significance of these risks were never formally assessed, the risks were not managed and the project eventually died as a spectacular failure.
Examples such as Taurus suggest that the concept of IT project risk management represents a viable approach for avoiding failure. Both Boehm (1991) and McFarlan (1981) have stressed the importance of empirically categorizing the sources and types of risks associated with software development projects. But, what are the risks associated with IT projects?
Within the information systems literature, a variety of different checklists and instruments have emerged to help managers to assess and manage IT project risk. McFarlan (1981), for example, has developed a series of questions designed to gauge the riskiness of an IT project. Boehm & Ross (1989) provide a ‘top-ten’ list of risk factors that can be used as a checklist for identifying risks that can adversely affect IT projects. Based on a review of the informa-tion systems literature, Barki et al. (1993) developed a risk assessment instrument designed to measure various risk factors that can affect IT projects. More recently, Schmidt et al. (2001) have developed a list of risk factors based upon the inputs of practising software project managers.
The project manager perspective on risk
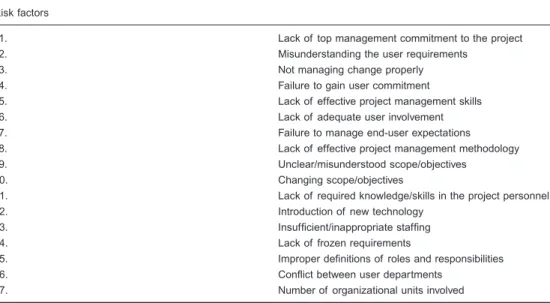
Schmidt et al. (2001) identified the risk factors perceived to be of most significance, and their relative importance, from the perspective of project managers.Using the Delphi method, they assembled separate panels of experts in the USA, Hong Kong and Finland. Their work yielded an initial list of 53 unique risk factors identified by their three panels of experts (Schmidt et al., 2001). Each country panel was then allowed to pare the list down and asked to rank and rate the importance for each risk factor that was retained in the reduced set (see Schmidt et al., 2001 for a complete discussion of the method used). In our research, we took the reduced set of risk factors that came out of the US panel of software project managers as our point of departure for comparing user and project manager perceptions of risk. This allowed us to compare user and project manager perceptions of risk, while controlling for country culture (as both samples were drawn from the US). These risk factors are shown in Table 1 in the order in which they were ranked.
Beyond a unilateral view of risk
Although the Delphi study conducted by Schmidt et al. (2001) is interesting, the risks were identified, ranked and rated from the perspective of software project managers. As many project managers are drawn from the ranks of the information systems department, their risk perceptions are more likely to represent the interests and perspective of system developers as opposed to system users. From previous literature, we know that developers and users are both important stakeholders in the design and development of information systems and that they often bring a different perspective to IT projects. Developers, for example, may perceive user involvement as being less critical to the successful development of systems (White & Leifer, 1986). As different stakeholders, developers and users may also hold different expec-tations regarding what constitutes a successful or unsuccessful project (Lyytinen, 1988).
Bridging the gaps between developers and users is a theme that runs through much of the information systems literature (see, for example, De Brabander & Thiers, 1984; Grudin, 1991; Keil & Carmel, 1995). The quality of communication between these two stakeholders during the design and development of an information system is often a critical factor in determining its success (De Brabander & Thiers, 1984).
To the extent that project managers and users may have different risk perceptions, this may indicate the need for improved communication in order to develop a shared understand-ing of project risk. Without such a shared understandunderstand-ing of risk, it is unlikely that project managers and their development team will be able to work together effectively with users to reap the returns associated with successful IT projects. Indeed, different risk perceptions may Table 1.Seventeen risk factors ranked as important by US panel of software project managers (Schmidt et al., 2001) Risk factors
1. Lack of top management commitment to the project 2. Misunderstanding the user requirements
3. Not managing change properly
4. Failure to gain user commitment
5. Lack of effective project management skills 6. Lack of adequate user involvement 7. Failure to manage end-user expectations 8. Lack of effective project management methodology 9. Unclear/misunderstood scope/objectives
10. Changing scope/objectives
11. Lack of required knowledge/skills in the project personnel
12. Introduction of new technology
13. Insufficient/inappropriate staffing
14. Lack of frozen requirements
15. Improper definitions of roles and responsibilities
16. Conflict between user departments
also translate into differences in the returns perceived, as risk and return tend to go hand in hand.
The process of introducing deliberate change, such as that induced by the introduction of a new information system, requires agreement on threats and challenges (Kotter, 1996). By extension, in order to manage IT projects successfully, there must be agreement on risks and threats to the success of a new IT project, reconciliation of divergent viewpoints and agree-ment on project priorities among the project managers and users of the information system. Although the information systems literature recognizes the significance of integrating multiple stakeholders’ knowledge during the course of design and coding (see, for example, Markus, 1983; Ramesh & Dhar, 1992; Kirsch, 1996; Iivari et al., 1998; Ramesh & Tiwana, 1999), there has been no attempt to integrate multiple stakeholder perspectives in the area of IT project risk. The absence of research in this area represents a target of opportunity for extending our current knowledge about IT project risk.
Although prior work on the risk perceptions of software project managers is a contri-bution to our understanding and is a necessary prerequisite to managing this risk, our understanding of risk is incomplete without also examining the risk perceptions of other stake-holders, such as the users involved in the software development process. Indeed, the first step in IT project risk management should be the identification of key stakeholders (e.g. project managers and users), who may have differing views of what is important in the software development process (Grey, 1995). As an important stakeholder group, the perception of users as to what constitutes risk in the development process may yield important insights into addressing and consequently mitigating these risks. If users and developers have differ-ent perceptions of project risk factors, there may be an increased potdiffer-ential for conflicts to arise.
In this research, our focus is on exploring the similarities and differences in how two key stakeholders – project managers and users – perceive certain project risk factors. In doing so, our aim is to provide a more integrative framework that encompasses both project manager and user perspective.
M E T H O D O LO G Y
The Delphi method was used for gathering and analysing data for this study. The Delphi method is a structured, multipass group decision process developed to address research prob-lems where there is no rigid answer. A panel of domain experts is selected, and each expert is asked to record independently what they think is important in dealing with the given problem. Individual responses are collected and aggregated, and a list of the factors uncovered is pre-sented to each panellist. Each is then asked to rank the factors identified by the group as a whole in terms of significance. These rankings are collated, and an overall ranking is com-puted. These reranked factors are then shown to each panellist along with their original ranking, and the panellist is invited to review their personal ranking in view of the aggregated group response. Many variations of the Delphi method have been used in the fields of
infor-mation systems, public policy, management, marketing and group therapy (e.g.Dalkey & Helmer, 1963; Dalkey, 1969; Taylor & Meinhardt, 1985; Brancheau & Wetherbe, 1987; McLellan & Marcolin, 1994; Brancheau et al., 1996; for a comprehensive review, see Turoff & Hiltz, 1996).
Data collection
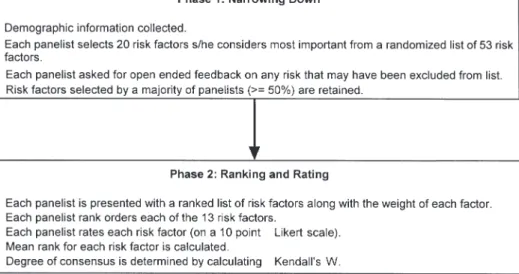
This study followed a modified version of the Delphi method (Schmidt, 1997) to measure group consensus about the relative importance of IT project risk factors, as described in Figure 1. Data were collected via the World Wide Web (instead of paper-based questionnaires admin-istered through the mail), which yielded the benefit of decreased data collection time. Each data collection phase was conducted within a 1-week time frame with a total of two sequen-tial phases.
In Phase 1, a convenience sample of 15 panellists was assembled. Each panellist was selected on the basis of his/her previous experience in serving as a user representative on one or more IT projects. Demographic information was collected from each panellist, estab-lishing that s/he had participated as a user representative in at least one IT project. On average, the users on our panel had 9.5 years’ experience at their current jobs, had partici-pated in more than a dozen projects and had been involved in multiple phases of the IT project life cycle. Table 2 provides descriptive statistics for our subjects.
For this survey, we defined user as an organizational member (other than an analyst) who had been involved in one or more phases of an IT project aimed at producing software for Figure 1.Delphi methodology used to obtain the user perspective on risk.
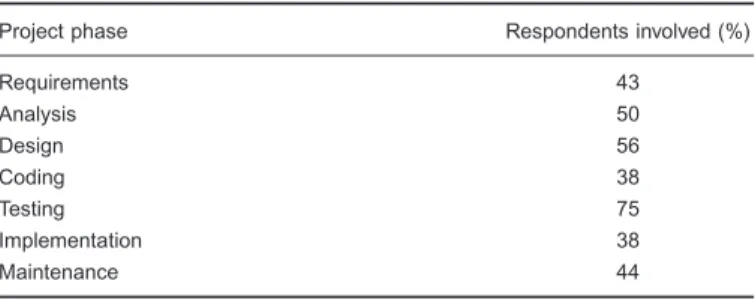
their end use. Table 3 provides additional descriptive statistics indicating the experience that our subjects had with different phases of project execution.
In Phase 1, the panellists were asked to select the 20 most important risk factors from a randomly ordered list of 53 risk factors derived from Schmidt et al.’s (2001) Delphi study of software project managers. This phase differed from traditional Delphi studies by beginning with a seeded list rather than having the panellists participate in a brainstorming session to generate the initial list. The purpose of beginning with the seeded list of 53 risk factors iden-tified by project managers was twofold: (1) to facilitate comparison of the perceptual differ-ences between the two stakeholder groups; and (2) to eliminate the possibility of variations in definitions of the risk factors that would prevent such comparative analysis. The panellists were also given the opportunity to provide open-ended feedback on any risks viewed as impor-tant but not included in the initial list. None of the panellists nominated any additional risks of their own, suggesting that the initial list was viewed as a complete one by the panellists. At the end of this phase, the 13 risk factors that were selected by a simple majority of the par-ticipants were retained for the next phase.
In Phase 2, panellists were presented with an ordered list of risk factors from Phase 1. The ordering of the risk factors was based upon the percentage of panellists who selected each risk factor in Phase 1. The percentages were indicated next to each risk factor. As feedback is one of the key strengths of the Delphi method, randomization of items at this juncture was not judged to be desirable. [As Lindstone & Turoff (1975) have noted, group response for-mation requires consistent presentation. The essence of the Delphi approach is structuring the group communication process (Turoff & Hiltz, 1996) such that the group receives
consis-Table 2. Sample characteristics
Mean SD Min Max
Years at current job 9.47 6.76 3 31 No. of projects 13.3 20.6 2 75 No. of project phases 3.4 2.13 1 7
Age (years) 28.6 6.8 21 49
Table 3. Respondent involvement in various project phases
Project phase Respondents involved (%)
Requirements 43 Analysis 50 Design 56 Coding 38 Testing 75 Implementation 38 Maintenance 44
tent feedback at each stage. Presenting randomized risk factors at this stage would not take advantage of the feedback that the group provided in narrowing the list of risk factors (Phase 1). The intent of forcing respondents to reconsider their viewpoints in view of the group’s would be lost if items were randomized.] Thus, based on feedback from the group’s initial selection process, the panellists were then asked to rank and rate each risk factor. Ranking involved exclusively assigning ranks 1 to 13 to each risk factor. Rating used a 10-point Likert scale to assign a level of relative importance to each risk factor. Additionally, each panellist was asked to provide an open-ended explanation for the selection of his/her top ranked factor. At the end of Phase 2, a mean rank for each factor was computed, and Kendall’s coefficient of concordance (W) was calculated to determine the degree of consensus among the panellists (Schmidt, 1997).
R E S U LT S A N D D I S C U S S I O N
Phase 2 resulted in a Kendall’s W of 0.500, which represents a moderate level of consensus among panellists (Schmidt, 1997). According to Schmidt (1997), we can have a fair degree of confidence in these results. In Delphi studies, it is common to conduct additional rounds to see if consensus can be improved further. However, in this study, a decision was made to rely on the results of the first round.
Although we did attempt to conduct an additional round to see if the consensus could be further improved, we experienced a significant drop-off both in response rate (from 15 to 10 panellists) as well as in the level of consensus (Kendall’s W of 0.24). These results suggest weak agreement among panellists and, according to Schmidt (1997), we can have only a low degree of confidence in the results. In order to understand the drop-off in both response and consensus level that occurred in the second round, several panellists were contacted. The feedback we received from them suggested that some panellists questioned the value of going through the exercise again. Moreover, those who did choose to continue the exercise may not have given it their full attention. Without full commitment from the panellists, there was little value in continuing the exercise. Moreover, in the first round, we had already achieved a moderate level of consensus that was consistent with that obtained by Schmidt et al. (2001) for two of their three panels.
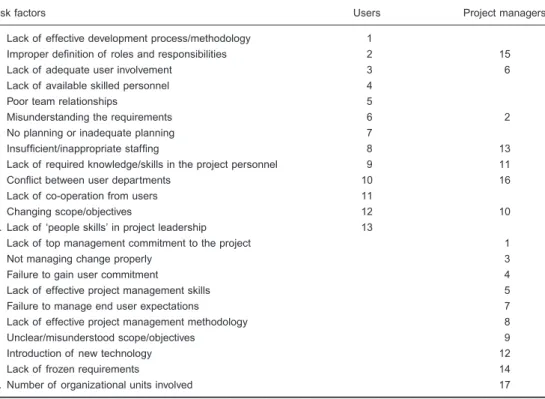
The results of our study suggest that there are areas of agreement and disagreement among user and project manager perceptions of risk factors. Table 4 shows the comparison between risks rated as most important by users vs. project managers. As our user panellists were drawn from the USA, as a basis for comparison, we draw upon the results reported by Schmidt et al. (2001) for their US panel of software project managers. Of the 13 risks chosen for ranking by the user group, only seven were chosen for ranking by the US project man-agers. In contrast, four of the top five risks ranked by the US project managers were not judged to be important enough to be ranked by the users. These results indicate a very different per-ception of the risks involved in the software development process and point to the need for clearer understanding of various stakeholders’ perspectives regarding IT project risk.
Table 4. Comparison of users and project managers
Risk factors Users Project managers
A. Lack of effective development process/methodology 1
B. Improper definition of roles and responsibilities 2 15
C. Lack of adequate user involvement 3 6
D. Lack of available skilled personnel 4
E. Poor team relationships 5
F. Misunderstanding the requirements 6 2
G. No planning or inadequate planning 7
H. Insufficient/inappropriate staffing 8 13
I. Lack of required knowledge/skills in the project personnel 9 11
J. Conflict between user departments 10 16
K. Lack of co-operation from users 11
L. Changing scope/objectives 12 10
M. Lack of ‘people skills’ in project leadership 13
N. Lack of top management commitment to the project 1
O. Not managing change properly 3
P. Failure to gain user commitment 4
Q. Lack of effective project management skills 5 R. Failure to manage end user expectations 7 S. Lack of effective project management methodology 8 T. Unclear/misunderstood scope/objectives 9
U. Introduction of new technology 12
V. Lack of frozen requirements 14
W. Number of organizational units involved 17
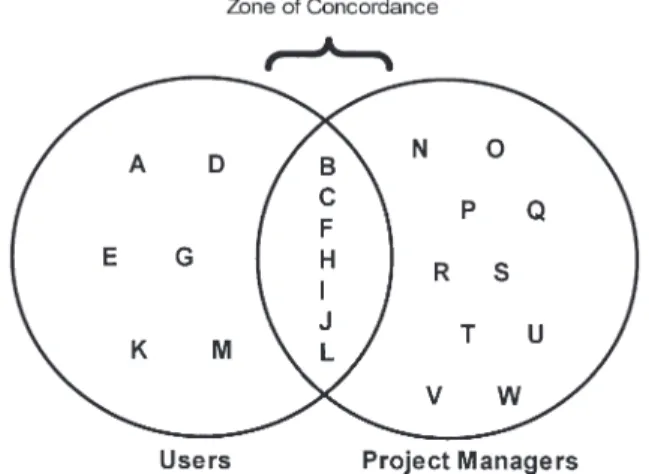
Figure 2 maps perceptual differences and commonalties between users and project man-agers conceptually. Each risk factor ranked by the panel of users and each risk factor ranked by the corresponding panel of US project managers (Schmidt et al., 2001) is mapped in the Venn diagram (indicated by a letter corresponding to Table 4), and the intersection between the two sets represents the zone of concordance.This zone represents risk areas over which there is considerable agreement among the user and project manager stakeholder groups. To the right of this area in Figure 2 lie risks that are perceived as being significant by project managers, but not by users. Similarly, to the left are the risks that are perceived as being sig-nificant by users, but not by project managers.
User panellists were asked to provide justification for the selection of their top-ranked factor in Phase 2 of our study. Examining the reasons and justifications underlying their choices provides additional insights into the user perspective on IT project risk.
The top three risks ranked by the users were: lack of effective development process/method-ology {A}, improper definition of roles and responsibilities {B} and lack of user involvement {C}. It is interesting to note that the users’ top-ranked risk factor {A} was not even judged important enough to be ranked by the US project managers. The users’ second and third
ranked risk factors, however, were also ranked by the project managers. We discuss the users’ top three risk factors below.
Lack of effective development process/methodology
Lack of effective development process/methodology, risk factor {A}, tops the user-generated risk list but was not judged to be important enough to be ranked by the US project managers. Users view this risk as leading to an end-product that does not meet their needs. The follow-ing remarks from three of our panellists were typical:
Can lead to a finished product [that] is inadequate and, in some cases, completely useless. Improperly structured development causes an improperly developed product which does not meet the requirement of either the end users or the developers.
Unless a proper and thoroughly planned approach is taken the project will have quality prob-lems emerging in advanced stages of deployment.
It is interesting to note that the users seem to perceive that there is some probability that project managers will not employ an effective development methodology, but project managers appear to have more faith in their selected methodology. This raises the question of whether the users are seeing ghosts, or whether the project managers are blind to a major weakness. (The authors would like to thank an anonymous reviewer for bringing this issue to our atten-tion and suggesting this interpretaatten-tion.)
Improper definition of roles and responsibilities
Users felt that improper definition of roles and responsibilities, {B}, was the second most sig-nificant risk factor, and this was one that was also ranked by the US project managers. One panellist stated that improper definition of roles and responsibilities leads to missed require-Figure 2.Risk perceptions among users vs. project managers.
ments because everyone on the project team is not clear as to what they should be doing and ‘[y]ou can build the world’s best car but if someone forgets to bring the gasoline then the car will not move!’ Another user observed that ‘. . . most projects end up having items not com-pleted because everyone on the team thought someone else was responsible for that item’. Another user linked this problem to the lack of rewards or financial incentives.
People tend to feel they do not need to do any work unless they have a defined role within the project that states exactly what they need to accomplish. At some companies, pay is directly related to a person’s objectives and [compensation] does not increase or decrease by doing something beyond their defined roles and objectives. Therefore, people do not feel they benefit by doing items that are not defined as role related. The end result is a project with parts either incomplete or rushed into production that contain errors.
And another user related inattention to role definition with overlap and conflict.
. . . responsibility of each participant must be clearly determined otherwise there will be overlap, conflict, mismanagement and unsatisfactory outcomes from the project.
Lack of user involvement
Risk factor three {C}, lack of adequate user involvement, was also ranked by the US project managers and underscores a common concern with any IT project. As one panellist explained: If users are not involved from the beginning, then a project risks being all for naught if no one can (or will) use the finished product.
Areas of agreement on risk
As indicated by the zone of concordance in Figure 2, there were seven risk factors that users and project managers both ranked as important. These risks include:
•
improper definition of roles and responsibilities;•
lack of adequate user involvement;•
misunderstanding the requirements;•
insufficient/inappropriate staffing;•
lack of required knowledge/skills in the project personnel;•
conflict between user departments;•
changing scope/objectives.Clearly, these represent areas of agreement on risk. Given that both stakeholder groups selected these risks, we can be reasonably certain that they are valid areas of concern regard-less of whose perspective the project is viewed from. Although both stakeholder groups selected these seven risks for ranking, this does not mean that they necessarily agree on the relative importance of the risk factors. Table 3 shows that there were differences in relative rank ascribed to each of these risk factors, providing suggestive evidence on this point.
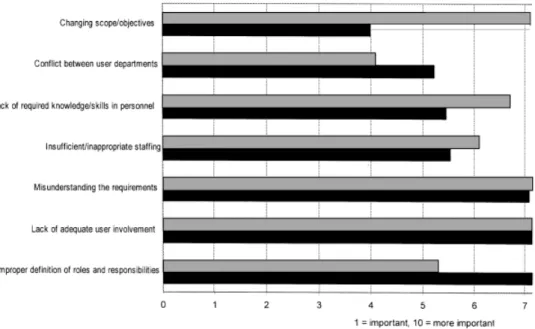
However, as the number of risk factors selected as being important enough for ranking by the users (13) was different from the number of factors selected by the project managers (17), it is difficult to make direct comparisons on the basis of how a particular factor was ranked. To allow for such direct comparisons, we collected data on the relative importance ascribed to each risk factor (using a 10-point scale, where 10 represented more important). Figure 3 shows the relative importance (mean rating) ascribed to the seven risk factors that were selected by both the users in our study and the project managers in Schmidt et al.’s (2001) study. (Mean importance ratings for the majority of these items were reported by Keil et al. (1998). Addi-tional data were obtained directly from the authors.) A key observation that emerges from this comparison is that users and managers generally seem to agree on the importance of risk factors that are perceived as significant by both groups. Figure 3 does provide some evidence, however, that users and project managers do not always agree on the relative importance of a particular risk factor.
Examination of Figure 3 indicates that the greatest areas of difference in perceived impor-tance centre on the following two risk factors:
•
changing scope/objectives;•
improper definition of roles and responsibilities.Project managers ascribe a higher level of importance to the first of these risk factors than do users. This may indicate that users have a tendency to underestimate the dangers asso-ciated with changing scope/objectives. With respect to the second factor, it would appear that Figure 3.Risk factors ranked by both users and managers, ordered by perceived relative importance.
users ascribe a higher level of importance than project mangers to the risk associated with improper definition of roles and responsibilities.
Areas of disagreement on risk
In addition to the zone of concordance discussed earlier, Figure 2 reveals that there were some areas of disagreement among users and project mangers. Specifically, Figure 2 reveals that the users ranked six risk factors {A, D, E, G, K and M} that were not judged to be impor-tant enough to be ranked by the US project managers. Closer examination reveals that five of these six risk factors {A, D, E, G and M} relate to aspects of project management that users would not have primary responsibility for, but which would be the under the purview of the project manager. This suggests that the users may have a tendency to view risk as flowing from the project manager and his/her abilities. Interestingly, these are risk factors over which the user has limited control, a finding that appears to be consistent with an observa-tion made by Schmidt et al. (2001). Conversely, when one examines the risk factors ranked by project managers, but not judged to be important enough to be ranked by the users, it would appear that the project managers have a tendency to view risk as flowing from the user. This is particularly evident in the project managers’ ranking of certain risk factors (e.g. N, P, T, V and W).
The above observations suggest that users may tend to focus on the importance of certain risks associated with project management capabilities and skills, whereas project managers may tend to focus on the importance of certain risks associated with the user (e.g. user com-mitment and scope creep). In both cases (whether viewed from the user or the project manager perspective), there seems to be a tendency to view risks over which one has limited control as being important.
C O N C LU S I O N S A N D I M P L I C AT I O N S
This study highlights similarities and differences in the perceptions of project managers and users as to the importance of various IT project risks. Through a Delphi study administered over the World Wide Web, we collected and analysed data from a panel of users, comparing our findings with those of a previous study that had considered only project managers. We subsequently identified the zone of concordance – containing risk factors over which there is agreement between the two stakeholder groups – as well as zones of discordance repre-senting risk factors that were ranked as important by the users but not by the project man-agers (or vice versa). The mapping of these zones provides a basis for more thorough analysis of risk in IT projects.
In our analysis, we identified seven risk factors that both users and project managers agree are important. However, of the 13 risks ranked by the user group, only seven were judged to be important enough to be ranked by the US project managers. Moreover, four of the top five risks ranked by the US project managers were not judged to be important enough to be ranked
by the users. These results indicate that, although there are some similarities in the percep-tions of users and project managers, there are also many differences. The results of the study provide evidence that different stakeholders can and do have different perceptions regarding project risk. If users and developers have different perceptions of project risk factors, there may be an increased potential for conflicts to arise.
Implications for research
Although previous research (Keil et al., 1998; Schmidt et al., 2001) has focused on the risks that are important to software project managers, users’ risk perceptions have not been examined. By documenting users’ risk perceptions, this study adds to the body of existing knowledge on IT project risk. As an important stakeholder group, the users’ perception as to what constitutes IT project risk may yield important insights into addressing and consequently mitigating these risks. Further research is needed both to validate these findings and to inves-tigate more deeply the underlying reasons for the differences that were observed.
Although important, users represent only one group of stakeholders. It would be interest-ing to extend this line of enquiry by examininterest-ing the risk perceptions of other stakeholders (e.g. senior managers) and comparing them with the risk perceptions of users and project managers. Also of interest would be to interpret our findings using the theoretical lens of actor–observer bias (Kelly, 1980), in which individuals (e.g. project managers) place greater emphasis on the role of situational factors to explain their own behaviour, and stronger empha-sis on dispositional qualities when accounting for similar behaviour in others.
From a methodological perspective, one contribution of this study was demonstrating that Delphi research (which has previously been conducted either synchronously in face-to-face meetings or asynchronously by mail surveys) can be done asynchronously using the Internet and World Wide Web, thereby speeding up the process while reducing the cost of administering the study. A side benefit of this approach is that panellists can receive feed-back in a more timely fashion relative to using direct mail. Asynchronous Delphi studies, however, represent a trade-off in that, although it makes it easier to conduct the study (i.e. because there is no need to negotiate schedules such that everyone can meet simultane-ously), it also removes the pressure that face-to-face contact can have in driving individual participation.
In our particular study, we experienced a drop-off in terms of both response and consen-sus as we attempted to conduct additional rounds, which may represent a limitation of our approach. We suspect that part of this can be explained by the choice of an asynchronous approach to data collection. However, we note that other studies (e.g. Schmidt et al., 2001) did not seem to suffer these effects to the same degree. One explanation for this may lie in the level of commitment of the subjects to both the topic being studied and the Delphi process. In the case of Schmidt et al. (2001), the panellists were project managers and may have per-ceived the results of the study to be of greater value to them. We therefore offer the follow-ing recommendations to researchers considerfollow-ing the Delphi approach. Panellists should be prescreened to ensure that: (1) they have a complete understanding of the Delphi process;
Alter, S. & Ginzberg, M. (1978) Managing uncertainty in MIS implementation. Sloan Management Review, 20, 23–31.
Barki, H., Rivard, S. & Talbot, J. (1993) Toward an assess-ment of software developassess-ment risk.Journal of Manage-ment Information Systems,10, 203–225.
Boehm, B. (1991) Software risk management: principles and practices.IEEE Software,8, 32–41.
Boehm, B. & Ross, R. (1989) Theory W software project management: principles and examples.IEEE Transac-tions on Software Engineering,15, 902–916.
Brancheau, J.C., Janz, B.D. & Wetherbe, J.C. (1996) Key issues in information systems management:
1994–95 SIM Delphi results. MIS Quarterly, 20, 225–242.
Brancheau, J.C. & Wetherbe, J.C. (1987) Key issues in information systems management.MIS Quarterly,11, 23–45.
Charette, R. (1989) Software Engineering Risk Analysis and Management. McGraw-Hill, New York.
Dalkey, N.C. (1969) The Delphi Method: an Experimental Study of Group Opinion(RMM-588-PR). Rand Corpo-ration, Santa Monica, CA.
Dalkey, N.C. & Helmer, O. (1963) An experimental application of the Delphi method: the use of experts. Management Science,9, 458–467.
(2) they have a significant interest in the subject of the Delphi and can see how the results might be useful to them; and (3) their commitment to the process is high.
Implications for practice
In this research, our focus was on exploring similarities and differences in how two key stake-holders – project managers and users – perceive certain project risk factors. To manage risk in IT projects effectively, both project managers and users must understand and be able to identify the risks involved. By mapping the similarities and differences in what users and project managers judge to be important risks, we have provided practitioners with a more integrative risk framework that encompasses both the project manager and the user perspective.
Users are a significant stakeholder group in IT projects and, as they bring a different view-point regarding IT project risk, it is important to understand their perspective. Incorporation of the user perspective on risk is significant because focusing solely on project managers’ perceptions may result in some risk factors receiving a lower level of attention than they might deserve. To mitigate project risk, it is necessary to consider all risk factors judged to be important by both groups and then reconcile differences through dialogue, deliberation and communication.
Closer examination of the risk factors ranked as important by users, but not by project man-agers, suggests that the users may have a tendency to view risk as flowing from the project manager and his/her abilities. Conversely, when one examines the risk factors selected by project managers, but not selected by users, it would appear that the project managers might have a tendency to view risk as flowing from the user. This work represents an important first step towards further discussion and understanding of the differing perceptions of project man-agers and users as well as of ways to manage these different viewpoints. An understanding of both stakeholder perspectives should lead to a more comprehensive approach towards managing the risks associated with IT projects.
De Brabander, B. & Thiers, G. (1984) Successful informa-tion system development in relainforma-tion to situainforma-tional factors which affect effective communication between MIS-users and EDP-specialists.Management Science,30, 137–155.
Drummond, H. (1996) Escalation in Decision-Making: the Tragedy of Taurus. Oxford University Press, Oxford. Ginzberg, M.J. (1981) Early diagnosis of MIS
implemen-tation failure: promising results and unanswered ques-tions.Management Science,27, 459–478.
Grey, S. (1995) Practical Risk Assessment for Project Management. John Wiley and Sons, Chichester, UK. Grudin, J. (1991) Interactive systems: bridging the gaps
between developers and users. IEEE Computer, 24 (April), 49–69.
Iivari, J., Hirschheim, R. & Klein, H.K. (1998) A paradig-matic analysis contrasting information systems develop-ment approaches and methodologies. Information Systems Research,92, 164–193.
Johnson, J. (2000) Turning chaos into success.Software Magazine,19, 30–39.
Keil, M. & Carmel, E. (1995) Customer–developer links in software development.Communications of the ACM,37, 33–44.
Keil, M., Cule, P.E., Lyytinen, K. & Schmidt, R.C. (1998) A framework for identifying software project risks. Communications of the ACM,41, 76–83.
Kelly, H. (1980) Attribution theory and research.Annual Review of Psychology,31, 457–501.
Kirsch, L.J. (1996) The management of complex tasks in organizations: controlling the systems development process.Organization Science,7, 1–21.
Kotter, J. (1996) Leading Change. Harvard Business School Press, Boston, MA.
Lindstone, H. & Turoff, M. (1975) Introduction. In: The Delphi Method: Techniques and Applications, Lindstone, H. & Turoff, M. (eds), pp. 6–16. Addison-Wesley, Reading, MA.
Lyytinen, K. (1988) Expectation failure concept and system analysts’ view of information system failures: results of an exploratory study.Information and Management,14, 45–56.
Lyytinen, K. & Hirschheim, R. (1987) Information systems failures – a survey and classification of the empirical lit-erature. In:Oxford Surveys in Information Technology, Vol. 4, Zorkoczy, P.I. (ed.), pp. 257–309. Oxford Univer-sity Press, Oxford.
McFarlan, F.W. (1981) Portfolio approach to information systems.Harvard Business Review,59, 142–150. McLellan, K. & Marcolin, B. (1994) Information technology
outsourcing.Business Quarterly,59, 95–104.
Markus, M.L. (1983) Power, politics, and MIS implementa-tion.Communications of the ACM,26, 430–444. Orr, A. (1999) One quarter of online purchases fail.ZDNet
News Online, December 20.
Ramesh, B. & Dhar, V. (1992) Supporting systems devel-opment using knowledge captured during requirements engineering.IEEE Transactions on Software Engineer-ing,18, 498–510.
Ramesh, B. & Tiwana, A. (1999) Supporting collaborative process knowledge management in new product devel-opment teams.Decision Support Systems,27, 213–235. Schmidt, R.C. (1997) Managing Delphi surveys using non-parametric statistical techniques.Decision Sciences,28, 763–774.
Schmidt, R., Lyytinen, K., Keil, M. & Cule, P. (2001) Iden-tifying software project risks: an international Delphi study.Journal of Management Information Systems,17, 5–36.
Taylor, R.E. & Meinhardt, D.J. (1985) Defining computer information needs for small business: a Delphi method. Journal of Small Business Management,23, 3–9. Tiwana, A. (2000) The Knowledge Management Toolkit:
Techniques for Building a Knowledge Management System. Prentice Hall, Upper Saddle River, NJ. Turoff, M. & Hiltz, S.R. (1996) Computer-based Delphi
Processes. In: Gazing Into the Oracle: the Delphi Method and its Application to Social Policy and Public Health, Adler, M. & Ziglio, E. (eds), p. 252. Kingsley Publishers, London.
Watson, H. & Haley, B. (1997) Data warehousing: a framework and survey of practices. Journal of Data Warehousing,2, 10–17.
White, K.B. & Leifer, R. (1986) Information systems development success: perspectives from project team participants.MIS Quarterly,10, 214–224.
Biographies
Mark Keilis an Associate Professor of Computer Infor-mation Systems (CIS) in the Robinson College of Busi-ness at Georgia State University. His research focuses on software project management and his work has appeared in MIS Quarterly, Sloan Management Review,Journal of Management Information Systems, and many other jour-nals. He earned his bachelor’s degree from Princeton Uni-versity, his master’s degree from MIT’s Sloan School of Management, and his doctorate in management informa-tion systems from the Harvard Business School.
Amrit Tiwanais Assistant Professor of Decision and Information Analysis in the Goizueta Business School at
Emory University. His work has appeared or is forth-coming in Communications of the AMC, Decision Support Systems,IEEE Internet Computing, Journal of Knowledge Management,Journal of Retailing and Consumer Ser-vices, Journal of the American Society for Information Science and Technology,and American Programmer. His research focuses on knowledge integration in software project teams.
Ashley Bushis an Assistant Professor of Management Information Systems at Florida State University. She has published or has work forthcoming inInformation and Organization,Journal of Knowledge Management, Infor-mation Systems Journal, and several national and inter-national conferences. Her research focuses on e-business strategy and the impacts of the Internet on coordination in distributed supply chains.