Into the Allocation Puzzle –
A Sectoral Analysis
Dennis Reinhardt
Working Paper 10.02
This discussion paper series represents research work-in-progress and is distributed with the intention to foster
discussion. The views herein solely represent those of the authors. No research paper in this series implies
agreement by the Study Center Gerzensee and the Swiss National Bank, nor does it imply the policy views, nor
potential policy of those institutions.
Into the Allocation Puzzle
-A Sectoral -Analysis
Dennis Reinhardt
∗October, 2010
Abstract
This paper assesses whether the allocation puzzle - the tendency for capital to flow to countries with relatively low productivity growth - is observed for foreign direct investment (FDI) flows, which should be particularly sensitive to productivity prospects. We look both at aggregate FDI flows and, using a new data set, at FDI flows into the main economic sectors. We make three points. First, we do not find evidence of an allocation puzzle for aggregate FDI flows. Second, we refine the aggregate result and document substantial sectoral heterogeneity. An allocation puzzle is observed in the agriculture, construction, mining/petroleum/utilities, and tourism sector. By contrast, we show that countries with faster productivity growth in manufacturing attract more FDI in that sector. The link is even stronger for service sectors. Third, we document a role for financial openness: a country with fast productivity growth draws in more FDI into its service sectors only when it is financially open. We conclude with a discussion of some tentative explanations for the results.
JEL Classification: F21, F41, O1
Keywords: Allocation Puzzle, Sectoral Level, Foreign Direct Investment
∗Graduate Institute of International and Development Studies, Avenue de la Paix 11A, CH-1202 Geneva
(dennis.reinhardt@graduateinstitute) and Study Center Gerzensee, Dorfstrasse 2, CH-3115 Gerzensee ([email protected]). I thank David M. Arseneau, Marcos Chamon, Roland Hodler, Jun Il Kim, Dirk Niepelt, Ugo Panizza and C´edric Tille, and participants at the IHEID’s Brown Bag Seminar as well as the Study Center Gerzensee’s Brown Bag Seminar for their valuable comments and suggestions.
1
Introduction
Do countries with stronger productivity growth attract more capital inflows? According to the neoclassical growth model (Ramsey-Cass-Koopmans) the answer is yes: strong productiv-ity growth increases the marginal product of capital, which makes investing domestically more profitable; it also increases future incomes, which raises current consumption through the con-sumption smoothing effect. It follows that capital inflows and productivity growth should be positively related. Gourinchas and Jeanne (2009) challenge this prediction by showing that de-veloping countries and emerging markets with faster productivity growth attract less capital inflows. They call this observation the allocation puzzle.
In scrutinizing the allocation puzzle, we make three contributions. First, we refine the result for total capital inflows (measured, using data on current account deficits) by disaggregating them into their different components. We show in a cross-section of countries that the correla-tion between net capital inflows and productivity growth is positive only for net FDI inflows; the correlation is negative for net inflows of portfolio equity, debt, and other investment. Further-more, we find that countries with stronger productivity growth accumulate significantly more reserve assets; this is an important driver of the allocation puzzle.
Second, we refine the aggregate result for FDI inflows and document substantial sectoral heterogeneity. Using a new data set of FDI inflows by sector for 72 emerging market economies and developing countries, we establish a new set of allocation puzzles for FDI inflows into some important sectors of the economy. Specifically, in a cross-section of countries’ agriculture, con-struction, tourism and mining/utility sectors, sectors with stronger productivity growth received less capital inflows.1 The sector-level allocation puzzles constitute an even starker violation of the neoclassical growth model than the allocation puzzle for total capital flows as they are ob-served for FDI inflows, which should comply strongly with the model’s predictions. By contrast, we show that countries with faster productivity growth in manufacturing attract more foreign investment in that sector. The link is even stronger for most of the service sectors: FDI inflows and productivity growth are tightly linked in the business and finance, trade, and transport, storage and communication sector.
Third, we show that financial openness plays an important role in the relation between FDI inflows and productivity growth: a country with fast productivity growth draws in more FDI into its service sectors the higher its degree of financial openness. Financial openness does not play a role for the other sectors of the economy. We focus on financial openness because it is an underlying assumption of the open-economy neoclassical model; a certain degree of financial openness is required for capital to flow according to its predictions. If countries/sectors were financially closed, it would come as no surprise if (sectoral) capital inflows were not linked to (sectoral) productivity development; a ”failure” of the neoclassical model would then be driven by a violation of the underlying assumption of financial openness and not by flaws in its other key mechanisms.
1Note that mining and quarrying (Sector C according to the ISIC Rev.3.1 classification) includes the petroleum
We offer some thoughts on potential explanations for the sector-level results focusing on the role of resource endowment and on how the tradability of the final good, transport costs, and a fixed cost of observing productivity development can cause productivitiy to play a bigger role in the investment decisions of service sector investors than of manufacturing sector investors. No attempt is made to explore the different explanations theoretically or to empirically discriminate between them.
The paper proceeds as follows. Section 2 discusses the literature. Section 3 presents the theoretical framework underlying the empirical analysis. Section 4 describes the data. Section 5 scrutinizes the allocation puzzle on the level of the aggregate economy. In Section 6, FDI flows are disaggregated to the sectoral level. Section 7 discusses some tentative explanations for the results, and section 8 concludes.
2
Literature
This paper relates to the literature on the role of financial openness and the determinants of capital flows, and their impact on economic development. Through establishing the allocation puzzle, Gourinchas and Jeanne (2009) cast doubt on the complementarity between foreign capital and economic growth. In doing so, they offer a conclusion similar to Aizenman et al. (2007) and Prasad et al. (2007), who find that developing countries that rely less on foreign finance grow faster. This establishes a positive relation between domestic savings and growth, which links these papers to the literature on savings, growth and investment and their interrelations (Feldstein and Horioka ,1980; Carroll and Weil, 1994). Rodrik and Subramanian (2008) argue that capital inflows only have a positive effect in saving-constrained economies; in investment-constrained economies foreign savings have less beneficial effects as they mainly drive up the real effective exchange rate (RER), which reduces the competitiveness of tradables and is bad for growth (Rodrik (2008) provides evidence that an overvalued RER reduces growth). With regard to this literature, we show that the complementarity between foreign finance and growth depends on the type of capital flows, with the complementarity being strongest for FDI inflows. This weakens the allocation puzzle. However, we establish a new set of sector-level allocation puzzles for FDI inflows, which adds to the doubts on the positive complementarity between capital inflows and growth.
With regard to the role of financial openness, Kalemli-Ozcan et al. (2008) suggest - based on the observation that the standard model explains interstate capital flows within the US well (where there are no restrictions on capital flows) - that frictions associated with national borders may explain the failure of the neoclassical model; in showing that capital flows into high-growth service sectors only when they are financially open, we arrive at a similar result.
This paper relates also to the growth accounting literature. Hall and Jones (1999) and Caselli (2004) document the importance of total factor productivity (TFP) as the main source of cross-country income differences and, consequently, the importance of TFP growth for economic convergence. Caselli and Feyrer (2007) demonstrate that the marginal product of capital (MPK) is quite similar for advanced and developing countries once properly measuring the share of income accruing to physical capital. Chirinko and Mallick (2008) argue however that, when
adjustment costs are taken into account and parameterized, the MPK remains higher in poor countries. Similar to Gourinchas and Jeanne (2009), we do not focus directly on the MPK, but instead on underlying productivity growth as a determinant of capital flows.
The literature offers several potential explanations for the allocation puzzle. One strand fo-cuses on the role of aggregate and idiosyncratic risk. With regard to aggregate risk, it is often emphasized that high saving rates in Asian emerging markets are a reflection of precautionary re-serves built up to insure against aggregate risks. With regard to idiosyncratic risks, Chamon and Prasad (2008) explain China’s rising household savings through increases in idiosyncratic risks associated with the transition to a market economy. Benhima (2009) finds that the allocation puzzle can be explained through introducing idiosyncratic investment risk in the neoclassical growth model (similarly, Sandri (2009) and Carroll and Jeanne (2008)). Aguiar and Amador (2009) focus on political factors and foreign debt: in a model featuring political economy fric-tions and a lack of commitment regarding foreign debt, they show that the allocation puzzle can be rationalized, as capital will not be invested in an economy with high debt due to the risk of expropriation; hence, governments have an incentive to pay down debt along a high-growth transition path. Further studies focus on the role of domestic financial development. Buera and Shin (2010) demonstrate that capital outflows and high TFP growth go hand in hand in a situation where the government introduces widespread reforms that open up the capital account and remove domestic distortions, but leave financial market distortions in place. The reforms increase TFP growth; entrepreneurs, faced with financial distortions, send their savings abroad to self finance their future investments. Similarly, Caballero, Farhi and Gourinchas (2008) show that, in the absence of a reliable store of value, financially underdeveloped countries have to export capital when they grow fast.
By taking a sectoral perspective, this paper offers a so far unexplored avenue of analyzing the (aggregate) allocation puzzle. Explanations for the sector-level results (resource endowment, trade and production related factors) can potentially inform studies that aim at explaining the aggregate allocation puzzle established by Gourinchas and Jeanne (2009). Furthermore, the sectoral analysis indicates that the sectoral composition of economies is an important factor for understanding the aggregate allocation puzzle.
3
Conceptual Issues
3.1
A simple neoclassical framework
We illustrate that capital flows and productivity growth should be positively related in a simple neoclassical framework.2 The following classical production function is assumed:
Yt=Ktα(AtLt)
1−α
(1) 2The framework yields similar implications with regard to the relation between productivity and capital flows
as the small open economy model built by Gourinchas and Jeanne (2009). Their model is richer and includes a convergence, initial debt, savings, and investment channel through which debt, the initial capital stock and productivity growth impact capital inflows. Here, we focus on the investment channel; the savings channel captures the saving decision of households rather than the investment/saving decision of firms. We show that the investment channel can be derived with a small set of assumption within a simple neoclassical framework.
whereKtis the stock of domestic physical capital,Ltthe supply of labour,αthe capital share, andAt the productivity level.
Consider N countries (indexed by c) with technology given by (1), identical capital shares (i.e. α=α1=α2=...=αN), and a constant labour force normalized to 1 (L1,t =L2,t=...= LN,t = 1).3 Assuming a sufficient degree of financial openness, so that capital can flow across borders without significant transaction costs,4the marginal products of capital are equal:
αA11−,tα(K1,t) α−1 =αA12−,tα(K2,t) α−1 =...=αA1N,t−α(KN,t) α−1 (2) This implies that the relative capital stock per capita between any two countries is equal to the relative TFP level: ∀c: ln K c,t K1,t = ln A c,t A1,t
It follows that for all countries (c) the percent change of the capital stock equals the percent change of TFP plus a term that refers to some reference countryc= 1:
∀c: ∆kc= ∆ac+ϕ (3)
where lower letters denote logs andϕ= ∆k1−∆a1. If a country experiences stronger productivity growth than another country, it will experience a relatively stronger increase in its capital stock.5 For simplicity suppose that the link between capital inflows and ∆kc is linear. Specifically, that capital inflows (scaled by initial Y) are a linear function of the percent change in the capital stock:
∀c: Inflowsc,t1−t0
Yc,t0
=a+b∆kc (4)
where we assumebto be positive and the same across countries. A country receives more capital inflows (scaled by its size) the larger the percent increase in its capital stock.6
This motivates the following (cross-sectional) regression equation on which (or variations of 3We show the effect of allowing the capital share and the labour force to vary across countries below. 4A bold assumption; i.e. a typical RBC model relies on sufficient adjustment costs to fit the data. 5If we allow capital shares to vary across countries the equation becomes ∆k
c−11−−αα2
1∆k1= ∆ac− 1−α2 1−α1∆a1.
Estimates by Gollin (2002) suggest that the capital share is roughly constant within countries and varies between 0.2 and 0.35 across countries. This implies that the maximum value for 1−α2
1−α1 is 1.23 ( 0.8
0.65) (if we assume
country 1 to have the higher capital share). To assess the potential bias, assume that both countries display a productivity growth rate of 1% and that the capital stock of country 2 remains unchanged; then the condition would imply that the capital stock of country 1 decreases by 0.23 percent (despite equal productivity growth rates across the two countries). However, we argue that our theoretical prediction is robust to differences in the capital share across countries for two reasons. First, the differences in capital share are generally much lower than the maximum difference of 0.15 (see Gollin (2002)); the bias term is accordingly much lower than 1.23 for most country-pairs. Second, in the empirical section, we analyze the link between capital flows and productivity growth across countries for a long time period. Hence, the differences in productivity growth across countries are generally very large (up to 300 percentage points). It follows that the differences in capital shares are too small to change the direction of the theoretical prediction.
6A special case of this assumption would be to assume that the world capital stock is fixed (i.e. K = K1+K2 +...+KN), which would imply a one to one (b∗ = 1) link between capital inflows (scaled by the initial capital stock) and the growth in the capital stock. Hence, if we assume a capital to output ratio of 3,bis
1
3 for this special case (In the general case,bis between 0 and 1 3).
which) we will base our empirical analysis: Inflowsc,t1−t0
Yc,t0
=α+β∆ac+εc (5)
where α=a+bϕ andβ =b in case the theoretical prediction would hold exactly in the data. The theoretical prediction is that β is positive - i.e. stronger productivity growth is associated with stronger capital inflows. Note that the theoretical prediction remains the same if we allow the labour force to vary.7 Furthermore, substituting labour productivity growth for TFP growth (as we do in the sectoral analysis) does also not change the theoretical prediction: ∆yc−∆lc can be written as ∆ac+αϕ using the production function (1) and equation (3).8
In terms of terminology, we refer to a negative statistically significant relation between capital inflows and productivity growth as a “strong” allocation puzzle; a non-significant relation between capital inflows and productivity development - which implies that the coefficient is statistically speaking zero - is called a “weak” allocation puzzle. Note that the theoretical prediction is derived under the assumption of financial openness. If capital is not allowed to flow freely, the prediction does not hold; we hence expectβ = 0 for fully closed countries.
The theoretical prediction holds without further assumptions when extending the framework to the sectoral level. Importantly, we do not need to assume that all capital is sector-specific and that sectors are independent units. First, technological spillovers between sectors - though entirely possible - do not change the prediction that capital flows are driven by underlying productivity trends (which may or may not be influenced by spillovers). Second, because equation (2) holds across all countries and sectors, it is not essential for the theoretical prediction whether all capital is sector-specific: whereas the share of capital that is not sector-specific will be simply drawn into the highest-growth sectors (across all different sectors and countries), it remains the case for one specific sector that low-growth sectors across countries receive fewer inflows than high-growth sectors. The crucial assumption for this to be true is that equation (4) holds for every sector. We believe this to be the case, because FDI is by its nature a direct capital flow - i.e. inflows of FDI into the manufacturing sector should be positively associated with an increase of the capital stock in the manufacturing sector; this is especially true for greenfield investments.9
3.2
Interpretation of regression coefficients
In the empirical analysis, we do not aim to give the coefficient β (see equation (5)) a causal interpretation. Note that Gourinchas and Jeanne’s (2009) interpretation of the allocation puzzle, as countries with faster productivity growth attracting relatively less capital inflows (rather than capital not having a positive effect on productivity growth), is based on the standard neoclassical model’s assumption that technological progress follows an exogenous process; this
7Equation (5) writes in this case: Inflowsc,t1−t0
Yc,t0 =α+β1∆ac+β2∆lcwithβ1=β2=band α=a+bϕin
case the theoretical prediction holds exactly in the data.
8It can be shown that this holds both for a constant and variable labour force. Intuitively, this is due to the
fact that the equalization of marginal products determines the link between the capital stock, TFP and the labour force.
9It is, however, conceivable that the domestic banking system intermediates a share of the FDI inflows
implicitly assumes that the causality goes from productivity to capital flows. They do not attempt to discriminate between the two possibilities in the data - neither does the evidence we present. Empirically speaking, we interpret the allocation puzzle hence broadly, as a missing complementarity between foreign finance and productivity growth. Our regression coefficients should therefore be interpreted accordingly, as capturing this complementarity.
However, it is interesting to consult the literature to assess which side of the complementarity is likely to be more important. For overall inflows, the evidence seems to support Gourinchas and Jeanne (2009)’s interpretation because empirical studies could not establish a convincing positive effect of net capital inflows on (per capita) growth (Prasad et al., 2007; Kose et al., 2006).
This is, however, less clear for FDI: if the effect of FDI inflows on productivity growth is stronger than for other types of capital inflows, positive and significant regression coefficients could be either interpreted as capturing the productivity impacts of FDI inflows or as the pull effect of productivity growth on FDI inflows. What interpretation should we believe in; i.e. does FDI cause growth? The answer is not clear-cut. In a recent survey of the literature, Kose et al. (2006) summarize the major findings as follows: although earlier studies have found mixed results, recent studies using more sophisticated methodologies and micro-level data sets, have been more successful in finding favorable evidence of the benefits from FDI.10Herzer et al. (2008) find in a sample of 28 developing countries, using cointegration techniques, that there is neither a long-term nor a short-term effect of FDI on growth. According to Aykut and Sayek (2007) one should note with regard to studies on the macro level that they only identify a positive growth effect of FDI in combination with other factors (such as endowment with human capital (Borensztein et al., 1998), trade openness (Balasubramanyam et al., 1996) and domestic financial market development (Alfaro et al., 2004)). But also this is not without criticism: Rodrik (1999) and Carkovic and Levine (2003) argue that the effect of FDI on growth is weak11 and that most of the studies showing an effect of FDI based on initial conditions suffer from reverse causality (which emphasizes causality from productivity to capital flows). Aykut and Sayek (2007) show that the sectoral composition of FDI flows matters. If flows get skewed towards the manufacturing sector, there are more positive spillovers to the rest of the economy and the effect on growth is positive. Overall the results for macro data appear inconclusive, but seem to favour the ”pull” interpretation of our coefficients - i.e. productivity growth pulling in FDI flows.
It is even more important for the present study to have a look at results from more disag-gregated studies focusing on the sectoral level: a differential impact of sectoral FDI on sectoral productivity growth across sectors can impact the results and their interpretation as the degree of endogeneity would vary across sectors. Furthermore, evidence of the impact of sectoral FDI on the productivity growth rates of other sectors should be taken into account. With regard to productivity spillovers from foreign firms to domestic firms in the same sector, the evidence is again inconclusive with various studies finding a positive effect and other studies only a very small effect (Kose et al., 2006). G¨org and Greenaway (2004) argue that those studies (using
10See Lipsey (2004) and Moran (2005) for further literature surveys.
11Carkovic and Levine (2003) use a dynamic GMM specification to account for endogeneity and claim that the
cross section data) cannot establish causality because of reverse causality: for example (borrow-ing their argument), if productivity in the oil sector is higher than in the food sector, foreign companies may be attracted to the former. The results of a cross-sectional study would then be biased in favor of a positive impact of FDI on productivity. Furthermore, Kose et al. (2006) give a potentially important reason for the weak results on horizontal spillovers: foreign firms might try to protect their firm-specific advantages.
Overall, the results for the sectoral level are inconclusive, but seem to, again, favour the assumption of our underlying model - i.e. that causality runs from productivity growth to FDI inflows.12
4
Data
For the aggregate-level analysis, we construct a dataset containing information on capital flows, TFP and various control variables for 95 emerging markets and developing countries (referred to as the full sample)13 over the two periods 1980-2007 and 1990-2007. For the sector-level analysis, we construct two datasets containing sector-level data on (log) FDI inflows, employment and value added for 72 emerging markets and developing countries over the (maximum) period 1990-2008 for 3 and 7 sectors.14
We perform the following preliminary screens on the data. First, we exclude observations for the sectoral data set for which our measure of FDI inflows or productivity development deviates by more than 4 standard deviations from the sample mean. This makes sure that no extreme observation has an undue impact on the results. Second, we exclude sectors that both have a value-added below USD 100 million and a share in total value-added that is below 1 percent, in order to focus on sectors that play a significant role in the respective countries.15 Third, for both the dataset used in the aggregate-level analysis and the sectoral analysis, we exclude observations for which we have less than 4 years of data for capital inflows and productivity development.
Summary statistics are provided in table A1 and A2. This section provides a brief description of the key variables and discusses important data issues; further details and data sources are provided in Appendix A; an overview on the sample coverage can be found in Appendix B.
4.1
Capital Flows
Aggregate-level data on the different types of capital flows is taken from the IMF’s International Financial Statistics (IFS). We measure total net capital inflows using data on current account deficits. This treats errors and omissions as unreported capital inflows and includes changes in 12However, vertical productivity spillovers might play an important role and will be harder to deal with: Javorcik
(2004) finds that a 10 percent increase in the foreign presence in downstream sectors is associated with a 0.38 percent increase in output of firms in the supplying industry. If those vertical linkages are across sectors and if they are quantitatively important one should control for their effect.
13We exclude all high-income countries (based on the income classification from the World Bank) except for
Taiwan, Singapore, Hong Kong, Israel and the Republic of Korea.
14Sectors are classified according to ISIC Rev. 3.1. See Appendix A1 for an overview on the sectoral composition
of the two data sets. Using a different data source on sectoral value-added, we further disaggregate three of the seven sectors.
15This exclusion is of practical relevance only for the agriculture and the mining sector (C), which are very
reserves assets. Furthermore, we look at the different components of the current account and use data from the balance of payment on net inflows of FDI, net portfolio equity, net portfolio debt, net other investment, and reserve assets.16 To distinguish official from private capital flows, we derive three alternative measures of total net inflows through subtracting from total net capital inflows (1) the net decrease in reserve assets, (2) aid inflows and (3) both the net decrease in reserve assets and aid inflows. Neglecting potentially important official elements of portfolio debt flows, we refer to the third measure as net “private” inflows. Gross FDI Inflows, defined as inward net flows in the reporting country by non-residents, are also taken from IFS.
Sectoral FDI inflows stem from several sources including UNCTAD, International Trade Cen-ter (ITC), ASEAN, OECD, and various country sources (see Appendix A for more details on the data sources and Appendix B for an overview of the sample).
The capital flows series are divided by a deflator and the price of investment goods given in the 6.3 PENN World tables (PWT 6.3, Heston et. al (2006)), to get a measure of real flows in purchasing power parity (PPP).17Following the model presented in section 2.1., this measure is first summed up over all available years and then scaled by the initial output/value-added of the respective country/sector - where initial output is taken from PWT 6.3 (Real GDP per capita (Constant Prices: Chain Series)) and value-added from the United Nations Statistics Division.18 Table A2 presents summary statistics both for gross FDI inflows in millions of current USD and for FDI inflows (in PPP) as a fraction of initial value added. In terms of current USD, the business and finance sector (In ISIC Rev. 3.1.: Sectors J and K) received, on average, most FDI inflows followed by the manufacturing sector (D). Average FDI flows into the mining sector (C), the transport, storage and communication (I) sector and the trade sector (G) are also sizeable. Flows to agriculture (AB), utilities (E), construction (F) and tourism (H) are, on average, smaller. However, there is sizable cross-country variation in the amount of FDI flows received for all the sectors. In percent of value added, mining and utilities, transport storage and communication as well as the finance and business sector received, on average, more FDI than the manufacturing sector, whereas the agriculture sector received about 10 times less and the construction sector 3 times less FDI.
It is instructive to compare total FDI inflows from the sectoral sample with total FDI inflows from IFS. Ideally, the match should be one to one; and the differences are indeed small: the correlation between IFS FDI Inflows (scaled by initial GDP) and FDI Inflows from our data set is 91%. The correlation falls to 70% when including outflows (hence, using net FDI from IFS instead of gross FDI inflows); a drop that is driven by big outflows for Hong Kong and Korea. Differences to the aggregate IFS data have several reasons: subsequent updates of the data (incorporated in IFS but not in older sectoral data sets), different data issuers, differences between approved and realized FDI, the lack of sectoral outflows data, and finally to the fact that for some countries FDI inflows had to be backed out from stock data (where valuation effects might play a role).
16All variables are defined such that a positive sign corresponds to a net inflow; a positive sign for reserve assets
corresponds hence to a decrease in reserve assets (capital inflow).
17The results are robust to using the price of output instead.
4.2
Productivity
For the aggregate analysis, we construct TFP (At) with the perpetual inventory method using data from PWT 6.3 on investment and output together with the production function (1) - details are given in Appendix A3. In order to focus on long-run trends, the TFP series is smoothed by applying an HP filter with a high smoothing parameter.19
With regard to sectoral productivity development, we rely on labour productivity, which is calculated as the ratio of value added to the number of workers in the respective sector, as a proxy for TFP growth (due to missing data on the capital stock for the different sectors). As we showed before, the change of labour productivity equals the change of TFP growth in a simple neoclassical framework. It is however useful for assessing the results of the empirical analysis to examine the link between TFP and labour productivity more carefully.
Using the production function (1), labour productivity Y
L can be written as a function of TFP (At) and capital deepening KL:
Yt Lt =A1t−α K t Lt (1 −α)α 1−α
Changes in labour productivity are only partly driven by changes in TFP. The conclusion with regard to the relative strength of the allocation puzzle across sectors is, however, independent of whether it is based on labour productivity growth or TFP growth, as long as the relative importance of capital deepening is similar for, say, the mining sectors in Brazil and Russia; the fact, that the importance of capital deepening is likely to differ between, for example, the finance and mining sector, does not change the ranking of sectors with respect to the presence or non-presence of sectoral allocation puzzles: within each sector the theoretical prediction (equation (5)) remains that the country which displays the strongest increase in TFP should receive the largest amount of FDI inflows.
Furthermore, we observe that TFP and labour productivity move largely in line when looking at aggregate data: the correlation coefficient between TFP growth and growth in real GDP per capita (rgdpch from PWT 6.3) is 79% for 1990-2007 using the sectoral sample (82% for the full sample (from 1980-2007)).
4.3
Financial openness
Our main measure of capital account openness is the index of capital account liberalization constructed by Quinn (1997, updated to 2006). This is a de jure index measuring capital ac-count restrictions. It is normalized between 0 and 1 (representing fully closed and fully open regime, respectively) and is constructed from information contained in the IMFs Annual Report on Exchange Arrangement and Exchange Restrictions (AREAER). An alternative measure is taken from Schindler (2009) and captures restrictions on FDI inflows. Although the measure is 19Specifically,λis set to 27.2, so that the gain of the filter is equal to 70 % at the frequency corresponding to
conceptually more relevant, we focus on the Quinn index as its sample coverage is bigger.20
5
The Allocation Puzzle - Aggregate Level
We estimate the following equation:
N etInf lowsc=αc+γ1T F P Growthc+βXc+εc
whereT F P Growthis the ratio of the change in TFP to TFP in the first year of available data.
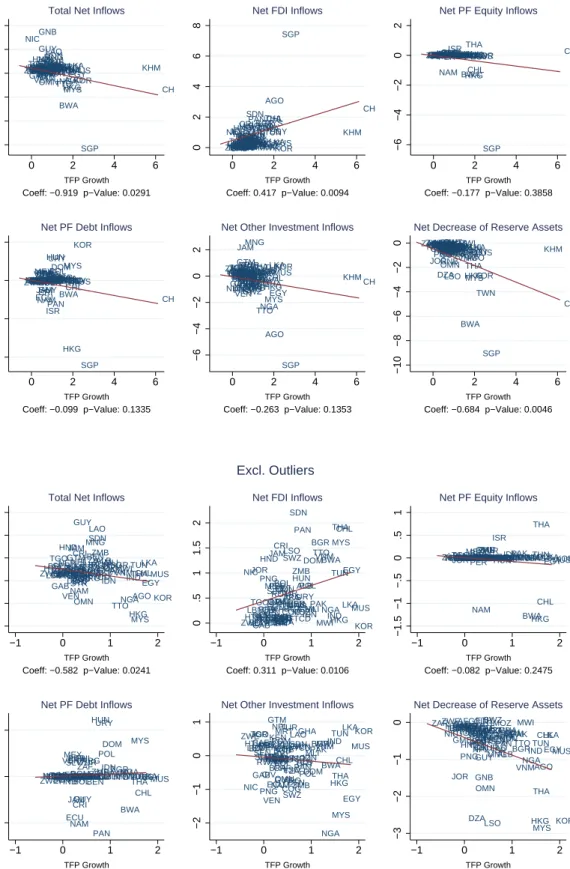
N etInf lowscaptures the different types of (summed) net inflows scaled by initial GDP. In table 1 (and the corresponding figure 1), we present the results for the period 1980-2007 and the full country sample.21 In column (1), we regress total net inflows to initial GDP on TFP growth and provide clear evidence in favour of the allocation puzzle: countries with higher productivity growth received significantly less capital inflows; column (8) shows that the result is robust to subtracting aid inflows from total net inflows.
Next we disaggregate total net capital inflows into their different components. We find no allocation puzzle for FDI: net FDI inflows are significantly positively related with TFP growth (column 2). The point estimate implies that a 10 percentage point increase in TFP raises net FDI inflows (to initial GDP) by 4.17 percentage points. In contrast, we observe a “weak” allocation puzzle for net inflows of portfolio equity investment, net portfolio debt and net other investments: the correlation with productivity growth is negative, but not significant (columns 3, 4 and 5).
For reserves, we find a “strong” allocation puzzle: countries with stronger productivity growth accumulate significantly more reserve assets (column 6). It follows that excluding reserves from total net capital flows weakens the allocation puzzle: the coefficient on TFP growth becomes insignificant (column 7). It is very close to zero if we also exclude aid flows from total net capital flows (column 9). The correlation between net capital flows and productivity growth remains however negative.
We conclude that only FDI flows are in line with the predictions of the standard neoclassical model; the correlation between capital inflows and productivity growth is zero or negative for all other types of capital flows. With regard to debt and reserve flows this result is not surprising: they tend to be shaped by government decisions and macroeconomic policies to a greater extent than FDI inflows. More surprising is the result on portfolio equity flows as it is ex ante not clear whether FDI or portfolio equity investment can be expected to be more linked to productivity development.22 The results point to the potential importance of export-led growth strategies in explaining the allocation puzzle: high-growth countries attract FDI into the productive ex-port industries (which can be seen in the sectoral analysis) and build up reserves to limit the 20Note that data on sectoral openness to FDI flows is not available. It is work in progress to build such a
database based on the AREAER.
21We chose to present the point estimates including the large observations that can been spotted directly from
the upper panel of figure 1. The lower panel shows that the results discussed in this section are robust to excluding observations for which net capital flows and TFP growth deviate by more than 2 standard deviations from their sample mean. Furthermore, the results are very similar if we restrict the sample to the sample used by Gourinchas and Jeanne (2009).
22A wide literature shows that FDI is determined by various considerations such as gaining market access, tariff
appreciation of the exchange rate.
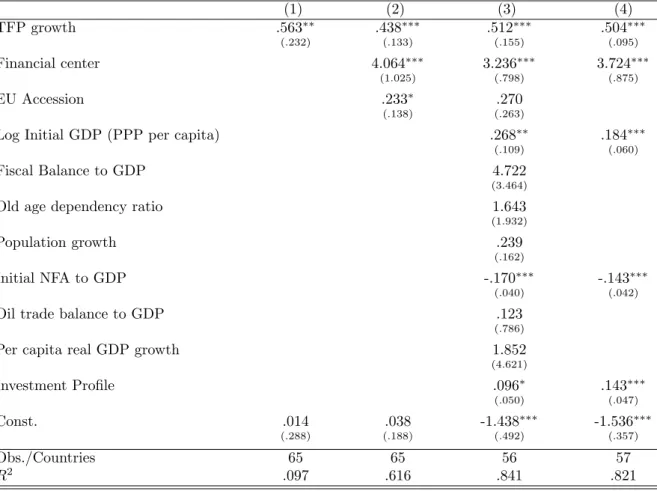
To pave the way to the sectoral analysis, we zoom in on gross FDI inflows, the period 1990 to 2007, and the country sample used in the sectoral analysis.23 The regressions presented in table 2 are hence the aggregate equivalent of the sectoral regressions presented in the next section.24 In column (1), we find that the results for gross FDI inflows are similar to the results for net FDI inflows: the relation between FDI inflows and productivity growth is positive and significant. We check whether this finding is robust to adding various control variables. We first add two dummy variables that capture level effects, namely a dummy for EU accession countries and a dummy for financial centers. As expected, significantly more FDI is flowing into EU accession countries and financial centers. The point estimate on TFP growth falls slightly in size, but rises in significance (column, 2). Second, we add various variables that have been identified as important determinants of the current account/capital flows (see Chinn and Prasad, 2003) as well as a variable, investment profile from the International Country Risk Guide, that proxies institutional aspects that are of special relevance for FDI inflows such as the risk of expropriation. The coefficient on TFP growth remains strongly significant. With regard to the additional controls, we make the following observations: countries with an initially higher per capita GDP level experienced more FDI inflows; in contrast, countries with an initially higher net foreign asset positions experienced less FDI inflows; finally, a good investment profile attracts FDI inflows. In column (4), we retain the significant controls: the results are robust. There is no allocation puzzle for aggregate FDI inflows. In the next section, we will explore the sectoral composition of this result - the positive and significant relation for aggregate FDI flows masks interesting sectoral differences.
In table 3, we explore the impact of financial openness on FDI inflows and the relation between TFP growth and FDI inflows. As expected, financial openness has a positive effect on the amount of FDI inflows a country receives (column 1). To assess the effect of openness on the marginal effect of TFP growth, we include an interaction term between financial openness and TFP growth. We observe a large effect of financial openness: the coefficient on TFP growth becomes negative and insignificant (column 2). There is hence, in line with the theoretical prediction, no relation between TFP growth and FDI inflows for fully closed countries. The interaction term is positive, but not significant. However, the effect of TFP growth for countries with fully open capital accounts (offered by the sum of the first and third coefficient) is positive and significant (the p-value of the sum is 0.06). In Column (4), we add controls to the regression and the interaction term turns significant: the higher the degree of financial openness, the tighter the link between FDI inflows and productivity growth. Columns (5) and (6) show that the results are robust to using the full sample. We hence find that financially closed countries display a “weak” allocation puzzle even for FDI inflows. In contrast, financially open countries do not display an allocation puzzle. We will examine whether this result is driven by certain sectors or whether financial 23From the 72 countries of the sectoral sample Bosnia and Herzegovina, Brunei Darussalam, Russia, Serbia and
Tajikistan drop because the initial capital stock cannot be constructed from PWT 6.3 (The series are too short). There is no IFS data on FDI for Taiwan and not enough FDI data for Guyana.
24We present results with and without control variables as this allows us to compare the aggregate results with
the equivalent unconditional (sector by sector regressions) and conditional (country/sector panel with controls or fixed effects that capture sector-invariant country-level characteristics) regressions of the sectoral analysis.
openness has a similar impact across sectors.
6
Into the Allocation Puzzle - A Sectoral Analysis
6.1
Empirical Approach
We assess the relation between FDI inflows and productivity development using both sector-by-sector regressions in a cross-section of countries and a country/sector panel framework. The sector-by-sector framework allows assessing the unconditional relation between FDI inflows and productivity growth. Specifically, we estimate the following equation for each of the sectors within the 3 and 7-sector framework:
logF DIc=α+γ1P rodGrowthc+εc (6) where P rodGrowth is defined as the ratio of the change in labour productivity to labour pro-ductivity in the first year of available data andlogF DI refers to the natural logarithm of the ratio of summed sectoral FDI inflows to value-added in the first year of available data.25
To assess the robustness of the results with regard to accounting for country-specific charac-teristics, we examine the relation between FDI inflows and productivity growth also in a coun-try/sector panel framework. Including country specific effects in such a framework captures, in fact, all country characteristics that do not change across sectors. Specifically, we estimate the following panel for the 3 and 7-sector dataset:
logF DIc,s=α1Sector1+...+αSSectorS+γ1P rodGrowthc,1·Sector1+
...+γSP rodGrowthc,S·SectorS+θc+εc,s with s=1,...,S (7) where θc is a country specific effect that is potentially correlated with the regressors. Sectoral FDI inflows are regressed on sector dummies and an interaction term between productivity de-velopment and the sector dummies.26 Note that the results of the sector-by-sector regression can be reproduced in the panel framework by simply running a pooled regression (i.e. not including random or fixed effects). Country specific effects account for all country specific characteristics that do not change across sectors (for example, it is likely that the effect of broad aspects of institutional quality - such as law enforcement or bureaucratic quality - is similar across manu-facturing and transport sectors). Furthermore, purging country fixed effects from the regression using the appropriate within transformation can account for potential omitted variable bias in 25We take the log of FDI inflows as the dependent variable to dampen the impact of very large observations.
Specifically, we add one to the ratio of FDI inflows over initial value added as this transformation is neutral for small x, which gives a natural fix point (see the discussion in Yeyati et al. (2007)). Results are broadly robust to not taking logs and are available on request.
26With regard to the model specification, we choose the fixed effects framework (over the random effects
framework), as the Hausman test rejects the random effects model for the 7-sector (at the 1% level). For the 3-sector dataset the p-value of the Hausman test is 0.36 and random effects cannot be rejected convincingly. For the sake of comparability, we still prefer to focus on the fixed effects regression also for the 3-sector data set. Furthermore, the Breusch-Pagan Lagrangian multiplier test, which tests whether the variance of the intercept component in random effects is zero, i.e. if the fixed effects are all the same, rejects its null hypothesis at the 1 % level for both data sets.
case the fixed effects are correlated with sectoral productivity development (as is likely when thinking about the effect of institutional variables).
Since we can present the data (and hence the sector-by-sector regressions) graphically, we can assess the robustness of our results to (potentially) influential observations directly by comparing two sets of figures in the figures below: first, a figure displaying the regression using all the data, and second, a figure with the title “Focusing in” where we exclude observations for which FDI inflows or TFP growth deviate by more than 2 standard deviations from their sample mean. We choose to focus on the regression results based on including these observations, with one reason being that the panel regressions including fixed effects will account for country specific level effects.27
6.2
FDI inflows and productivity growth by sector in a cross-section
of countries
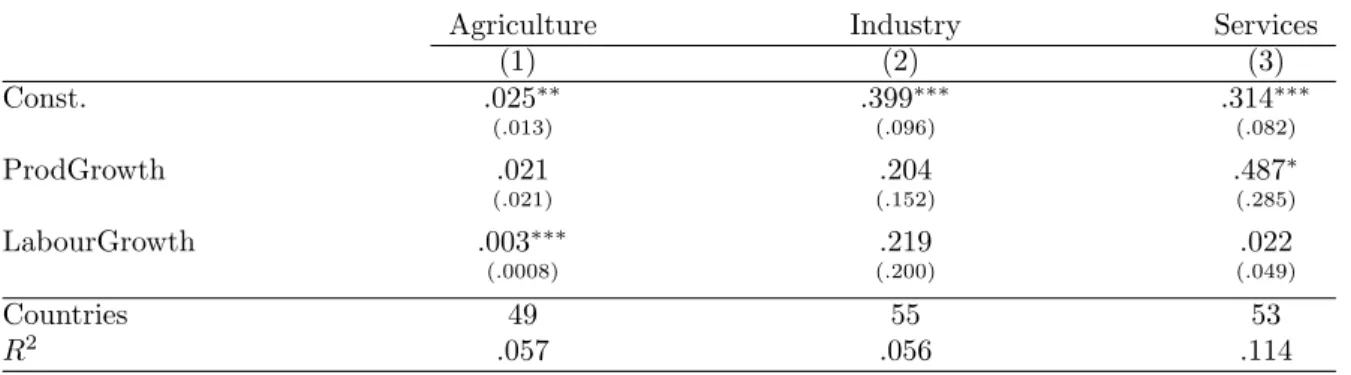
Table 4.1 and the corresponding figure 2 present the results of the sector-by-sector regressions for the 3-sector data set. For the agricultural sector, we find a “weak” allocation puzzle: FDI inflows and productivity growth are unrelated. The same holds for the industry sector although the cor-relation between FDI inflows and productivity growth is stronger than for the agricultural sector. For the service sector, FDI inflows and productivity growth are strongly related (significant at the 5 % level). The results are qualitatively and quantitatively robust to excluding observations for which FDI inflows or productivity growth deviate by more than 2 standard deviations from the sample mean. The estimated coefficient implies a strong link between productivity growth and FDI inflows: a 10 percentage point increase in productivity growth in the service sector is associated with an increase of FDI inflows to initial GDP by 4.5 percent.
Industry as well as services conflate the effect of very different industries (e.g. resource extraction vs. manufacturing and transport vs. financial intermediation and business). We hence move to the 7-sector framework to shed more light on the different subcomponents of the three main sectors. In table 4.2 and figure 3, we present the results. Splitting up the industry sector into its components reveals that the lack of a positive significant relation between FDI inflows and productivity growth is driven by a significantly negative relation for the construction sector and a negative, but insignificant relation for the mining and utilities sector (note that the mining sector includes petroleum). In contrast, for manufacturing, the coefficient on productivity growth is positive and significant. For the services sector, the positive and significant relation between productivity growth and FDI inflows carries over to the trade and tourism sector (GH) as well as the transport, storage and communication sector (I); the coefficient is not significant for business, finance and other services (JKLMNOP).
In a next step, we attempt to further disaggregate the mining and utilities, trade and tourism, and business, finance and other services sectors. Note however, that we have to base this analysis on a different dataset for sectoral value added (based on national accounts data as opposed 27Results are broadly robust to estimating without these observations. As stated, for the sector-by-sector
regressions, all results can be read from figures 2 to 4. For the other specifications, we will notify in due course if regression results without including these observations deviate qualitatively from the results given in the paper. All results are available on request.
to estimates from the United Nations Statistics Division); the results are hence not strictly comparable to the results based on the 7-sector dataset. 28 Furthermore, missing employment and value-added data for the mining, trade and tourism sector causes the sample to drop below 30 countries for these sectors; the results should be hence interpreted with some caution.
In table 4.3 and figure 4, we present the results. Splitting up the mining and utilities sector (CE) into its two components shows that the relation between productivity and FDI inflows is stronger for the mining sector than for the utilities sector. However, we still observe a “weak” allocation puzzle for both sectors. Focusing in on trade and tourism (GH) gives an interesting result: the positive correlation for trade and tourism (GH) appears to be only driven by trade (G); for tourism (H), we observe a negative relation between productivity growth and FDI inflows - a “weak” allocation puzzle. Finally, disaggregating the finance, business and other services sector (LMNOPQ) into its components reveals a positive and significant coefficient on productivity growth for the finance and business sector (JK); the estimated coefficient implies a strong link between inflows and productivity: a 10 percentage point increase in productivity growth is associated with a 6.6 percent increase in FDI inflows in percent of initial value added - the link is even stronger (9 percent) and significant at the 1 percent level when excluding observations for which FDI inflows or productivity growth deviate by more than 2 standard deviations from the sample mean.
To summarize, we find a “strong” allocation puzzle for the construction (F) sector. For agriculture (AB), mining/utilities (CE) and tourism (H), we find a “weak” allocation puzzle. The evidence speaks against an allocation puzzle for countries’ manufacturing (D), trade (G), transport/communication (I) and business/finance (JK) sectors. Finally, the point estimates are from 60 percent (for transport, storage and communication) to nearly 300 percent (finance and business) higher for the service sectors than for the manufacturing sector.
6.3
FDI inflows and productivity growth in a country/sector panel
In this section, we assess the robustness of the results to accounting for country-specific effects by including fixed effects into a country/sector panel. Table 5 shows that the results for the 3-sector dataset are very similar to the results of the sector-by-sector regressions. However, some interesting differences emerge for the 7-sector setup. First, we find evidence for a “strong” allocation puzzle for the agricultural sector; the point estimate is negative and significant at the 5 percent level.Second, the positive and significant relation between FDI inflows and productivity that we found for the manufacturing sector breaks down; the coefficient is now positive, but not signif-icant. Accounting for country-specific characteristics reveals hence a “weak” allocation puzzle for the manufacturing sector.
Third, we find a positive and significant relation also for the business, finance and other services sectors (JKLMNOP). Furthermore, the coefficient for the trade and tourism (GH) sector is still positive, but loses its significance.
28Note further that the base year, used for the conversion into constant dollars, is 1990 for the 7 sector data set
and 2000 for the sectors which we disaggregate further. Differences can stem from the fact that the conversion requires taking the exchange rate of the base year, which can deviate from underlying price trends.
With regard to mining and utilities and the other service sectors, the results of the coun-try/sector panel confirm the results of the sector-by-sector regressions. We observe a “weak” allocation puzzle for the mining and utilities sectors; in contrast the positive and significant cor-relation between productivity growth and FDI inflows remains for the aggregate service sectors and transport, storage and communication (I): a 10 percentage point increase in productivity growth increases FDI inflows to initial GDP by 4.8 percent in the aggregate service sector and by 1.9 percent in the transport, storage and communications sector (I).
6.4
Robustness: Controlling for Labour
So far we have abstracted from the potential impact of changes in the labour force. As shown, labour force growth has the same impact on FDI inflows as productivity growth; both an increase in TFP and the labour force raises the marginal product of capital.29 Omitting labour force growth from the regression would cause the coefficient on productivity growth to be biased if labour force growth and productivity growth are correlated. However, tables 6.1 to 6.3 show that our results are robust to including labour force growth into the regression. The estimated coefficient is in fact larger and more significant for the trade and tourism sector (GH) as well as the business, finance and other services sector (JKLMNOPQ), especially when accounting for country fixed effects (table 6.3).
6.5
The role of financial openness
In this section we assess the impact of financial openness both on the level of sectoral FDI inflows and on the relation between productivity growth and sectoral FDI inflows.
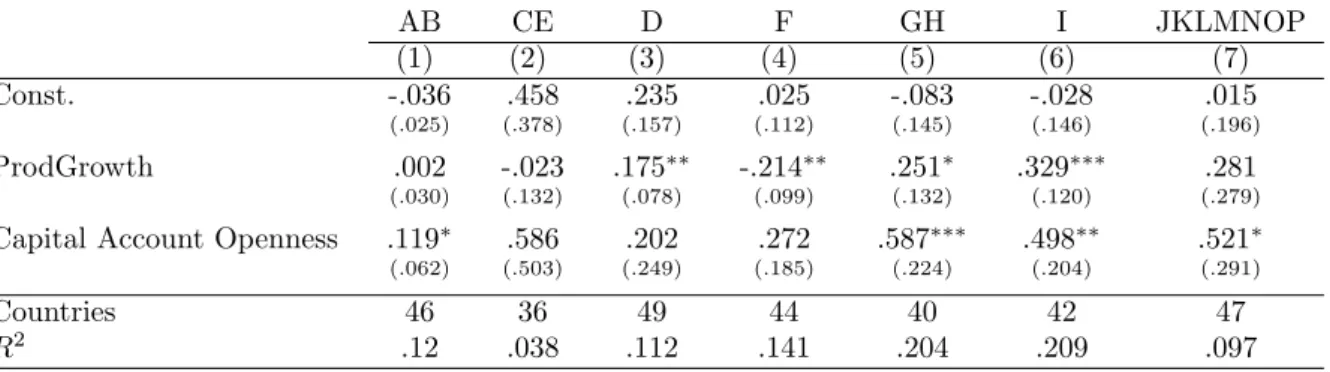
We found that financial openness has a positive impact on FDI inflows on the aggregate level. In table 7, we examine whether this impact differs across sectors. This is indeed the case. Financial openness has a positive and significant impact on FDI inflows into the agricultural (AB), trade and tourism (GH) and transport, storage and communication (I) sector; it does not impact FDI inflows in the remaining sectors of the economy.
In a next step, we assess the impact of financial openness on the marginal effect of productivity growth on FDI inflows. For this purpose, we add an interaction term between financial openness and productivity growth to the sector-by-sector and country/sector panel regressions.30 Tables 8.1 to 8.2 present the results for the sector-by-sector regression. The interaction term is positive and significant for the trade and tourism sector (GH), the transport, storage and communication sector (I), and the aggregate services sector. We find furthermore the countries with the highest degree of restrictions display a “weak” allocation puzzle as the coefficient on productivity growth is negative, but not significant. It follows that a country with fast productivity growth draws in more FDI into its service sectors only when it is financially open. Tables 9.1 and 9.2 confirm the robustness of the result for the aggregate services sector and the trade and tourism sector to
29When we allow the labour force to vary, equation (5) writes: Inflowsc,t1−t0
Yc,t0
= α+β1∆ac+β2∆lc with
β1=β2=bandα=a+bϕin case the theoretical prediction holds exactly in the data.
30We also include sector dummies interacted with openness and sector dummies interacted with productivity
accounting for country characteristics; the coefficient for the transport sector (I) is not robust. The coefficient that measures the impact of productivity growth for the countries with the highest degree of capital account restrictions (”Sector*ProdGrowth”) is now negative and significant - we find hence a“strong” allocation puzzle for this group of countries. Finally, Tables 10.1 and 10.2 show that the results on the interaction terms are robust to using a different, more FDI-specific measure of financial openness - specifically, the index on FDI inflow restrictions developed by Schindler (2009).
We conclude that financial openness has an impact on the level of FDI inflows in the agricul-ture and the service sectors, whereas it impacts (positively) the relation between productivity growth and FDI inflows only for the service sectors; financial openness does not play a role in the remaining sectors of the economy.
Insofar as investment in agriculture (AB) and mining/utilities (CE) is less driven by market incentives but more by resource security considerations and special contracts between the source and the host countries - i.e. special investment regimes - the results fit to prior expectations.
Interesting is the difference in the impact of financial openness between the manufacturing (D) sector and the service sectors. We see two potential explanations. First, the result might reflect the broad macroeconomic framework adopted by some countries. Consider governments maintaining regulations on capital account transactions while attempting to achieve a manu-facturing based export-led growth strategy. FDI into the manumanu-facturing sector is then actively encouraged and often targets special investment zones, which are used by countries to attract FDI, ”circumventing” a generally high level of capital account and direct investment restrictions. By contrast, consider countries that broadly lift controls on the capital account. This is often associated with more extensive liberalizing measures, which include the reduction of investment restrictions in sectors that are traditionally shielded from foreign competition (i.e. the service sectors) - consider for example the experience of South Korea after the Asian crisis or the experi-ence of the Eastern European accession countries. In this case, financial openness would, indeed, only have an impact on FDI flows into the service sectors.31 A second potential explanation is that countries are generally more open to FDI inflows into their manufacturing sectors, but that there are big cross-country differences with regard to openness towards FDI inflows into sensitive industries (such as the financial sector).32 It will be up to future research to build a suitable index of financial openness by sector to refine this analysis.
7
Discussion
This paper focuses on establishing a new set of stylized facts with regard to the relation of FDI inflows and productivity growth in the main sectors of the economy. To discriminate -theoretically or empirically - between the variety of potential explanations is subject to future research. However, to conclude, we discuss the potential role of resource endowment in explaining our findings with regard to the presence of sectoral allocation puzzles as well as the role of trade
31This is, of course, subject to a more rigorous empirical analysis which is left to future research.
32Hence, there would be not enough variation to identify the effect of differences in financial openness on FDI
and production related factors in explaining the fact that the estimated correlations are higher for the service sectors than for the manufacturing sector.
Resource endowment is likely to play a key role in all the sectors that display an allocation puzzle. Specifically, there are two channels through which resource endowment might have an effect. First, investment in e.g. the petroleum sector is characterized by very high fixed costs and its long-term nature. This limits the ability of foreign investors to reallocate flows to different countries; investors are likely to stay even in phases of low productivity growth. Second, the output of agriculture and mining/petroleum/utilities sectors (CE) is of a high strategic importance. Consider for example FDI inflows into the agricultural sectors of many developing countries with the goal to achieve food security, or FDI into countries’ mining/petroleum/utilities sectors to secure the resource inputs for the manufacturing industries of the foreign investor. In such cases, politics may play a more important role and might trump economic considerations such as productivity growth and the return of investment.
Considerations related to the tradability of the final good might explain the fact that the estimated correlations between FDI inflows and productivity growth are far higher for the ser-vice sectors than for the manufacturing sector. Consider for example an investor who decides between investing and exporting in a model that features a fixed cost to observe which coun-try/sector/company is the best to invest in. In case tariff-barriers and transportation costs are not too high, a manufacturing sector investor will decide on saving the fixed cost and base her/his business model on exporting directly. FDI into manufacturing would then be driven by secondary considerations and it will not be worth for the investor to incur the fixed costs of finding the best investment opportunities. Furthermore, the manufacturing sector investor can always retreat to her/his domestic manufacturing base and keep on exporting to the country in case the investment does not turn out to be successful - the risks are then subsequently smaller. It follows that there is only a weak link between productivity growth and FDI inflows into manufacturing industries. On the contrary, given the intangibility and non-tradability of the goods, a service sector investor has to enter the market directly, incurring huge risks. Hence, paying the fixed costs of observing sectoral productivity developments and identifying the best investment opportunity is essential and carries much bigger benefits. It follows that a service sector investor would only invest in a country’s service sector if (privately observed) productivity growth is strong. Consequently, the link between productivity and FDI inflows into the service sector would be stronger than for the manufacturing sector.
8
Conclusion
This paper assesses the allocation puzzle - the tendency for capital to flow to countries with relatively low productivity growth - by focusing on FDI inflows, which should be particularly sensitive to productivity prospects. We show that FDI inflows and productivity growth are tightly linked across countries on the aggregate level. Using a new database, we, however, docu-ment substantial sectoral heterogeneity and establish a new set of stylized facts. Specifically, we find that the correlation between FDI inflows and productivity growth is negative in the agri-culture, mining/utilities, construction and tourism sector. These sector-level allocation puzzles
constitute an even starker violation of the neoclassical growth model than the allocation puzzle for total capital flows as they are observed for FDI inflows, which should comply most with the model’s predictions. By contrast, we show that countries with faster productivity growth in manufacturing attract more investment in that sector. The correlations are even stronger for the service sectors, both with regard to their size and significance; FDI inflows and produc-tivity growth are tightly linked in the business and finance, trade, and transport, storage and communication sector.
The results shed some light on the allocation puzzle for total capital flows observed on the aggregate level; they indicate that the sectoral composition of economies matters for the link between capital flows and productivity growth: countries where sectors for which we document an allocation puzzle play a dominant role might contribute to the weak link between productivity growth and capital inflows observed on the aggregate level. It would be interesting to know more about the sectoral composition of other types of capital flows to explore this point further.
We also document a role for financial openness: a country with fast productivity growth draws in more FDI into its service sectors only when it is financially open. The aggregate indices, that we used, are however quite crude measures of financial openness on a sectoral level. There are more investment restrictions in agriculture or the financial sector than in the manufacturing sector.33 It is subject to future research to build a dataset that captures financial openness on the sectoral level.
We briefly discuss several channels that might explain the sector-level results. To theoretically account for resource endowment or trade and production related factors would require deviations from the simple neoclassical framework we outlined. On the contrary, the results on financial openness (one of the model’s underlying assumptions) show that the data matches the predictions of the model more closely once capital is allowed to flow freely. Finally, the sector-level results indicate that it would be worthwhile to take a closer look at the sectoral setup of economies to understand results documented at the aggregate level.
33This claim is based on the information on direct investment restrictions contained in the IMF’s Annual Report
References
Aguiar, Mark and Manuel Amador (2009) “Growth in the Shadow of Expropriation,” NBER Working Paper No. 15194.
Aizenman, Joshua, Brian Pinto, and Artur Radziwill (2007) “Sources for Financing Domestic Capital: Is Foreign Saving a Viable Option for Developing Countries?,”Journal of International Money and Finance 26(5), 682-702.
Alfaro, Laura, Sebnem Kalemli-Ozcan, and Vadym Volosovych (2008) “Why doesn’t capital flow from rich to poor countries? An empirical investigation,” Review of Economics and Statistics
90(2), 347-368.
Alfaro, Laura, Areendam Chanda, Sebnem Kalemli-Ozcan and Selin Sayek (2004) “FDI and Economic Growth: The Role of Local Financial Markets,” Journal of International Economics
64(1), 89-112.
Aykut, Dilek, and Selin Sayek (2007) “The Role of the Sectoral Composition of Foreign Direct Investment on Growth,” in Piscitello, L. and G. D. Santangelo, eds. (2007)Do Multinationals Feed Local Development and Growth?,Elsevier.
Balasubramanyam, V.N., M. Salisu, and David Sapsford (1996) “Foreign Direct Investment and Growth in EP and IS Countries,”Economic Journal 106(434), 92-105.
Beck, Thorsten, Asli Demirg¨u¸c-Kunt, and Ross Levine (2000) “A New Database on Financial Development and Structure,” updated in 2007,World Bank Economic Review 14, 597-605. Benhima, Kenza (2009) “Capital Flows and Growth in Developing Countries: the Role of In-vestment Risk,” mimeo.
Borensztein, Eduardo, Jose De Gregorio, Jong-Wha Lee (1998) “How does foreign direct invest-ment affect economic growth?”Journal of International Economics 45, 115 135.
Buera, Francisco J. and Yongseok Shin (2010) “Productivity Growth and Capital Flows: The Dynamics of Reforms,” mimeo.
Caballero, Ricardo J., Emmanuel Farhi, and Pierre-Olivier Gourinchas (2008) “An Equilibrium Model of ‘Global Imbalances’ and Low Interest Rates,”American Economic Review98(1), 35893. Carroll, Christopher and Olivier Jeanne (2009) “A Tractable Model of Precautionary Reserves, Net Foreign Assets, or Sovereign Wealth Funds,” NBER Working Paper No. 15228.
Caselli, Francesco (2004) “Accounting for cross-country income differences,” NBER Working Pa-per No. 10828.
Caselli, Francesco and James Feyrer (2007) “The marginal product of capital,”Quarterly Jour-nal of Economics 122, 535-68.
Carkovic, Maria and Ross Levine (2003) “Does Foreign Direct Investment Accelerate Economic Growth?,” Working Paper, University of Minnesota.
China Rising?,” IMF Working Paper No. 08/145.
Chinn, Menzie and Hiro Ito (2008) “A New Measure of Financial Openness,Journal of Compar-ative Policy Analysis 10(3), 309 - 322.
Chinn, Menzie. and E. Prasad (2003) “Medium-term determinants of current accounts in indus-trial and developing countries: an empirical exploration,” Journal of International Economics, 59, 47-76.
Chirinko, Robert S. and Debdulal Mallick (2008) “The Marginal Product of Capital: A Persis-tent International Puzzle” CESIFO Working Paper No. 2399.
Feldstein, Martin and Charles Horioka (1980) “Domestic Saving and International Capital Flows,”
Economic Journal 90(358), 314-29.
Gollin, Douglas (2002) “Getting Income Shares Right,” Journal of Political Economy 110(2), 458-474.
G¨org, Holger and David Greenaway (2004) “Much Ado about Nothing? Do Domestic Firms
Really Benefit from Foreign Direct Investment?,”World Bank Research Observer 19(2), 171-97. Gourinchas, Pierre-Olivier and Olivier Jeanne (2009) “Capital Flows to Developing Countries: The Allocation Puzzle,” Peterson Institute for International Economics Working Paper No. 09-12.
Hall, Robert E. and Charles I. Jones (1999) “Why do some countries produce so much more output than others?,”The Quarterly Journal of Economics 114(1), 83-116.
Herzer, Dierk, Stephan Klasen, and Felicitas Nowak-Lehmann D. (2008) “In search of FDI-led growth in developing countries: The way forward,”Economic Modelling 25(5),793-810.
Heston, Alan, Robert Summers, and Bettina Aten (2006) “Penn World Table Version 6.3,” Center for International Comparisons of Production, Income and Prices at the University of Pennsylva-nia.
Javorcik, Beata Smarzynska (2004) “Does Foreign Direct Investment Increase the Productivity of Domestic Firms? In Search of Spillovers through Backward Linkages,” American Economic Review 94(3), 605-27.
Kalemli-Ozcan, Sebnem, Ariell Reshef, Bent E. Sorensen and Oved Yosha (2008) “Why does Capital Flow to Rich States?”Review of Economics and Statistics (forthcoming).
Kose, M. Ayhan, Eswar S. Prasad, Kenneth Rogoff, and Shang-Jin Wei (2006) “Financial Glob-alization: A Reappraisal,” IMF Working Paper No. 06/189.
Lipsey, Robert E. (2004) “Home and Host Country Effects of FDI,” Baldwin, Robert E. and L. Alan Winters, eds. (2004) Challenges to Globalization. Analyzing the Economics, Chicago: University of Chicago Press.
Lucas, Robert E. (1990) “Why doesn’t Capital Flow from Rich to Poor Countries?,”American Economic Review 80(2), 92-96.
Moran, Theodore H. (2005) “How Does FDI Affect Host Country Development? Using Industry Case Studies to Make Reliable Generalizations,” in Moran, Theodore H., Edward M. Graham, and Magnus Blomstr¨om, eds. (2005) Does Foreign Direct Investment Promote Development?,
Washington: Peterson Institute for International Economics.
Prasad, Eswar S., Raghuram G. Rajan, and Arvind Subramanian (2007) “Foreign Capital and Economic Growth,”Brookings Papers on Economic Activity, Spring 2007, 153-230.
Quinn, Dennis (1997) “The Correlates of Change in International Financial Regulation,” Amer-ican Political Science Review 91(3), 531-551.
Rodrik, Dani (1999) Making Openness Work: The New Global Economy and the developing
Countries, Washington, DC: Overseas Development Council.
Rodrik, Dani (2008) “The Real Exchange Rate and Economic Growth: Theory and Evidence,”
Brookings Papers on Economic Activity,Fall 2008 Conference draft.
Rodrik, Dani and Arvind Subramanian (2008) “Why did financial globalization disappoint?,” mimeo.
Roodman, David (2006) “An index of Donor performance,” Center for Global Development. Working Paper 67 November 2006 edition.
Sandri, Damiano (2010) “Growth and Capital Flows with Risky Entrepreneurship,” IMF Work-ing Paper No. 10/37.
Schindler, Martin (2009) “Measuring Financial Integration: A New Data Set,”IMF Staff Papers
56(1).
Timmer, Marcel P. and Gaaitzen J. de Vries (2007) “A Cross-Country Database For Sectoral Employment And Productivity In Asia And Latin America, 1950-2005,” Groningen Growth and Development Centre, University of Groningen.
Yeyati, Eduardo L., Ugo Panizza, and Ernesto Stein (2007) “The cyclical nature of North-South FDI flows,”Journal of International Money and Finance 26(1), 104-130.