Feature Learning for RGB-D Data
Ziyun Cai
Department of Electronic and Electrical Engineering
University of Sheffield
This thesis is submitted for the degree of
Doctor of Philosophy
Declaration
This thesis includes parts of the following papers. All these papers were primarily written by Ziyun Cai, as a result of the Ph.D. research. These works have been published or under review:
1. Z. Cai, L. Liu, M. Yu and L. Shao. “Latent Structure Preserving Hashing”, British Machine Vision Conference, Swansea, UK, Sep. 2015.
2. Z. Cai, J. Han, L. Liu and L. Shao. “Rgb-d datasets using microsoft kinect or similar sensors: a survey”, published in Multimedia Tools and Applications, pp. 1-43, 2016.
3. L. Shao,Z. Cai, L. Liu and K. Lu. “Performance Evaluation of Deep Feature Learn-ing for RGB-D Image/Video Classification”, published in Information Sciences, vol. 385, pp. 266-283, 2017.
4. Z. Cai and L. Shao. “RGB-D Data Fusion in Complex Space”, accepted by IEEE International Conference on Image Processing, Beijing, China, Sep. 2017.
5. Z. Cai, Y. Long and L. Shao. “Classification Complexity Assessment For Hyper-parameter Optimization”, submitted to IEEE Transactions on Image Processing.
6. Z. Caiand L. Shao. “RGB-D Scene Classification via Multi-modal Feature Learn-ing”, submitted to IEEE Transactions on Cybernetics.
7. Z. Cai, Y. Long and L. Shao. “Adaptive RGB Image Recognition by Visual-Depth Embedding”, submitted to IEEE Transactions on Image Processing.
Ziyun Cai August 2017
Acknowledgements
My deepest gratitude goes first and foremost to my supervisor, Prof. Ling Shao, for his constant encouragement and enthusiastic supervision. He offered a great opportunity to me to research with him, and lighted the path for me into the world of machine learning, pattern recognition and computer vision. I can not reach the current progress without his illuminating and consistent instruction. Meanwhile, I do appreciate for the encouragement from my second supervisor Dr. Wei Liu. His enthusiastic life attitude and working style encourage me a lot. Each regular contact meeting with him made me feel full of power for a further research.
I would like to thank my fellow colleagues: Dr. Simon Jones, Dr. Ruomei Yan, Dr. Di Wu, Dr. Fan Zhu, Dr. Li Liu, Dr. Feng Zheng, Dr. Mengyang Yu, Yang Long, Yawen Huang, Redzuan Bin Abdul Manap, Bo Dong, Shidong Wang, Chirine Riachy, Daniel Or-ganisciak, Yuming Shen, Bingzhang Hu, Yi Zhou and Jie Li. Thank them for their help. In addition, they made a lot of contributions to our group. It is a good memory of working with them. Thanks to Dr. Li Liu, Dr. Fan Zhu and Dr. MengYang Yu for their great help when I just joined our group as a newcomer. I feel grateful to Yang Long and Dr. Feng Zheng who always discussed with me in these three years.
I would like to thank the external examiners Dr. Hubert Shum and Dr. Yonghuai Liu for reviewing my thesis. Their suggestions are invaluable for the improvement of this thesis. I would also like to thank the internal co-ordinator Dr. Xiaoli Chu for the arrangements of the oral examination.
I would like to thank my friends: Qi Hong, Baoling Zhang, Lukai Zheng, Hui Zheng, Shuaida Ji, Tian Feng, Zhizhong Yu, Qian Guo, Lao E, for their support and care. They all bring me joyful experience in my leisure time.
I specially thank Postgraduate Administrator Ms. Hilary J Levesley, PGR Director Dr. Thomas Walther and Head of Department Prof. Geraint W Jewell for their kindness and patience. They are always ready to help when I am in trouble.
Finally, I would like to thank my grandma and loving parents for their enduring love and endless support. They forgive my caprice and fault all the time. I am grateful to my girlfriend Xiao Sun for her love and encouragement all the time.
Abstract
RGB-D data has turned out to be a very useful representation for solving fundamental com-puter vision problems. It takes the advantages of the color images that provide appearance information of an object and also the depth image that is immune to the variations in color, illumination, rotation angle and scale. With the invention of the low-cost Microsoft Kinect sensor, which was initially used for gaming and later became a popular device for computer vision, high quality RGB-D data can be acquired easily. RGB-D image/video can facilitate a wide range of application areas, such as computer vision, robotics, construction and med-ical imaging. Furthermore, how to fuse RGB information and depth information is still a problem in computer vision. It is not enough to simply concatenate RGB data and depth data together. A new fusion method could better fuse RGB images and depth images. It still needs more powerful algorithms on this. In this thesis, to explore more advantages of RGB-D data, we use some popular RGB-D datasets for deep feature learning algorithms evaluation, hyper-parameter optimization, local multi-modal feature learning, RGB-D data fusion and recognizing RGB information from RGB-D images: i) With the success of Deep Neural Network in computer vision, deep features from fused RGB-D data can be proved to gain better results than RGB data only. However, different deep learning algorithms show different performance on different RGB-D datasets. Through large-scale experiments to comprehensively evaluate the performance of deep feature learning models for RGB-D im-age/video classification, we obtain the conclusion that RGB-D fusion methods using CNNs always outperform other selected methods (DBNs, SDAE and LSTM). On the other side, s-ince LSTM can learn from experience to classify, process and predict time series, it achieved better performances than DBN and SDAE in video classification tasks. ii) Hyper-parameter optimization can help researchers quickly choose an initial set of hyper-parameters for a new coming classification task, thus reducing the number of trials in terms of hyper-parameter space. We present a simple and efficient framework for improving the efficiency and ac-curacy of hyper-parameter optimization by considering the classification complexity of a particular dataset. We verify this framework on three real-world RGB-D datasets. After the analysis of experiments, we confirm that our framework can provide deeper insights into the relationship between dataset classification tasks and hyperparameters optimization,
two popular datasets to thoroughly test the performance of our method, which show that our method with local multi-modal CNNs greatly outperforms state-of-the-art approaches. Our method has the potential to improve RGB-D scene understanding. Some extended evalua-tion shows that CNNs trained using a scene-centric dataset is able to achieve an improve-ment on scene benchmarks compared to a network trained using an object-centric dataset. iv) We propose a novel method for RGB-D data fusion. We project raw RGB-D data into a complex space and then jointly extract features from the fused RGB-D images. Besides three observations about the fusion methods, the experimental results also show that our method achieves competing performance against the classical SIFT. v) We propose a novel method called adaptive Visual-Depth Embedding (aVDE) which learns the compact shared latent space between two representations of labeled RGB and depth modalities in the source domain first. Then the shared latent space can help the transfer of the depth information to the unlabeled target dataset. At last, aVDE matches features and reweights instances jointly across the shared latent space and the projected target domain for an adaptive classifier. This method can utilize the additional depth information in the source domain and simultaneous-ly reduce the domain mismatch between the source and target domains. On two real-world image datasets, the experimental results illustrate that the proposed method significantly outperforms the state-of-the-art methods.
Table of contents
Table of contents ix
List of figures xiii
List of tables xvii
Nomenclature xviii
1 Introduction and Literature Review 1
1.1 Introduction . . . 1
1.2 A Brief Review of Kinect . . . 5
1.2.1 Kinect Hardware Configuration . . . 6
1.2.2 Kinect Software Tools . . . 8
1.3 RGB-D Benchmark Datasets . . . 9
1.3.1 RGB-D Datasets for Object Detection and Tracking . . . 9
1.3.2 Human Activity Analysis . . . 10
1.3.3 Object and Scene Recognition . . . 10
1.3.4 Simultaneous Localization and Mapping (SLAM) . . . 12
1.3.5 Hand Gesture Analysis . . . 12
1.3.6 Comparison of RGB-D datasets . . . 12
1.4 Deep Learning Models . . . 17
1.4.1 Deep Belief Networks . . . 18
1.4.2 Stacked Denoising Auto-Encoders . . . 20
1.4.3 Convolutional Neural Networks . . . 21
1.4.4 Long Short-Term Memory Neural Networks . . . 22
1.5 Datasets in Our Research . . . 25
1.5.1 RGB-D Object Dataset . . . 25
1.5.2 NYU Depth V1 and V2 . . . 26
Datasets 33
2.1 Overview . . . 33
2.2 Literature Review . . . 34
2.2.1 Related work to RGB-D information . . . 34
2.2.2 Related work to deep learning methods . . . 35
2.3 Data Preprocessing on Deep Learned Features . . . 36
2.3.1 Normalization . . . 36
2.3.2 PCA/ZCA Whitening . . . 37
2.4 Experiments on Deep Learning Models . . . 37
2.4.1 2D&3D Object Dataset . . . 38
2.4.2 Object RGB-D Dataset . . . 40
2.4.3 NYU Depth v1 . . . 43
2.4.4 Sheffield Kinect Gesture (SKIG) Dataset . . . 45
2.4.5 MSRDailyActivity3D Dataset . . . 49
2.4.6 Tricks For Adjusting Hyper-parameters . . . 51
2.4.7 Overall Performance Analysis . . . 52
2.5 Summary . . . 54
3 Hyper-parameter Optimization via Classification Complexity Assessment 55 3.1 Overview . . . 55
3.2 Literature Review . . . 56
3.3 Motivation and Contributions . . . 57
3.4 Classification Complexity Measures . . . 58
3.4.1 Measures of overlap . . . 58
3.4.2 Measures of class separability . . . 59
3.4.3 Measures of geometry, topology and density . . . 62
3.5 Methodology . . . 65
3.6 Experimental Setup . . . 66
3.6.1 Datasets . . . 66
Table of contents xi
3.6.3 Classification complexity measures in experiments . . . 68
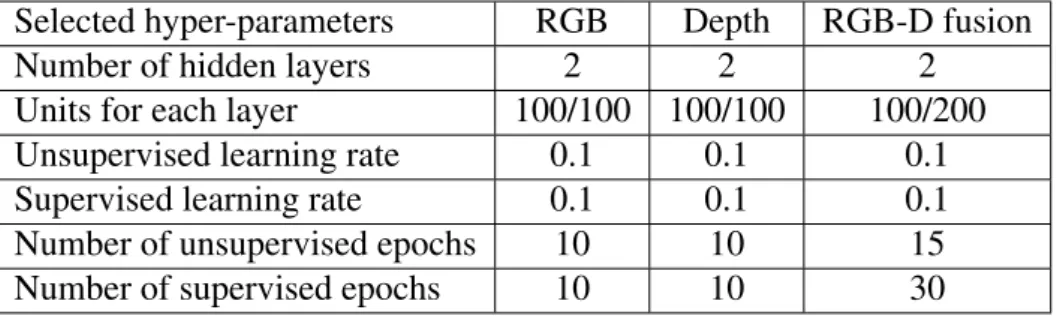
3.6.4 Hyper-parameters and performance in experiments . . . 68
3.6.5 Overall performance analysis . . . 73
3.7 Real-world scenario . . . 74
3.8 Summary . . . 75
4 Feature Learning for RGB-D Scene Classification 77 4.1 Overview . . . 77
4.2 Literature Review . . . 80
4.3 Methodology . . . 81
4.3.1 RGB-D region proposal extraction . . . 82
4.3.2 Region proposal screening . . . 83
4.3.3 Discriminative region proposals clustering . . . 85
4.3.4 Depth region proposal encoding . . . 85
4.3.5 Local fine-tuning of multi-modal architecture . . . 85
4.3.6 Multi-level representation from region proposals . . . 87
4.4 Experimental results . . . 88
4.4.1 Datasets . . . 89
4.4.2 Experiment Setup . . . 89
4.4.3 Global and Local Fine-tuning Discussions . . . 93
4.4.4 Ablation study . . . 94
4.5 Summary . . . 97
5 RGB-D Data Fusion in Complex Space 99 5.1 Overview . . . 99
5.2 Motivation and Contributions . . . 100
5.3 Fusion Methodology . . . 101
5.3.1 Mutual Information and Independence . . . 105
5.3.2 Feature Distribution . . . 106
5.3.3 EuclideanKS-distance to Uniformity . . . 107
5.4 Complex-valued SIFT . . . 108
5.5 Experimental Setup . . . 110
5.5.1 NYU Depth v1 . . . 111
5.5.2 SUN RGB-D . . . 112
6.4.2 Shared Component Problem Formulation . . . 120
6.4.3 Data Distribution Divergency Reduction . . . 121
6.4.4 Relaxation and Optimization . . . 122
6.4.5 Adaptive Embedding . . . 125
6.4.6 Computational Complexity Analysis . . . 128
6.5 Experiments and Results . . . 129
6.5.1 Datasets . . . 129
6.5.2 The Selected Methods and Settings . . . 130
6.5.3 Experimental Results . . . 131
6.5.4 Parameter Sensitivity Analysis . . . 133
6.5.5 Analysis on aVDE . . . 135
6.6 Summary . . . 135
7 Conclusion and Future Work 137 7.1 Conclusion . . . 137
7.2 Future Work . . . 140
References 145
List of figures
1.1 The main studies and the correlation of all chapters carried out in this thesis 5
1.2 Illustration of the structure and internal components of the Kinect sensor . . 6
1.3 The schematic representation of DBN . . . 19
1.4 The figure of Stacked Denoising Auto-Encoders . . . 20
1.5 The classical schematic representation of CNNs . . . 21
1.6 The standard LSTM architecture . . . 23
1.7 A cross-section of an LSTM network, with a single memory block, and connections from the input layer (bottom) to the output layer (top). . . 23
1.8 Sample objects from the RGB-D object dataset (left), examples of RGB image and depth image of an object (right top) and RGB-D scene images (right bot). . . 26
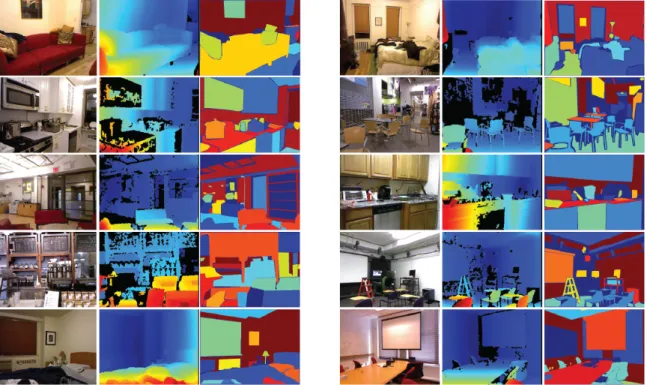
1.9 Selected examples of RGB images, raw depth images and class labeled im-ages in NYU dataset. . . 27
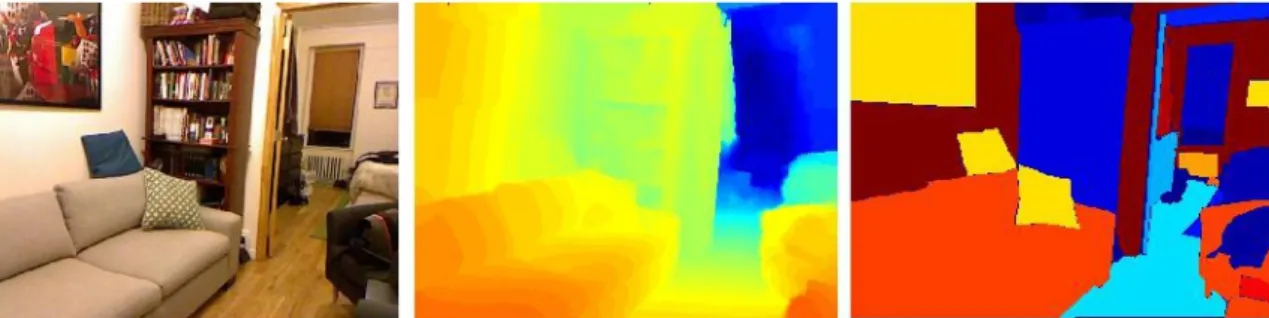
1.10 Output of the RGB camera (left), pre-processed depth image (mid) and class labeled image (right) from NYU Depth V1 and V2 dataset. . . 28
1.11 Example images in the 2D&3D Object dataset . . . 28
1.12 Sample frames from Sheffield Kinect gesture dataset and the descriptions of 10 different categories. . . 29
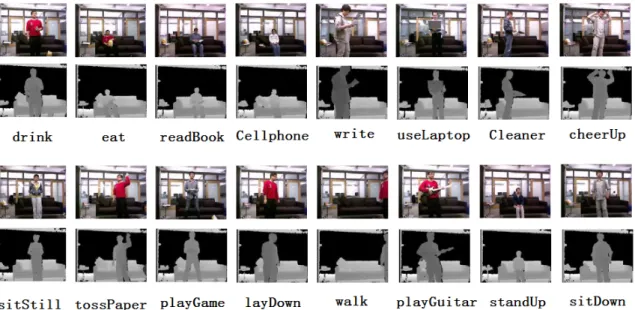
1.13 Selected examples of RGB images and raw depth images in MSRDailyAc-tivity3D dataset. . . 30
1.14 Some example images from the SUN RGB-D dataset . . . 31
1.15 Selected examples of RGB images in Caltech-256 dataset. . . 31
1.16 Selected examples of RGB images in Scene-15 dataset. . . 32
2.1 Illustration about two experimental procedures used in our evaluation work. 38 2.2 Confusion matrixes about three deep learning models on the 2D&3D dataset 40 2.3 Confusion matrix about CNNs on Object RGB-D Dataset . . . 41
3.2 Example of an MST . . . 61 3.3 Example of an overlap region obtained by L3 . . . 62 3.4 Example of adherence subsets required to describe the class boundary
be-tween two classes . . . 64 3.5 The flow chart of the extraction procedure of our complexity feature vector 65 3.6 The flow chart of hyper-parameter optimization framework . . . 66 3.7 The figure shows the distance among the complexity feature vectors of
ex-perimental datasets . . . 69
4.1 Human vision system for scene classification in a natural environment . . . 78 4.2 The flow chart of the proposed pipeline . . . 79 4.3 Example images about RGB-D region proposals from the SUN RGB-D
dataset and the NYU Depth v1 dataset . . . 83 4.4 Some examples of the Jet encoded images from SUN RGB-D dataset . . . 86 4.5 Confusion matrix about our method on the NYU Depth v1 dataset . . . 91 4.6 Confusion matrix about our method on the SUN RGB-D dataset . . . 93 4.7 Recognition accuracies with different screening ratios on NYU Depth v1
and SUN RGB-D. . . 95 4.8 Recognition accuracies with different number of clusters on NYU Depth v1
and SUN RGB-D. . . 96
5.1 The flow chart shows the difference between our fusion method and tradi-tional fusion methods. . . 100 5.2 Some random example images from 8 different scenes . . . 104 5.3 Examples of two pairs of RGB-D images byC-SIFT . . . 109 5.4 Confusion matrix about our fusion method result on NYU Depth v1 dataset 112 5.5 Confusion matrix about our fusion method results on SUN RGB-D v1 dataset113
6.1 The outline of the aVDE . . . 116 6.2 Samples from the shared latent space and the projected target domain . . . 119 6.3 Example images with highest accuracy results from five selected dataset pairs.131
List of figures xv
6.4 Parameter sensitivity analysis on the considered datasets with the shallow and deep features. . . 134
List of tables
1.1 The difference between Kinect for windows v1 and Kinect for windows v2. 7
1.2 Comparison between the Kinect Windows SDK and unofficial SDK. . . 10
1.3 The summary of RGB-D dataset categories . . . 11
1.4 The characteristics of the selected 46 RGB-D datasets. . . 14
1.5 The characteristics of the selected 46 RGB-D datasets. . . 15
1.6 The characteristics of the selected 46 RGB-D datasets. . . 16
1.7 A categorization of the deep learning methods and their representative works 18 2.1 The final comparison results between neural-network classifier and SVM on the 2D&3D object dataset . . . 39
2.2 Hyper-parameters about DBNs experiments on the 2D&3D dataset. . . 39
2.3 Hyper-parameters about SDAE experiments on the 2D&3D dataset. . . 39
2.4 Hyper-parameters about CNNs experiments on the 2D&3D dataset. . . 40
2.5 The final comparison results between neural-network classifier and SVM on Object RGB-D dataset . . . 42
2.6 Hyper-parameters about DBNs experiments on Object RGB-D dataset. . . . 42
2.7 Hyper-parameters about SDAE experiments on Object RGB-D dataset. . . . 42
2.8 Hyper-parameters about CNNs experiments on Object RGB-D dataset. . . . 43
2.9 The performance comparison results between neural-network classifier and SVM on NYU Depth v1 dataset . . . 43
2.10 Hyper-parameters about DBNs experiments on NYU Depth v1 dataset. . . . 45
2.11 Hyper-parameters about SDAE experiments on NYU Depth v1 dataset. . . 45
2.12 Hyper-parameters about CNNs experiments on NYU Depth v1 dataset. . . . 45
2.13 The performance comparison results between neural-network classifier and SVM on SKIG dataset . . . 46
2.14 Hyper-parameters about DBNs experiments on SKIG dataset. . . 46
2.15 Hyper-parameters about SDAE experiments on SKIG dataset. . . 48
Dataset. . . 51
2.22 Hyper-parameters about LSTM experiments on MSRDailyActivity3D dataset. 51 3.1 Complexity measures on experimental datasets . . . 69
3.2 The chosen hyper-parameters of DBN, SDAE and CNNs on six datasets . . 71
3.3 The performance of each hyper-parameter set of DBN on six datasets . . . 72
3.4 The performance of each hyper-parameter set of SDAE on six datasets . . . 72
3.5 The performance of each hyper-parameter set of CNNs on six datasets . . . 73
4.1 Region proposal weight distribution. . . 85
4.2 The comparison results of our method and other published methods on the NYU Depth v1 dataset. . . 90
4.3 The comparison results of our method and other published methods on the Sun RGB-D dataset. . . 92
4.4 The comparison results of global methods and our method on the NYU Depth v1 dataset and the SUN RGB-D dataset. . . 94
4.5 Evaluation results of ablation studies on NYU Depth v1 and SUN RGB-D datasets. . . 95
4.6 Comparison of different depth encoding methods on NYU Depth v1 and SUN RGB-D datasets. . . 97
5.1 Scene classification performance on NYU Depth v1 dataset . . . 111
5.2 Scene classification performance on SUN RGB-D dataset . . . 112
6.1 Notations and descriptions. . . 120
6.2 Accuracies (%) for object recognition and scene classification with shallow and deep features (bold numbers indicate the best results). . . 132
Chapter 1
Introduction and Literature Review
1.1
Introduction
In the past decades, there has been abundant computer vision research based on RGB im-ages [2] [243] [45]. However, RGB imim-ages usually only provide the appearance information of the objects in the scene. With this limited information provided by RGB images, it is ex-tremely difficult, if not impossible, to solve certain problems such as the partition of the foreground and background having similar colors and textures. Additionally, the objec-t appearance described by RGB images is noobjec-t robusobjec-t againsobjec-t common variaobjec-tions, such as illuminance change, which significantly impedes the usage of RGB based vision algorithms in realistic situations. While most researchers are struggling to design more sophisticated algorithms, another stream of the research turns to find a new type of representation that can better perceive the scene. RGB-D image/video is an emerging data representation that is able to help solve fundamental problems due to its complementary nature of the depth information and the visual (RGB) information. Meanwhile, it has been proved that com-bining RGB and depth information in high-level tasks (e.g., image/video classification) can dramatically improve the classification accuracy [248] [247].
The core of the RGB-D image/video is the depth image, which is usually generated by a range sensor. Compared to a 2D intensity image, a range image is robust to the variations in color, illumination, rotation angle and scale [51]. Early range sensors (such as Konica Minolta Vivid 910, Faro Lidar scanner, Leica C10 and Optech ILRIS-LR) are expensive and difficult to use for researchers in a human environment. Therefore, there is not much follow-up research at that time. However, with the release of the low-cost3D Microsoft Kinect sensor1 on 4th November 2010, acquisition of RGB-D data becomes cheaper and
datasets is not only able to save time and resources for researchers, but also enables a fair comparison of different algorithms.
In this thesis, we firstly briefly review the background, hardware and software informa-tion about Microsoft Kinect, recent important RGB-D datasets, four deep learning models and the detailed dataset introduction used in our research in the following sections in this chapter. Then we solve the problems in RGB-D areas: performance of deep learning mod-els in RGB-D datasets, hyper-parameter optimization, RGB-D data fusion and recognizing RGB information from RGB-D data in Chapter 2, 3, 4, 5 and 6. More specifically, the evaluation and developed new methods about RGB-D data for solving these five different problems are as follows:
Summary of Remaining Chapters
Chapter 2: Classification Performance of Deep Learning Models on RGB-D Image/Video Datasets. Since Deep Neural Networks for image/video classification have obtained much success in various computer vision applications and high-quality RGB-D data can be easily acquired and used to enhance computer vision algorithms [94], this chapter aims to inves-tigate how deep learning can be employed for extracting and fusing features from RGB-D data. In this chapter, we choose four prevalent deep learning models (i.e., Deep Belief Networks (DBNs), Stacked Denoising Auto-Encoders (SDAE), Convolutional Neural Net-works (CNNs) and Long Short-Term Memory (LSTM) Neural NetNet-works). Then we conduct extensive experiments on five popular RGB-D datasets including three image datasets and two video datasets. We then present a detailed analysis of the comparison between the learned feature representations from the four deep learning models. In addition, a few sug-gestions on how to adjust hyper-parameters for learning deep neural networks are made in this chapter. According to the extensive experimental results, we believe that this evaluation will provide insights and a deeper understanding of different deep learning algorithms for RGB-D feature extraction and fusion.
Chapter 3: Hyper-parameter Optimization via Classification Complexity Assessment.
Following the work in Chapter 2, we observe that the performances of many machine learn-ing methods vary significantly with different sets of hyper-parameters especially for
com-1.1 Introduction 3
plex models, such as DBN, SDAE, CNNs and other deep learning models, which always have tens to hundreds of hyper-parameters. More specifically, achieving the best perfor-mance with many machine learning methods depends critically on model hyper-parameter optimization. However, this optimization, which requires strong expertise, is often a “black magic” especially on deep learning models. Currently, the widely used classic methods such as random search, grid search and manual search are computationally expensive and unprac-tical. They have to face the same challenge about how to choose the initial set of trials from random hyper-parameter permutation and combination. In this chapter, we present a simple and efficient framework for improving the efficiency and accuracy of hyper-parameter opti-mization by considering the classification complexity of a particular dataset. Through this framework, we can quickly choose an initial set of hyper-parameters that are suitable for a new classification task, thus reducing the number of trials in the hyper-parameter space. Re-sults on six real-world datasets using three representative deep learning models demonstrate the effectiveness of our framework for hyper-parameter optimization.
Chapter 4: Feature Learning for RGB-D Scene Classification. Besides the performance evaluation and hyper-parameter optimization through the utilization of RGB-D datasets, a new Convolutional Neural Networks (CNNs)-based local multi-modal feature learning framework (LM-CNN) for RGB-D scene classification is also proposed. LM-CNN is dif-ferent from most of the past deep learning methods which are proposed for RGB-D scene classification use global information and directly consider all pixels in the whole image for high-level tasks. Such past deep learning methods cannot hold much information about lo-cal feature distribution, and simply concatenate RGB and depth features without exploring the correlation and complementarity between raw RGB and depth images. From the hu-man vision perspective, we recognize the category of one unknown scene mainly relying on the object-level information which includes appearance, texture, shape and depth of each object and the structural distribution of different objects. Based on this observation, con-structing mid-level representations with discriminative object parts would generally be more attractive for scene analysis. In this chapter, our proposed LM-CNN for RGB-D scene clas-sification can effectively capture much of the local structure from the RGB-D scene images and automatically learn a fusion strategy for the object-level recognition step instead of sim-ply training a classifier on top of features extracted from both modalities. The experimental results on two popular datasets,i.e.,NYU v1 depth dataset and SUN RGB-D dataset, show that our method with local multi-modal CNNs outperforms state-of-the-art methods.
Chapter 5: RGB-D Data Fusion in Complex Space. Different from the method which automatically learns a fusion strategy for the object-level recognition step in Chapter 4, we project the RGB and depth data into a complex space and make the fusion strategy at the
plex space and then jointly extract features from the fused RGB-D images. The advantages of the proposed fusion method are verified from three aspects: mutual information and in-dependence, feature distribution and Euclidean KS-distance to uniformity. Meanwhile, we modify the classical SIFT to complex-valued SIFT (C-SIFT) to evaluate our fusion method. Besides, some traditional algorithms and deep learning models can also be generalized for this fusion method. Consequently, the correlated and individual parts of the RGB-D infor-mation in the new feature space are well combined. Experimental results on two widely used RGB-D scene datasets show that our proposed RGB-D fusion method can achieve competing performance against the classical fusion methods. Our fusion method is valuable for other researchers who are exploring better features.
Chapter 6: Recognizing RGB Information from RGB-D data.Though the feature learn-ing and RGB-D fusion methods have been proposed in Chapter 4 and Chapter 5, we still need to explore how to recognize RGB images captured by conventional surveillance cam-eras through leveraging a set of labeled RGB-D data. Recognizing RGB Information from RGB-D data is a promising application, which significantly reduces the cost while can still retain high recognition rates [116] [37] [111]. However, existing methods still suffer from the domain shifting problem due to conventional surveillance cameras and depth sensors are using different mechanisms. In this chapter, we aim to simultaneously solve the above two challenges: 1) how to use the additional depth information in the source domain? 2) how to reduce the data distribution mismatch between the source and target domains? We propose a novel method called adaptive Visual-Depth Embedding (aVDE) which learns the compact shared latent space between two representations of labeled RGB and depth modalities in the source domain first. Then the shared latent space can help the transfer of the depth informa-tion to the unlabeled target dataset. At last, aVDE models two separate learning strategies for domain adaptation (feature matching and instance reweighting) in a unified optimization problem, which matches features and reweights instances jointly across the shared latent space and the projected target domain for an adaptive classifier. We test our method on two pairs of datasets for object recognition and scene classification, the results of which demonstrate the effectiveness of our proposed method.
contri-1.2 A Brief Review of Kinect 5
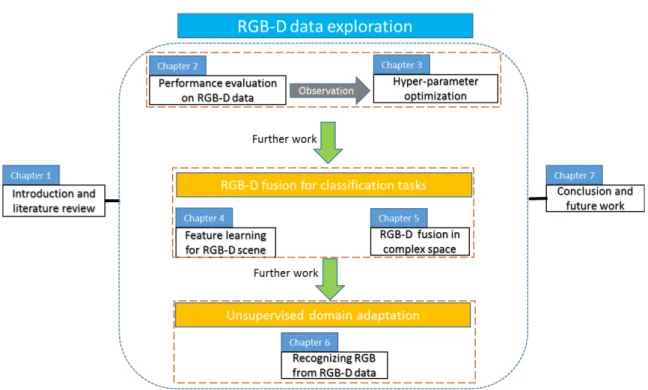
Fig. 1.1 The main studies and the correlation of all chapters carried out in this thesis. Ac-cording to the RGB-D data exploration, all studies are explored further step by step: per-formance evaluation and hyper-parameter optimization (Chapters 2, 3), RGB-D fusion for classification tasks (Chapters 4, 5) and unsupervised domain adaptation on RGB-D data (Chapters 6).
butions of above work and discuss the future research directions.
For further explaining on the correlation between chapters and promoting a holistic un-derstanding about this thesis, the main studies and correlation of all chapters are organized into Fig. 1.1.
1.2
A Brief Review of Kinect
In the past years, as a new type of scene representation, RGB-D data acquired by the consumer-level Kinect sensor or other similar sensors has shown the potential to solve chal-lenging problems for computer vision. In this section, we select Kinect sensor as the core of the review. The reasons can be summarized as: 1) The hardware sensor as well as the soft-ware package of Kinect are released by Microsoft in November 2010, which makes Kinect sensor as the first released low-cost RGB-D sensor with powerful features. 2) Kinect sensor as the most representative RGB-D camera has a vast of sales until now. 3) Most RGB-D datasets are created in a time range from 2011 to 2017. The comparison of RGB-D
dataset-Fig. 1.2 Illustration of the structure and internal components of the Kinect sensor. Two example images from RGB and depth sensors are also displayed to show their differences.
s (from Table 1.4 to Table 1.6) shows that almost all of the datasets choose Kinect v1 or Kinect v2 as the related devices. Meanwhile, all of the selected datasets in our experiments are based on Kinect sensor.
At the beginning, Kinect acts as an Xbox accessory, enabling players to interact with the Xbox 360 through body language or voice instead of the usage of an intermediary device, such as a controller. Later on, due to its capability of providing accurate depth informa-tion with relatively low cost, the usage of Kinect goes beyond gaming, and is extended to the computer vision field. This device equipped with intelligent algorithms is contributing to various applications, such as 3D-simultaneous localization and mapping (SLAM) [109] [153], people tracking [190], object recognition [21] and human activity analysis [163] [38], etc. In this subsection, we introduce Kinect from two perspectives: hardware configuration and software tools.
1.2.1
Kinect Hardware Configuration
Generally, the basic version of Microsoft Kinect consists of a RGB camera, an infrared camera, an IR projector, multi-array microphone [138] and motorized tilt. Fig. 1.2 shows the components of Kinect and two example images captured by RGB and depth sensors, respectively. The distance between objects and the camera is ranging from 1.2 meters to 3.5 meters. Here, RGB camera is able to provide the image with the resolution of 640×480 pixels at 30 Hz. This RGB camera also has option to produce higher resolution images (1280×1024 pixels), running at 10Hz. The angular field of view is 62 degrees
horizontal-1.2 A Brief Review of Kinect 7
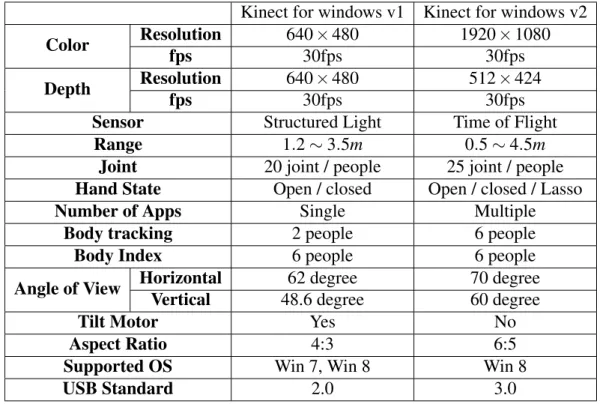
ly and 48.6 degrees vertically. Kinect’s 3D depth sensor (infrared camera and IR projector) can provide depth images with the resolution of 640×480 pixels at 30 Hz. The angular field of this sensor is slightly different with that of the RGB camera, which is 58.5 degrees horizontally and 46.6 degrees vertically. In the application such asNUI(Natural User Inter-face), multi-array microphone can be available for a live communication through acoustic source localization of Xbox 360. This microphone array actually consists of four micro-phones, and the channels of which can process up to 16-bit audio signals at a sample rate of 16kHz. Following Microsoft, Asus launched Xtion Pro Live2, which has more or less the same features with Kinect. In July 2014, Microsoft released the second generation Kinect: Kinect for windows v23. The difference between Kinect v1 and Kinect v2 can be seen in Table 1.1.
Table 1.1 The difference between Kinect for windows v1 and Kinect for windows v2. Kinect for windows v1 Kinect for windows v2
Color Resolution 640×480 1920×1080
fps 30fps 30fps
Depth Resolution 640×480 512×424
fps 30fps 30fps
Sensor Structured Light Time of Flight
Range 1.2∼3.5m 0.5∼4.5m
Joint 20 joint / people 25 joint / people
Hand State Open / closed Open / closed / Lasso
Number of Apps Single Multiple
Body tracking 2 people 6 people
Body Index 6 people 6 people
Angle of View Horizontal 62 degree 70 degree
Vertical 48.6 degree 60 degree
Tilt Motor Yes No
Aspect Ratio 4:3 6:5
Supported OS Win 7, Win 8 Win 8
USB Standard 2.0 3.0
In general, the technology used for generating the depth map is based on analyzing the speckle patterns of infrared laser light. The method is patented by PrimeSense [74]. For more detailed introductions, I refer to [78].
2http://www.asus.com, Asus Corporation, Xtion Pro Live
3http://www.xbox.com/en-GB/xbox-one/accessories/kinect, Microsoft Corporation, Kinect v2
facial tracking, 3-D scanning and so on, each library has its own characteristics. For exam-ple, CL NUI Platform developed by NUI researchers can obtain the data from RGB camera, depth sensor and accelerometer. Open Kinect focuses on providing free and open source libraries, enabling researchers to use Kinect over Linux, Mac and Windows. OpenNI is an industry-led open source library which can program RGB-D device for NUI applications. It is not specifically built for Kinect, and it can support multiple PrimeSense 3D sensors. Normally, users need to install SensorKinect, NITE, and OpenNI to control the Kinect sen-sor, where SensorKinect is the driver of Kinect and NITE is the middleware provided by PrimeSense. The latest version of OpenNI is version 2.2.0.33 until March 2017. The Point Cloud Library (PCL) is a standalone open source library which provides SLAM-related tools such as surface reconstruction, sample consensus, feature extraction, and visualization for RGB-D SLAM. It is licensed by Berkeley Software Distribution (BSD). More details and publications about PCL can be found in [204].
The official version of Kinect for Windows SDK8was released in July 2011, which pro-vides a straightforward access to Kinect data: depth, color and disparity. The newest version is SDK 2.0. It can be applied for Windows 7, Windows 8, Windows 8.1 and Windows Em-bedded 8 with C++, C# or VB.NET. The development environment uses Visual Studio 2010 or higher versions. Regarding the software tool, it mainly contains skeletal tracking, higher depth fidelity, audio processing and so on.
The comparison of Kinect Windows SDK and unofficial SDK, e.g., OpenNI, can be summarized below. The detailed same and difference between the Kinect Windows SDK and unofficial SDK can be seen in Table 1.2.
Kinect Windows SDK:
1)It supports audio signal processing and allows to adjust the motor angle.
2)It provides a full-body tracker including head, feet, hands and clavicles. Mean-while, some details such as occluded joints are processed meticulously.
4http://codelaboratories.com/kb/nui, CL NUI Platform [Online]. 5https://github.com/OpenKinect/libfreenect/, OpenKinect [Online]. 6http://www.openni.ru/, OpenNI [Online].
7http://www.pointclouds.org/, PCL [Online].
1.3 RGB-D Benchmark Datasets 9
3)Multiple sensors can be supported. OpenNI/NITE library:
1)Commercial use of OpenNI is allowed.
2)Frameworks for hand tracking and hand-gesture recognition are included in Open-NI. Moreover, it automatically aligns the depth image and the color image.
3)It consumes less CPU power than that of Kinect Windows SDK.
4)It supports Windows, Linux and Mac OSX. In addition, streaming the raw Infrared video data becomes possible.
In conclusion, the most attractive advantage of OpenNI is the feasibility for multiple op-erational platforms. Besides it, using OpenNI is more convenient and can obtain better re-sults for the research of colored point clouds. However, in terms of collection quality of the original image and the technology for pre-processing, Kinect for Windows SDK seems to be more stable. Moreover, Kinect for Windows SDK is more advantageous when requiring skeletal tracking and audio processing.
1.3
RGB-D Benchmark Datasets
Since the Kinect sensor was just released a few years ago, most RGB-D datasets are created in a time range from 2011 to 2017. Different from the traditional RGB datasets, RGB-D dataset not only has RGB data but also depth data. To have a clear structure, we divide the RGB-D datasets into 5 categories depending on the facilitated computer vision applications. More specifically, the reviewed datasets fall into object detection and tracking, human activ-ity analysis, object and scene recognition, SLAM and hand gesture analysis. However, each dataset may not be limited to one specific application only. For example, object RGB-D can be used in detection as well. Table 1.3 illustrates a summary of these 5 categories.
1.3.1
RGB-D Datasets for Object Detection and Tracking
Object detection and tracking is one of the fundamental research topics in computer vision [233] [67]. It is an essential building-block of many intelligent systems. As we mentioned before, the depth information of an object is immune to changes of the object appearance or/and environmental illumination, and subtle movements of the background. With the availability of the low-cost Kinect depth camera, researchers immediately noticed that the feature descriptor based on depth information can help significantly detect and track the object in the real world where all kinds of variations occur. Therefore, RGB-D based object
Development
language C++, C# C, C++, C#, Java
Commercial use No Yes
Supports for audio
and motor/tilt Yes No
Supports multiple
sensors Yes No
Consumption of
CPU power More Less
Includes head, hands, feet, clavicles No head, hands, feet, clavicles Full body tracking Calculates positions for the joints,
but not rotations
Calculates both positions and rotations for the joints Only tracks the full body,
no hands only mode Supports for hands only mode Supports for Unity3D
game engine No Yes
Supports for record/
playback to disk No Yes
Supports to stream the
raw InfraRed video data No Yes
detection and tracking have attracted great attention in recent a few years. As a result, many datasets are created for evaluating proposed algorithms [232] [222].
1.3.2
Human Activity Analysis
The usage of RGB-D data opens up more opportunities to solve human activity analy-sis problems [161] [271]. Algorithms which combine RGB information and depth data can effectively increase the accuracy of activity recognition in a cluttered and illumination changed background.
1.3.3
Object and Scene Recognition
Object and scene recognition is a fundamental problem which aims to provide the infor-mation whether the image contains the object [296] [263]. In the real world environment,
1.3 RGB-D Benchmark Datasets 11
Table 1.3 The summary of RGB-D dataset categories. It includes RGB-D People dataset [235], TUM Texture-Less dataset [97], object segmentation dataset (OSD) [202], object discovery dataset [176], Princeton tracking benchmark dataset (PTB) [232], Berkeley 3-D object dataset (B3DO) [119], NYU (New York University) depth V1 and V2 dataset [222], object dataset [144], Biwi head pose dataset [64], UR (University of Rzeszow) fall de-tection dataset [142], MSRDailyActivity3D (Microsoft research Activity3D) dataset [265], RGB-D person re-identification dataset [11], Kinect FaceDB [180], Big BIRD (Berkeley In-stance Recognition dataset) [225], High Resolution Range based Face dataset (HRRFaceD) [172], TUM (University of Technology Munich) dataset [239], ICL-NUIM (Imperial Col-lege London and National University of Ireland Maynooth) dataset [95], Microsoft Research Cambridge-12 (MSRC-12) Kinect Gesture dataset [71], Sheffield Kinect Gesture (SKIG) dataset [163] and 50 Salads Dataset [238].
RGB-D benchmark datasets
Object detection and tracking
Human activity analysis
Object and scene
recognition SLAM
Hand gesture analysis
People [235] Biwi head pose [64] Object [144] TUM [239] MSRC-12 Gesture [71] TUM Texture-Less [97] UR fall detection [142] NYU depthV1 and V2[222] ICL-NUIM [95] SKIG [163] Object segmentation [202] MSRDailyActivity3D [265] B3DO [119] 50 Salads [238]
Object discovery [176] Person
re-identification[11]
PTB [232] Kinect FaceDB [180]
B3DO [119] Big BIRD [225]
NYU depth
V1 and V2[222] HRRFaceD [172]
1.3.4
Simultaneous Localization and Mapping (SLAM)
The general problem of SLAM for both camera trajectory recovering and the map generation from sensor data attracts great attention from scientists in computer vision and robotics [288] [213]. Several datasets and benchmarks have been created for RGB-D based SLAM systems [239] [95]. However, how to provide an optimal up-to-date representation of the map in real-time is still a challenge.
1.3.5
Hand Gesture Analysis
In recent years, the research of hand gesture analysis from RGB-D sensors develops quickly, because it can facilitate a wide range of applications in human computer interaction, human robot interaction and pattern analysis [31] [40]. Compared to human activity analysis, hand gesture analysis does not need to deal with the dynamics from other body parts but only fo-cuses on the hand region. On the one hand, the focus on the hand area only helps to increase the analysis accuracy. On the other hand, it also reduces the complexity of the system, thus enabling real-time applications. Basically, a hand gesture analysis system covers three com-ponents: hand detection and tracking, hand pose estimation and gesture classification. Since situations like occlusions, different illumination conditions and skin color affect the results of hand gesture analysis, improving the recognition accuracy of unconstrained human hand motions still needs a lot of efforts.
1.3.6
Comparison of RGB-D datasets
In this subsection, the comparison of RGB-D datasets is conducted from several aspects. For easy access, all the datasets are ordered alphabetically in three tables (from Table 1.4 to Table 1.6). If the dataset name starts with a digital number, it is ranked numerical-ly following all the datasets which starts with English letters. For more comprehensive comparisons, besides these 20 mentioned datasets in Table 1.3, another 26 extra RGB-D datasets for different applications are also added into the tables: Birmingham University Objects, Category Modeling D [289], Cornell Activity [240] [132], Cornell
RGB-1.3 RGB-D Benchmark Datasets 13
D [131], DGait [22], Daily Activities with occlusions [1], Heidelberg University Scenes [178], Microsoft 7-scenes [221], MobileRGBD [256], MPII Multi-Kinect [241], MSR Ac-tion3D Dataset [265], MSR 3D Online Action [284], MSRGesture3D [140], DAFT [86], Pa-per Kinect[197], RGBD-HuDaAct [188], Stanford Scene Object [127], Stanford 3D Scene [295], Sun3D [274], SUN RGB-D [231], TST Fall Detection [75], UTD-MHAD [36], Vien-na University Technology Object [3], Willow Garage [269], Workout SU-10 exercise [186] and 3D-Mask [62]. In addition, we name those datasets without original names by means of creation place or applications. For example, I name the dataset in [178] as Heidelberg University Scenes.
Let us now explain these tables. The first and second columns in the tables are always the serial numbers and the names of the dataset. Table 1.4 shows some features including the authors of the datasets, the year of the creation, the published papers describing the dataset, the related devices, data size and number of references related to datasets. The au-thor (the third column) and the year (the forth column) are collected directly in the datasets or are found in the oldest publication related to the dataset. The cited references in the fifth column contain the publications which elaborate the corresponding dataset. Data size (the seventh column) refers to the size of all information, such as the RGB and depth infor-mation, camera trajectory, ground truth and accelerometer data. For a scientific evaluation about these datasets, the comparison of number of citation is added into Table 1.4. A part of these statistical numbers are derived from the number of papers which use related dataset as benchmark. The rest are from the papers which do not directly use these datasets but mention these datasets in their published papers. It is noted that the numbers are roughly es-timated. It can be easily seen from the table that the datasets with longer history [131] [239] [144] always have more related references than those of new datasets [289] [127]. Partic-ularly, Cornell Activity, MSR Action3D Dataset, MSRDailyActivity3D, MSRGesture3D, Object RGB-D, People, RGBD-HuDaAct, TUM and NYU Depth V1 and V2 all have more than 100 citations. However, it does not necessarily mean that the old datasets are better than the new ones.
Table 1.5 presents the following information: the intended applications of the datasets, label information, data modalities and the number of the activities or objects or scenes along with the datasets. The intended applications (the third column) of the datasets are divided into five categories. However, each dataset may not be limited to one specific application only. For example, object RGB-D can be used in detection as well. The label information (the forth column) is valuable because it aids in the process of annotation. The data modal-ities (the fifth column) include color, depth, skeleton and accelerometer, which are helpful for researchers to quickly identify the datasets especially when they work on multi-modal
2 Birmingham University
Objects Krzysztof Walas et al. 2014 No Kinect v2 Unknown Unknown
3 Biwi Head Pose Fanelli et al. 2013 [64] Kinect v1 5.6G 88
4 B3DO Allison Janoch et al. 2011 [119] Kinect v1 793M 96
5 Category Modeling
RGB-D Quanshi Zhang et al. 2013 [289] Kinect v1 1.37G 4
6 Cornell Activity Jaeyong Sung et al. 2011 [240] Kinect v1 44G >100
7 Cornell RGB-D Abhishek Anand et al. 2011 [131] Kinect v1 ≈7.6G 60
8 DAFT David Gossow et al. 2012 [86] Kinect v1 207M 2
9 Daily Activities
with occlusions Abdallah DIB et al. 2015 [1] Kinect v1 6.2G 0
10 DGait Ricard Borrs et al. 2012 [22] Kinect v1 9.2G 7
11 Heidelberg University
Scenes Stephan Meister et al. 2012 [178] Kinect v1 3.3G 24
12 HRRFaceD Tomás Mantecón et al. 2014 [172] Kinect v2 192M Unknown
13 ICL-NUIM A. Handa et al. 2014 [95] Kinect v1 18.5G 3
14 Kinect FaceDB Rui Min et al. 2012 [180] Kinect v1 Unknown 1
15 Microsoft 7-scenes Antonio Criminisi et al. 2013 [221] Kinect v1 20.9G 10
16 MobileRGBD Dominique Vaufreydaz et al. 2014 [256] Kinect v2 Unknown Unknown
17 MPII Multi-Kinect Wandi Susanto et al. 2012 [241] Kinect v1 15G 11
18 MSRC-12 Gesture Simon Fothergill et al. 2012 [71] Kinect v1 165M 83
19 MSR Action3D Dataset Jiang Wang et al. 2012 [265] Similar to Kinect 56.4M >100
20 MSRDailyActivity3D Zicheng Liu et al. 2012 [265] Kinect v1 3.7M >100
21 MSR 3D Online Action Gang Yu et al. 2014 [284] Kinect v1 5.5G 9
22 MSRGesture3D Alexey Kurakin et al. 2012 [140] Kinect v1 28M 94
23 NYU Depth V1 and V2 Nathan Silberman et al. 2011 [222] Kinect v1 520G >100
24 Object RGB-D Kevin Lai et al. 2011 [144] Kinect v1 84G >100
25 Object Discovery Julian Mason et al. 2012 [176] Kinect v1 7.8G 8
26 Object Segmentation A. Richtsfeld et al. 2012 [202] Kinect v1 302M 28
27 Paper Kinect F. Pomerleau et al. 2011 [197] Kinect v1 2.6G 32
28 People L. Spinello et al. 2011 [235] Kinect v1 2.6G >100
29 Person Re-identification B. I. Barbosa, M et al. 2012 [11] Kinect v1 Unknown 37
30 PTB Shuran Song et al. 2013 [232] Kinect v1 10.7G 12
31 RGBD-HuDaAct Bingbing Ni et al. 2011 [188] Kinect v1 Unknown >100
32 SKIG L. Liu et al. 2013 [163] Kinect v1 1G 35
33 Stanford Scene Object Andrej Karpathy et al. 2014 [127] Xtion Pro Live 178.4M 29
34 Stanford 3D Scene Qian-Yi Zhou et al. 2013 [295] Xtion Pro Live ≈33G 15
35 Sun3D Jianxiong Xiao et al. 2013 [274] Xtion Pro Live Unknown 16
36 SUN RGB-D S. Song et al. 2015 [231] Kinect v1, Kinect v2,etc. 6.4G 8
37 TST Fall Detection S. Gasparrini et al. 2015 [75] Kinect v2 12.1G 25
38 TUM J. Sturm et al. 2012 [239] Kinect v1 50G >100
39 TUM Texture-less S Hinterstoisser et al. 2012 [97] Kinect v1 3.61G 26
40 UR Fall Detection Michal Kepski et al. 2014 [129] Kinect v1 ≈5.75G 2
41 UTD-MHAD Chen Chen et al. 2015 [36] Kinect v1 and Kinect v2 ≈1.1G 3
42 Vienna University
Technology Object Aitor Aldoma et al. 2012 [3] Kinect v1 81.4M 19
43 Willow Garage Aitor Aldoma et al. 2011 [269] Kinect v1 656M Unknown
44 Workout SU-10 exercise F Negin et al. 2013 [186] Kinect v1 142G 13
45 3D-Mask N Erdogmus et al. 2013 [62] Kinect v1 Unknown 18
1.3 RGB-D Benchmark Datasets 15
Table 1.5 The characteristics of the selected 46 RGB-D datasets.
No. Name Intended applications Label information modalitiesData Number ofcategories
1 Big BIRD Object and scene recognition Masks, ground truth poses,registered mesh Color, depth 125 objects
2 Birmingham University
Objects Object detection and tracking The model into the scene Color, depth 10 to 30 objects
3 Biwi Head Pose Human activity analysis 3D position and rotation Color, depth 20 objects
4 B3DO Object detection and trackingObject and scene recognition Bounding box labelingat a class level Color, depth and 75 scenes50 objects
5 Category Modeling
RGB-D
Object and scene recognition
Object detection and tracking Edge segments Color, depth
900 objects and 264 scenes
6 Cornell Activity Human activity analysis Skeleton joint position and orientationon each frame Color, depthskeleton 120+ activities
7 Cornell RGB-D Object and scene recognition Per-point object-level labeling Color, depth, accelerometer
24 office scenes and 28 home scenes
8 DAFT SLAM Camera motion type, 2D homographies Color, depth Unknown
9 Daily Activities
with occlusions Human activity analysis
Position markers of the 3D joint location from a MoCap system
Color, depth,
skeleton Unknown
10 DGait Human activity analysis Subject, gender, age andan entire walk cycle Color, depth 11 activities
11 Heidelberg University
Scenes SLAM
Frame-to-frame transformations and
LiDAR ground truth Color, depth 57 scenes
12 HRRFaceD Object and scene recognition No Color, depth 22 subjects
13 ICL-NUIM SLAM Camera trajectories for each video.Geometry of the scene Color, depth 2 scenes
14 Kinect FaceDB Object and scene recognition The position of six facial landmarks Color, depth 52 objects
15 Microsoft 7-scenes SLAM 6DOF ground truth Color, depth 7 scenes
16 MobileRGBD SLAM speed and trajectory Color, depth 1 scene
17 MPII Multi-Kinect Object detection and tracking Bounding box and polygons Color, depth 10 objects and 33 scenes
18 MSRC-12 Gesture Hand gesture analysis Gesture, motion tracking of human joint locations
Color, depth,
skeleton 12 gestures
19 MSR Action3D Dataset Human activity analysis Activity being performed and 20 joint locations of skeleton positions
Color, depth,
skeleton 20 actions
20 MSRDailyActivity3D Human activity analysis Activity being performed and 20 joint locations of skeleton positions
Color, depth,
skeleton 16 activities
21 MSR 3D Online Action Human activity analysis Activity in each video Color, depth,
skeleton 7 activities
22 MSRGesture3D Hand gesture analysis Gesture in each video Color, depth 12 activities
23 NYU Depth V1 and V2 Object and scene recognition
Object detection and tracking Dense multi-class labeling
Color, depth,
accelerometer 528 scenes
24 Object RGB-D Object and scene recognition
Object detection and tracking Auto-generated masks Color, depth
300 objects and scenes
25 Object Discovery Object detection and tracking Ground truth object segmentations Color, depth 7 objects
26 Object Segmentation Object detection and tracking Per-pixel segmentation Color, depth 6 categories
27 Paper Kinect SLAM 6DOF ground truth Color, depth 3 scenes
28 People Object detection and tracking Bounding box annotations and a
‘visibility’ measure Color, depth Multiple people
29 Person Re-identification Object and scene recognition
Foreground masks, skeletons, 3D meshes and an estimate of the floor
Color, depth 79 people
30 PTB Object detection and tracking Bounding box covering target object Color, depth 3 types and 6 scenes
31 RGBD-HuDaAct Human activity analysis Activities being performed in
each sequence Color, depth 12 activities
32 SKIG Hand gesture analysis The gesture is performed Color, depth 10 gestures
33 Stanford Scene Object Object detection and tracking Ground truth binary labeling Color, depth 58 scenes
34 Stanford 3D Scene SLAM Estimated camera pose Color, depth 6 scenes
35 Sun3D Object detection and tracking Polygons of semantic classand instance labels Color, depth 254 scenes
36 SUN RGB-D Object detection and trackingObject and scene recognition Dense semantic Color, depth 19 scenes
37 TST Fall Detection Human activity analysis Activity performed, acceleration data and skeleton joint locations
Color, depth, skeleton, accelerometer
2 categories
38 TUM SLAM 6DOF ground truth Color, depth,
accelerometer 2 scenes
39 TUM Texture-less Object detection and tracking 6DOF pose Color, depth 15 objects
40 UR Fall Detection Human activity analysis Accelerometer data Color, depth,
accelerometer 66 falls
41 UTD-MHAD Human activity analysis Accelerometer data with each video
Color, depth, skeleton, accelerometer
27 actions
42 Vienna University
Technology Object Object and scene recognition 6DOF GT of each object Color, depth 35 objects
43 Willow Garage Object detection and tracking 6DOF pose, per-pixel labelling Color, depth 6 categories
44 Workout SU-10 exercise Human activity analysis Motion Files Color, depth,
skeleton 10 activities
45 3D-Mask Object and scene recognition Manually labeled eye positions Color, depth 17 people
46 50 salads Hand gesture analysis Accelerometer data and labeling of steps in the recipes
Color, depth,
2
Objects No No Yes http://www.cs.bham.ac.uk/~walask/SHREC2015/
3 Biwi Head Pose No No No https://data.vision.ee.ethz.ch/cvl/gfanelli/head_pose/head_forest.html#
4 B3DO No No No http://kinectdata.com/
5 Category Modeling
RGB-D No No No http://sdrv.ms/Z4px7u
6 Cornell Activity No No No http://pr.cs.cornell.edu/humanactivities/data.php
7 Cornell RGB-D Yes No No http://pr.cs.cornell.edu/sceneunderstanding/data/data.php
8 DAFT Yes No No http://ias.cs.tum.edu/people/gossow/rgbd
9 Daily Activities
with Occlusions No No NO https://team.inria.fr/larsen/software/datasets/
10 DGait No No No http://www.cvc.uab.es/DGaitDB/Download.html 11 Heidelberg University Scenes No No Yes http://hci.iwr.uni-heidelberg.de//Benchmarks/ document/kinectFusionCapture/ 12 HRRFaceD No No No https://sites.google.com/site/hrrfaced/
13 ICL-NUIM Yes No No http://www.doc.ic.ac.uk/~ahanda/VaFRIC/iclnuim.html
14 Kinect FaceDB No No Yes http://rgb-d.eurecom.fr/
15 Microsoft 7-scenes Yes No Yes http://research.microsoft.com/en-us/projects/7-scenes/
16 MobileRGBD Yes No Yes http://mobilergbd.inrialpes.fr//#RobotView
17 MPII Multi-Kinect No Yes No
https://www.mpi-inf.mpg.de/departments/computer-vision-
and-multimodal-computing/research/object-recognition-and-scene-understanding/mpii-multi-kinect-dataset/
18 MSRC-12 Gesture No No No http://research.microsoft.com/en-us/um/cambridge/projects/msrc12/
19 MSR Action3D Dataset No No No http://research.microsoft.com/en-us/um/people/zliu/actionrecorsrc/
20 MSRDailyActivity3D No No No http://research.microsoft.com/en-us/um/people/zliu/actionrecorsrc/
21 MSR 3D Online Action No No No http://research.microsoft.com/en-us/um/people/zliu/actionrecorsrc/
22 MSRGesture3D No No No http://research.microsoft.com/en-us/um/people/zliu/actionrecorsrc/
23 NYU Depth V1 and V2 Yes No No http://cs.nyu.edu/~silberman/datasets/nyu_depth_v1.html
http://cs.nyu.edu/~silberman/datasets/nyu_depth_v2.html
24 Object RGB-D No No No http://rgbd-dataset.cs.washington.edu/
25 Object Discovery Yes No No http://wiki.ros.org/Papers/IROS2012_Mason_Marthi_Parr
26 Object Segmentation No No No http://www.acin.tuwien.ac.at/?id=289
27 Paper Kinect Yes No No http://projects.asl.ethz.ch/datasets/doku.php?id=Kinect:iros2011Kinect
28 People No Yes No http://www2.informatik.uni-freiburg.de/~spinello/RGBD-dataset.html
29 Person Re-identification No No Yes http://www.iit.it/en/datasets-and-code/datasets/rgbdid.html
30 PTB Yes No No http://tracking.cs.princeton.edu/dataset.html
31 RGBD-HuDaAct No No Yes
http://adsc.illinois.edu/sites/default/files/files/ADSC-RGBD-dataset-download-instructions.pdf
32 SKIG No No No http://lshao.staff.shef.ac.uk/data/SheffieldKinectGesture.htm
33 Stanford Scene Object NO No No http://cs.stanford.edu/people/karpathy/discovery/
34 Stanford 3D Scene Yes No No https://drive.google.com/
folderview?id=0B6qjzcYetERgaW5zRWtZc2FuRDg&usp=sharing
35 Sun3D Yes No No http://sun3d.cs.princeton.edu/
36 SUN RGB-D No No No http://rgbd.cs.princeton.edu
37 TST Fall Detection No Yes No http://www.tlc.dii.univpm.it/blog/databases4kinect
38 TUM Yes Yes No http://vision.in.tum.de/data/datasets/rgbd-dataset
39 TUM Texture-less No No No http://campar.in.tum.de/Main/StefanHinterstoisser
40 UR Fall Detection No Yes No http://fenix.univ.rzeszow.pl/~mkepski/ds/uf.html
41 UTD-MHAD No No No http://www.utdallas.edu/~kehtar/UTD-MHAD.html
42 Vienna University
Technology Object No No No http://users.acin.tuwien.ac.at/aaldoma/datasets/ECCV.zip
43 Willow Garage No No No http://www.acin.tuwien.ac.at/forschung/v4r/mitarbeiterprojekte/willow/
44 Workout SU-10 exercise No No Yes http://vpa.sabanciuniv.edu.tr/phpBB2/vpa_views.php?s=31&serial=36
45 3D-Mask NO NO Yes https://www.idiap.ch/dataset/3dmad
1.4 Deep Learning Models 17
fusion [162] [34] [35]. Accelerometer data is able to indicate the potential impact of the object and starts an analysis of depth information, at the same time, it simplifies the com-plexity of the motion feature and increases its reliability. The number of the activities or objects or scenes is connected closely with the intended application. For example, if the application is SLAM, we focus on the number of the scenes in the dataset.
Table 1.6 concludes the information, such as whether the sensor moves during the col-lection process, whether it enables multi-sensor or not, whether it is download restricted, and the web link to the dataset. Camera movement is another important information when the algorithm selects the datasets for its evaluation. The rule in these tables is as follows: if the camera is still all the time in the collection procedure, it is marked “No”, otherwise “Yes”. The fifth column is related to the license agreement requirement. Most of the datasets can be downloaded directly from the web. However, downloading data from some datasets may need to fill in a request form. Moreover, few datasets are not public. The link to each dataset is also provided which can better help the researchers in related research areas.
1.4
Deep Learning Models
Many successful deep learning methods [24, 100, 146, 257] as efficient feature learning tools have been applied in a large amount of research. The aim of deep nets is to learn high-level features at each layer from the features in low-level. Some methods like (DBNs [100] and SDAE [257]) have something in common: they have two steps in the training procedure. One is unsupervised pre-training and the other is fine-tuning. In the first step, through an unsupervised algorithm, the weights of the network are able to be better than random initialization. This phase can avoid local minimum when doing supervised gradient descent. Therefore, we can consider that unsupervised pre-training is a regularizer. In the fine-tuning step, criterion (the prediction error which uses the labels in a supervised task) is minimized. These two approaches for learning deep networks are shown to be essential to train deep networks. Other methods like CNNs [136] contain more connections than weights. The model itself realizes a form of regularization. The aim of this kind of neural networks is to learn filters, in a data-driven fashion, as a tool to extract features describing inputs. This is not only used in 2D convolution but also can be extended into 3D-CNNs [122]. Up to date, though various successful deep learning methods are proposed in the field of computer vision, we can observe that these methods can be divided into four categories according to the basic methods they are derived from: Restricted Boltzmann Machines (RBMs) [101], CNNs, Auto-Encoder and Recurrent Neural Networks (RNNs). Some representative works in the categorization of deep learning methods can be found in Table 1.7. In the following
ods, Auto-Encoder-based methods, CNN-based methods and RNN-based methods, and their representative works.
Deep Learning Methods
RBM-based Methods Auto-Encoder-based Methods CNN-based Methods RNN-based Methods
Deep Belief Networks [100] Stacked Denoising
Auto-Encoders [257] AlexNet [137] Long Short-Term Memory [104] Deep Boltzmann Machines [206] Sparse
Auto-Encoders[200] Clarifai [287] Bidirectional RNNs [212] Deep Energy Models [187] Contractive
Auto-Encoders[203] SPP [193] Deep RNNs [87] VGG [224] Echo State Networks [118] GoogLeNet [244] Gated Recurrent Unit
Recurrent Neural Networks[44] Clockwork RNNs [133]
1.4.1
Deep Belief Networks
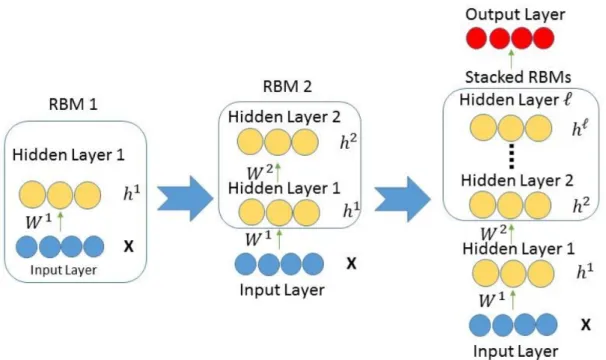
As a neural network, Deep Belief Networks (DBNs) stack and train many layers of unsuper-vised Restricted Boltzmann Machines (RBMs) in a greedy manner which is first introduced in [100]. A deep hierarchical representation of the training data can be extracted by DBNs. DBNs consist of visible layers vectorxand theℓhidden layershk. Each neuron on the layers is fully connected to all the neurons on the next layer. Through an unsupervised algorithm, the learned weights which are better than random initialization weights are used to initialize a multi-layer neural network and then adjusted to the current task through supervised infor-mation for classification. The model of the joint distribution between visible vectorx and hidden layershkcan be expressed:
P(x,h1, . . . ,hℓ) = ℓ−2
∏
k=0 P hk|hk+1 ! P hℓ−1,hℓ ,where xis denoted as h0. P hk|hk+1 is the conditional distribution about the visible u-nits conditioned on the hidden uu-nits of the RBM at level k+1. P hℓ−1,hℓ is the joint distribution over the visible units and hidden units on the top-level RBM. A schematic rep-resentation can be found in Fig. 1.3.
1.4 Deep Learning Models 19
Fig. 1.3 The schematic representation of DBN. It is just an example about DBN structure. In practice, the number of units on each hidden layer is flexible.
The capability of “learning features” in a “layer-by-layer” manner is the greatest advan-tage of DBNs. From the previous layers, the higher-level features can be learned. These features are believed to be more complicated and can better reflect the information which is contained in the structures of input data. Another advantage of DBNs is that it learns the generative model without imposing subjective selection of filters. Factored RBM is able to learn the filters while learning the feature activities in an unsupervised learning man-ner. It solves the concern of the legality of the selected filters. Meanwhile, it shows the biological implementation of visual cortex, namely, the receptive fields for cells in the pri-mary visual cortex. However, a well-performing DBN requires a lot of empirically decided hyper-parameter settings,e.g., learning rate, momentum, weight cost number of epochs and number of layers. Inadequate selection of hyper-parameters will result in over-fitting and blow up DBNs. The property of DBNs that is sensitive to the empirically selected parame-ters has also been proved in our experiments. An improper set of hyper-parameparame-ters results in a huge difference from the best performance. To some extent, this disadvantage compro-mises the potential of DBNs.
DBNs have been applied for generating and recognizing images [14], video sequences [242], motion-capture data [249] and natural language understanding [207].
Fig. 1.4 The figure of Stacked Denoising Auto-Encoders includes unsupervised pre-training steps and supervised fine-tuning steps. Through performing gradient descent on a super-vised cost, the parameters are fine-tuned to minimize the error with the supersuper-vised target.
1.4.2
Stacked Denoising Auto-Encoders
The second model is Stacked Denoising Auto-Encoders (SDAE) [257] which is an extension of Stacked auto-encoder [145]. This model has something in common with DBNs: they have two steps in the training procedure. One is unsupervised pre-training and the other is fine-tuning. SDAE also uses the greedy principle, but stacks denoising auto-encoders to initialize the deep network. An auto-encoder contains an encoder h(·) and a decoder
g(·). Therefore, the reconstruction of the inputxcan be expressed asRe(x) =g(h(x)). The reconstruction accuracy is able to be obtained from minimizing the average reconstruction errorloss(x,Re(x)). The figure of Stacked Denoising Auto-Encoders is shown in Fig. 1.4.
SDAE makes use of different kinds of encoders to transform the input data, which can preserve a maximization of the mutual information between the original and the encoded information. Meanwhile, it utilizes a noise criterion for minimizing the transformation error. We mentioned that DBNs and SDAE have something in common: they have two steps in the training procedure - one is unsupervised pre-training and the other is fine-tuning. The advantage of using auto-encoders as unsupervised building block of the deep architecture is that the training criterion is continuous in the parameters, almost any parametrization of the layers is possible [13]. However, in SDAE, training with gradient descent is slow and hard to parallelize. The optimization of SDAE is inherently non-convex and dependent on its initialization. Besides, since SDAE does not correspond to a generative model, unlike
1.4 Deep Learning Models 21
Fig. 1.5 The classical schematic representation of CNN. It includes input layer, convolu-tional layers, max-pooling layers and output layer. Fully connected part is also presented in this figure.
DBNs which is with generative models, samples cannot be drawn to qualitatively check what are learned.
SDAE is currently applied to many areas such as domain adaptation [80], images clas-sification [275] and text analysis [264].
1.4.3
Convolutional Neural Networks
Convolutional Neural Networks (CNNs) [149] obtained much success in many image pro-cessing tasks in past years. A BP-trained CNN [148] set a new MNIST record of 0.39% [198] with no unsupervised pre-training. In 2012, GPU-implementation CNN achieved the best results on ImageNet classification benchmark [136]. CNNs consist of one image pro-cessing layer, one or more convolutional layers and max-pooling layers and one classifica-tion layer. A classical schematic representaclassifica-tion of CNNs can be found in Fig. 1.5. Accord-ing to a N-classification problem with F trainAccord-ing examples and N classes, the squared-error is defined as: EF = 1 2 F
∑
f=1 N∑
n (tnf−ynf)2, (1.1)wheretnf is the value of then-thdimension about f-thpatten’s corresponding label, andynf
is then-thoutput layer unit related to f-thinput patten.
connected to the neurons which are in the same spatial area instead of being connected to the nodes in previous layers. Furthermore, when calculating to higher layers, the resolution of the image data will be reduced. However, besides a complex implementation, CNNs have another significant disadvantage that they require very large training data and consume an often impractical amount of time to learn the parameters of the network, which always take several days or weeks. Though the framework for accelerating training and classification of CNNs on Graphic Processing Units (GPUs) has been implemented and performs nearly hundreds of times faster than on the CPU, it is still not enough for real-world applications.
CNNs are considered as one of the most attractive supervised feature learning method-s nowadaymethod-s. CNNmethod-s have achieved method-superior performance for different tamethod-skmethod-s method-such amethod-s image recognition [244], video analysis [122], Natural language processing [220] and drug dis-covery [260]. Especially, CNNs based on GoogLeNet increased the MAP (Mean Average precision) of object detection to 0.439 and reduced the classification error to 0.067 [244]. Both of the performances are the best results up to now.
1.4.4
Long Short-Term Memory Neural Networks
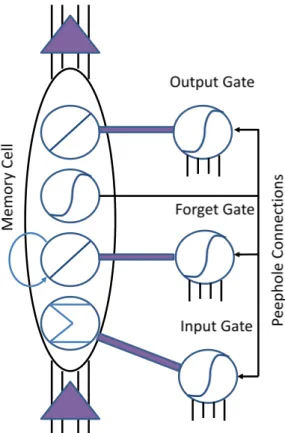
Long short-term memory (LSTM) is the extension of recurrent neural network (RNN) ar-chitecture which was first proposed in [104] for addressing the vanishing and exploding gradient problems of conventional RNNs. Different from traditional RNNs, when there ex-ist long time lags of unknown size among important events, an LSTM network can classify, predict and process time series from experience. LSTM provides remedies for the RNN’s weakness of exponential error decay through adding constant error carousel (CEC) which allows for constant error signal propagation along with the time. Besides, the access to the CEC can be controlled through taking advantages of multiplicative gates.
An LSTM architecture consists of an input layer, an output layer and a layer of memory block cell assemblies. A classical schematic representation of standard LSTM architecture is shown in Fig. 1.6. Fig. 1.6 shows that the memory block assemblies consist of many separate layers: the input gate layer (ι), the memory cell layer (c), the forget gate layer (φ)
and the output gate layer (ω). The input layer projects all of the connections to each layer.
![Table 1.3 The summary of RGB-D dataset categories. It includes RGB-D People dataset [235], TUM Texture-Less dataset [97], object segmentation dataset (OSD) [202], object discovery dataset [176], Princeton tracking benchmark dataset (PTB) [232], Berkeley 3-](https://thumb-us.123doks.com/thumbv2/123dok_us/1313584.2675633/29.892.136.786.674.875/categories-includes-texture-segmentation-discovery-princeton-benchmark-berkeley.webp)