저작자표시-비영리-변경금지 2.0 대한민국 이용자는 아래의 조건을 따르는 경우에 한하여 자유롭게 l 이 저작물을 복제, 배포, 전송, 전시, 공연 및 방송할 수 있습니다. 다음과 같은 조건을 따라야 합니다: l 귀하는, 이 저작물의 재이용이나 배포의 경우, 이 저작물에 적용된 이용허락조건 을 명확하게 나타내어야 합니다. l 저작권자로부터 별도의 허가를 받으면 이러한 조건들은 적용되지 않습니다. 저작권법에 따른 이용자의 권리는 위의 내용에 의하여 영향을 받지 않습니다. 이것은 이용허락규약(Legal Code)을 이해하기 쉽게 요약한 것입니다. Disclaimer 저작자표시. 귀하는 원저작자를 표시하여야 합니다. 비영리. 귀하는 이 저작물을 영리 목적으로 이용할 수 없습니다. 변경금지. 귀하는 이 저작물을 개작, 변형 또는 가공할 수 없습니다.
경제학 석사 학위논문
Comparative study of National
Innovation system efficiency of
Poland in economic growth
beyond the Middle-income trap
경제성장에 영향을 준 국가혁신시스템 효율성
비교연구
: 중진국함정을 극복한 폴란드 케이스를 중심으로
2020 년 8 월
서울대학교 대학원
경제학과
박 상 현
Abstract
Poland is one of the few countries that has escaped from the middle-income trap (MIT: 20% to 40% of US GDP per capita, PPP) since 2008. This paper uses the USPTO granted patent data of 33 countries to analyze and compare the performance of national innovation systems (NIS). Five NIS variables, namely the knowledge localization, the cycle time of technologies, the originality, the decentralization and the diversification are used in cluster analysis to identify what type of the catching up NIS Poland belongs to. Since Poland’s economic growth beyond the MIT was not explained in much part by the accumulation of capital and labor, this paper measures the efficiency of NIS variables on total factor productivity growth, the unexplained part of the growth through data envelopment analysis.
Keyword : Middle Income Trap; Data Development Analysis; Cluster Analysis; National Innovation System; Patent; Catching-up
Table of Contents
Chapter 1. Introduction ... 1
Chapter 2. Record of Economic Catching up and Growth Accounting Results ... 3
2.1 Growth beyond the ‘Middle income trap’ ... 3
2.2 Growth accounting results ... 5
Chapter 3. Literatures on the Polish Economic Growth ... 6
Chapter 4. Measuring National Innovation System and Total Factor Productivity Growth rate ... 9
4.1 National Innovation System ... 9
4.2 Total Factor Productivity Growth ... 14
Chapter 5. Methods ... 14
5.1 The Cluster Analysis ... 14
5.2 The Data Envelopment Analysis ... 17
Chapter 6. Cluster Analysis Results and NIS Comparison .... 19
6.1 The Cluster Analysis Results ... 19
6.2 NIS Comparison ... 24
Chapter 7. Data Envelopment Analysis Result ... 34
Chapter 8. Conclusion ... 36
Bibliography ... 38
Chapter 1.
Introduction
Gill and Kharas (2007) coined the term ‘middle income trap’ (MIT), a phenomenon wherein middle-income economies consequently failed to join the high-income economies and faced decelerated growth. World Bank (2012) classified middle-income economies (20% to 40% of U.S. per capita income) as the MIT. However, some economists have rejected the existence of this trap (e.g. Im and Rosenblatt, 2013; Han and Wei, 2017). The conflicting views regarding the existence of the MIT are due to the differences in the definitions of the trap and the methodologies to test its existence. Regardless of its existence, it is clear that many middle-income countries are struggling at the stagnant middle-income status①.
The determinants of economic growth remain an important puzzle in economics. Diverse studies have investigated the key responsible components for the MIT such as institutions, foreign direct investment (FDI), research and development (R&D) expenditure, tertiary education level, resource-based production and the National innovation systems (NIS). Innovation capabilities have been recognized as the key binding constraints for the middle-income stage (Lee, 2013; Eichengreen, Park, and Shin, 2013; World Bank, 2010; Cirera and Maloney, 2017). The observation implemented by World Bank (2010) also supports this view that middle-income economies would tend to fall under the trap because their wage rates are too high to complete with low-wage economies and the level of their technology is too low to enable from them to compete with high-wage economies. The importance of innovation as the factor of the trap is also found in the success story of East Asian Economies (South Korea, Taiwan and China) wherein they made a transition from low-wage based goods to high-end goods exporter (Lee, 2013).
① A study by the World Bank (2012) showed that only 13 out of 101 middle-income
When a limited part of economic growth can be explained by the accumulation of physical capital and working hours of labor, Total factor productivity (TFP) is considered as the unexplained part of economic growth, and refers to a measure of the efficiency with which labor and capital are used. Improvements in TFP reflects the development of production as a result of the adoption of the more efficient production technologies. It has been witnessed that a significant part of economic growth was attributed to TFP growth, and the gap in economic growth between countries can be largely explained by the differences in TFP of different countries.
This paper utilizes the concept of the national innovation system (NIS) as a key framework for economic growth, and analyzes the more concrete mechanisms by which innovation is generated. The national innovation system can be defined as the “elements and relationships involved in the production, diffusion, and use of new and economically useful knowledge that are located within the borders of a nation state” (Lundvall, 1992). For instance, R&D and tertiary education can be classified into NIS because R&D expenditure and the tertiary education level are related to the degree of knowledge creation and diffusion. In addition to R&D expenditure and tertiary education, the other focus of NIS shows on the technology life-cycle, the originality of technology, the knowledge localization, the technological diversification and the decentralization of technology within a country. This paper will address how Poland has achieved economic growth through comparative analysis with other countries. Poland’s economic success since 1989 is unique because it was the only large and democratic country among all post-communist economies. Poland with few natural resources has achieved its remarkable economic growth. In this study, the cluster analysis applies NIS variables to classify the NIS of countries into several types. By the clustering analysis, we could confirm which type of NIS cluster Poland belongs to. Then, Data envelopment analysis (DEA) can measure the relative efficiency of NIS variables for TFP growth in Poland.
Chapter 2.
Record of Economic Catching up and Growth
Accounting Results
2.1 Growth beyond the
‘
Middle income trap
’
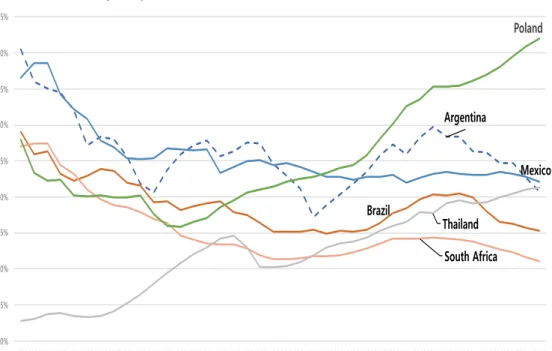
One way to measure a country’s economic growth performance is by measuring relative income level to the USA per capita income. In this paper, the measurement uses GDP per capita (Purchasing Power Parity, 2011 international $) from IMF World Economic Outlook (WEO) to calculate the relative GDP per capita ratio to the U.S. per capita income in Figure 1A and 2B. 20~40 percent of the U.S. GDP per capita can be considered as the boundary of MIT. A country with more than 40 percent of the U.S. per capita income has successfully caught up.
Shown in Figure 1A and 2B, it shows different economic performance by country. Poland appears to have achieved to transition towards a high-income economy. Poland, unlike most other middle-income countries, such as Brazil, Mexico, Argentina, Thailand, South Africa, exceeds 40% of the US GDP per capita (PPP) in 2008. The relative income level of Mexico and Argentina has declined from 46% and 50% in 1980 to 32% and 27% in 2003 respectively. Meanwhile, Thailand have grown from 12% in 1980 to 30% in 2019, however, fails to grow beyond the MIT. Figure 1B suggests that Malaysia and Chile have also been growing in the past decades and reached 40% in 2008 and 2011 respectively. Recent study of Chile and Malaysia analyzed by Lebdioui, Lee and Pietrobelli (2020) suggests that firms in the resource-based sector level close the technological gap with frontier capabilities.
Figure 1A. Middle Income Trap
Source: Author calculation based on IMF (2019) WEO April 2019 Edition
Figure 1B. Middle Income Trap
Source: Author calculation based on IMF (2019) WEO April 2019 Edition Argentina Brazil Mexico South Africa Thailand Poland 10% 15% 20% 25% 30% 35% 40% 45% 50% 55% 1980198119821983198419851986198719881989199019911992199319941995199619971998199920002001200220032004200520062007200820092010201120122013201420152016201720182019 GDP per capita, PPP (2011 international dollar) ratio to the US income
Chile Malaysia Poland 10% 15% 20% 25% 30% 35% 40% 45% 50% 55% 1980 1981 1982 1983 1984 1985 1986 1987 1988 1989 1990 1991 1992 1993 1994 1995 1996 1997 1998 1999 2000 2001 2002 2003 2004 2005 2006 2007 2008 2009 2010 2011 2012 2013 2014 2015 2016 2017 2018 2019
2.2 Growth Accounting Results
Growth accounting decomposes economic growth into the contributions of capital, labor, and a residual measure of gains. This residual represents an estimate of the changes in TFP. The Cobb-Douglas aggregate production function is the organizing principle of growth accounting:
𝑌"#= 𝑒"#&𝐾"#(𝐿"#*
where 𝑌"# is real GDP, θ is the growth rate of TFP, α represents the share of capital in GDP, β represents share of labor, 𝐾"# is capital stock, and 𝐿"# is employment. Differentiating the logarithm of the
Cobb-Douglass equation with respect to each time period, we obtain
𝑔 = 𝜃 + 𝛼(𝐺𝑅𝐾) + 𝛽(𝐺𝑅𝐿)
where g is the growth rate in real GDP, θ is the growth rate of TFP, α shows the elasticity of output with respect to capital, GRK represents the growth rate of capital, β is the elasticity of output with respect to labor, and GRL is the growth rate of labor. This section adopts the results of Garbis Iradian (2007) where the fixed effects econometric technique with cross-section weights is used to estimate the shares of capital and labor.
Table 2 shows the differences in total factor productivity in each country that affected economic growth and output during 1996-2006 period. Poland accounts for 2.1 percent points of TFP growth contribution and 48 percent of TFP share in output. China also has high percent point of TFP growth contribution, 3.7 and 40 percent of TFP share in output. In contrast, developed countries such as France, Germany, Japan, and USA with relatively low level of real GDP growth rate has small percent points of TFP growth, 0.4, 0.4, 0.5, and 0.7 respectively. High TFP growth rate implies that a country relies on the growth in output with unchanged levels of the factor inputs.
Table 1. Growth Accounting Results (In percent, annual averages, 1996-2006) (Iradian, 2007) Real GDP Growth Rate Investment (%GDP) Contribution to Growth (Percent points) Share of TFP in Output Growth in Productivit y of Labor Capital Labor TFP Poland 4.4 21 2.2 0 2.1 48 4.3 Czech Republic 2.9 28.9 2.3 -0.2 0.8 29 3.2 Hungary 4.2 22.9 2.3 0.4 1.5 36 3.6 Chile 4.3 22.9 2.4 1.2 0.6 14 2.2 China 8.8 36.8 4.4 0.8 3.7 40 7.4 Ireland 7.3 24.6 2.8 2.6 1.9 26 2.9 Korea, Rep 5.4 34.4 2.7 0.9 1.9 34 3.8 France 1.9 23.3 0.69 0.6 0.4 20 0.9 Germany 1.4 20 0.8 0.2 0.4 30 1.1 Japan 1.2 24.7 0.8 -0.1 0.5 41 1.3 USA 3.3 19.2 1.7 0.8 0.7 23 1.9
Note: Annual depreciation rate of capital stock is assumed at 5 percent; and the initial capital stock to GDP ratio of 2.
Chapter 3.
Literatures on the Polish Economic growth
FDI has been identified as the major contributor to the host economy’s productivity growth with technology spillover across domestic firms (Grossman and Helpman, 1991). Poland-specific studies also find that integration into global production networks has contributed to movement into higher value-added activities (EBRD, 2014). Jan Hagemejer and Marcin Kolasa (2011) find that “all forms of internationalization, including ties to multinational companies, are
positively associated with a range of favorable characteristics, including capital intensity, productivity and wage levels in Poland.” Although FDI can have beneficial influence on the knowledge spillover in the early stage of economic growth, the eventual rise of indigenous firms becomes more important channel for gaining knowledge at later stage because foreign firms tended to reluctant to transfer technology② (Lebdioui, Lee and Pietrobelli, 2020; Amsden and Chu, 2003). Meanwhile, Polish economy is heterogenous with Multinational corporations (MNCs) playing a less prominent role than other Central and Eastern Europe countries (CEE), such as Hungary, the Slovak Republic. Poland’s largest, domestically owned firms are relatively small, while indigenous industry heavily relies on small and medium sized firms (Breznitz and Ornston, 2017; Martin, 2013).
Empirical analysis of foreign direct investment in Poland indicates that FDI was not a significant factor for GDP growth, but a domestic expenditure on fixed capital and expenditure on R&D (Kosztowniak, 2013). According to Balcerzak and Zurek (2011), VAR analysis for Poland shows that FDI has only short-term positive influence on labor market. Moreover, according to Chase-Dunn, Kawana, and Brewer (2000), Poland can be one of the periphery countries which receive small share of global wealth and exploited by more developed countries.
After the 1989 revolution in Poland which caused the collapse of the People’s Republic of Poland, Leszek Balcerowicz was elected as a deputy prime minister and led a program of reform financed by the IMF and the World Bank (Sachs, 1993). The program liberalized all prices and introduced market-oriented reforms including privatization. According to Marcin Piatkowski (2018), Poland made successful transition because of the improvement of institutions such as large private sector at the beginning of Transition, a legacy of Pro-Market
② East Asia promoted their innovation capability in the early stage of economic growth by
leaning from Multinational corporations (MNCs) or through the OEM (Original Equipment Manufacturing) contracts with MNCs. The eventual rise of indigenous firms supports the success of East Asian economic growth (Amsden and Chu, 2003)
reforms before 1989, healthy Banks, strong financial sector supervision, solid and pragmatic policy making, and increase in the volume and quality of education, and the high absorption of EU funds. He also argues that improvements in institutions such as the voice and accountability, the political stability and absence of violence, the government effectiveness, the regulatory quality, the rule of law and the control of corruption accelerate the economics growth of Poland. However, as Lee and Kim (2009) suggests that institution matters for low and lower middle-income countries, institutions of Poland are improved in the early stage of transition (1989 – 1995). Moreover, the control of corruption variable and the government effectiveness has dropped from 73 in 1996 to 71 in 2015 and 77 in 1996 to 75 in 2015, respectively, compared to the counterpart, the upper middle-income economies improved from 47 to 49 and from 45 to 49, respectively (Piatkowski, 2018). EBRD index of institutional reform (1995-2012) also shows that Ukraine, Romania, Croatia, Bulgaria have improved the index more than 1 unit, whereas Poland have improved less than 1 unit in the period (ibid)
OECD has conducted studies on National innovation systems adopting the original definition of the NIS by Lundvall (1992), which focuses on four types of knowledge variables: interactions among enterprises, interactions among enterprises, universities and public research institutes, diffusion of knowledge and technology to enterprises and mobility of the skilled personnel (OECD, 1997). In 1992, OECD compared R&D intensity between catching-up economies and developed OECD countries as the simple indicators of NIS. However, few studies have implemented NIS of Poland as factors of the economic growth.
Chapter 4.
Measuring National Innovation System and Total Factor
Productivity Growth Rate
4.1 National Innovation System
The NIS deals with the question of how efficiently a nation establishes a system for learning and innovation in terms of production, diffusion and utilization of knowledge (Lundvall, 1992; OECD, 1997). Various NIS variables such as investment climates and political institutions are used to measure the knowledge innovation capabilities. However, NIS variables affect the speed or direction of a nation’s innovation and its economic performance. In terms of a catching-up perspective, how knowledge is efficiently produced, diffused and used among national agents matters.
Regarding the indicators of NIS, this paper focuses on knowledge flows measured by US granted patent data, research and development (R&D) expenditure and tertiary education level. US granted patent data can be retrieved from the USPTO bulk data wherein a weekly released US granted patent panel data available from 1976 to current contains information regarding inventor, assignee, cited patent, classification, etc. This paper screens countries with more than 40 granted patents in five years to measure NIS variables③.
Cycle time of technologies
The cycle time of technologies (CTT) measures the time lags between the granted year of citing and cited patents or the time span between the predecessor and the successor (Jaffe and Trajtenberg,
③ Chile meets the criteria from 1993; Malaysia from 1991; Thailand from 1993; Turkey
2002). The CTT variables shows whether countries specialized in sectors with rapid or slow obsolescence of knowledge. A long cycle time of technologies refers use of old knowledge and thus implies a greater entry barrier for the latecomers such as the pharmaceutical sector. Meanwhile, since a short CTT indicates the short life span of the knowledge, the less reliance on old technology and more opportunity for new technology promotes the latecomers to achieve economic growth (Lee, 2013).
This paper uses the relative cycle time of technology, not the absolute CTT. The average CTT of patent 𝑥" granted in year 𝑡 can
be defined as follows: 𝐴𝑣𝑒𝑟𝑎𝑔𝑒 𝐶𝑇𝑇 𝑜𝑓 𝑝𝑎𝑡𝑒𝑛𝑡 𝑥" 𝑔𝑟𝑎𝑛𝑡𝑒𝑑 𝑖𝑛 𝑦𝑒𝑎𝑟 𝑡 = 1 𝑛EF(𝑔𝑟𝑎𝑛𝑡𝑒𝑑 𝑦𝑒𝑎𝑟 𝑜𝑓 𝑐𝑖𝑡𝑖𝑛𝑔 𝑝𝑎𝑡𝑒𝑛𝑡 𝑥H I − 𝑔𝑟𝑎𝑛𝑡𝑒𝑑 𝑦𝑒𝑎𝑟 𝑜𝑓 𝑝𝑎𝑡𝑒𝑛𝑡 𝑦" 𝑐𝑖𝑡𝑒𝑑 𝑏𝑦 𝑥)
where 𝑦L, 𝑦N,… . 𝑦QR represents patents cited by patent 𝑥" . Then average CTT of country 𝑥 in year 𝑡 can be calculated as follows:
𝐴𝑣𝑒𝑟𝑎𝑔𝑒 𝐶𝑇𝑇 𝑜𝑓 𝑐𝑜𝑢𝑛𝑡𝑟𝑦 𝑥 𝑔𝑟𝑎𝑛𝑡𝑒𝑑 𝑖𝑛 𝑦𝑒𝑎𝑟 𝑡
= 1
NF(𝐴𝑣𝑒𝑟𝑎𝑔𝑒 𝐶𝑇𝑇 𝑜𝑓 𝑝𝑎𝑡𝑒𝑛𝑡 𝑥" 𝑔𝑟𝑎𝑛𝑡𝑒𝑑 𝑖𝑛 𝑦𝑒𝑎𝑟 𝑡 )
EI
where 𝑁 represents the total number of patents. The relative cycle time of technology of country 𝑥 in year 𝑡 can be achieved as follows:
𝑇ℎ𝑒 𝑟𝑒𝑙𝑎𝑡𝑖𝑣𝑒 𝐶𝑇𝑇 𝑜𝑓 𝑐𝑜𝑢𝑛𝑡𝑟𝑦 𝑥 𝑔𝑟𝑎𝑛𝑡𝑒𝑑 𝑖𝑛 𝑦𝑒𝑎𝑟 𝑡
= average CTT of country 𝑥 in year 𝑡
average CTT of all patents granted in year 𝑡
Knowledge localization
source in the acquisition of knowledge and the degree of the intra-national creation and diffusion of knowledge (Jaffe, Trajtenberg and Henderson, 1993). An approach to compare the geographic localization of the patent citations owned by inventors of the same nationality suggests the probability of a patent matching the original patent by geographic region.
Based on the insight, this paper can measure how much knowledge is made domestically by citing the patents owned by same nationality inventors. The degree of knowledge localization in a country as the probability of one country’s patents citing its own patents can be formally indicated as follows:
𝐾𝑛𝑜𝑤𝑙𝑒𝑑𝑔𝑒E#= 𝐴 = 𝑛EE#
𝑛E#
where 𝑛EE# indicates number of citations made to country 𝑥‘s patents by country 𝑥’s patents filed in year 𝑡, 𝑛E# represents the number of all citations made by country 𝑥‘s patents filed in year 𝑡.
If the localization variable is large, then knowledge diffusion in the domestic level is high. In the cross-country panel analysis, Lee (2013) verified that the localization is positive and significant in high-income group regressions but not in middle-high-income group, implying that the knowledge localization may be unnecessary in the early stage of economic growth.
Technological Diversification
Diversification of technology captures the degree to which a country creates patents in a wide variety of technological fields. This variable represents a width of nation’s technology portfolio (Lee and Lee, 2019). Using the three-digit class in CPC classification, the diversification variable is measured by the number of patent technology class in a country divided by 136, the total number of patent classes in the CPC and can be shown as follows:
𝐷𝑖𝑣𝑒𝑟𝑠𝑖𝑓𝑖𝑐𝑎𝑡𝑖𝑜𝑛E# = (𝑁"
136)E#
where 𝑁" indicates the number of technology classes that country 𝑥
has filed in year 𝑡. Large technological diversification variable implies that the various technology is utilized and diffused in a nation.
Originality
The index of originality captures the degree to which a patent makes backward citations to patents from a wide range of technological class instead of a narrow range of the class (Trajtenberg, Henderson and Jaffe, 1997). The originality of patent 𝑥" can be represented as follows:
𝑂𝑟𝑖𝑔𝑖𝑛𝑎𝑙𝑖𝑡𝑦EI# = (1 − F (𝑁𝑐𝑖𝑡𝑒𝑑"q
𝑁𝑐𝑖𝑡𝑒𝑑")N rI
q )EI#
where 𝑘 is the technological class (US patent CPC classification),
𝑁𝑐𝑖𝑡𝑒𝑑"q indicates the number of citations made by patent 𝑖 to patents
which belong to patent 𝑘 and 𝑁𝑐𝑖𝑡𝑒𝑑" is the total number of citations made by the patent 𝑖. The average for each country at year 𝑡 for each patent represents the originality of country 𝑥 in year 𝑡. If a patent cites previous patents which utilize a narrow set of technologies, the originality score will be low. High score of the originality variable represents a broad technological root of the underlying knowledge
Decentralization
Decentralization NIS variable investigates the degree of patent decentralization across assignees excluding unassigned patents, which measured by the Herfindahl-Hirschman index (HHI) of concentration
(Lee, 2013): 1 − 𝐻𝐻𝐼E# = 1 − F( 𝑁"# 𝑁E#) N "∈wR
where 𝐼E is the set of assignees, 𝑁"# indicates the number of patents granted by assignee 𝑖 in year 𝑡 and 𝑁E# is the total number of patents granted by country 𝑥 in year 𝑡. If the patents are filed by a small number of assignees, then HHI index is large, consequently, the decentralization variable have a high value.
Research and Development (R&D)
Most countries have invested on research and development (R&D) to promote innovations. The gross domestic expenditure on R&D indicator refers to the total expenditure on R&D financed by all resident enterprises, research institutes, university and government laboratories, etc. However, it excludes the expenditure performed abroad. According to the OECD's Frascati Manual (2015), research and development (R&D) can be defined as "creative work undertaken on a systemic basis in order to increase the stock of knowledge, including knowledge of man, culture and society, and the use of this stock of knowledge to devise new applications." This paper utilizes the R&D expenditure (% GDP) using data from World Bank. R&D expenditure includes capital and current expenditures in the four main sectors: Business enterprise, Government, Higher education and Private non-profit. R&D covers basic research, applied research, and experimental development.
Tertiary education
As Lee and Kim (2008) suggests, tertiary education can be the key determinants of long-run economic growth for middle-income countries. The gross enrollment ratio for tertiary school can be
calculated by dividing the number of students enrolled in tertiary education regardless of age by the population of the age group which officially corresponds to tertiary education, and multiplying by 100. Tertiary education, as an advanced research qualification, normally requires, as a minimum condition of admission, the successful completion of secondary level education. This paper uses the data from World bank wherein the education data are collected from national authorities’ annual education survey and mapped to the International Standard Classification of Education (ISCED) to compare education programs at the international level.
Chapter 5.
Methods: The Cluster Analysis and The Data
Envelopment Analysis
5.1 The Cluster analysis
The basic idea of clustering analysis determines which variables are used, measures the distance between units based on the selected variables and classifies clusters using the measured distance (Rokach and Maimon, 2005; Milligan and Cooper, 1985). The cluster analysis tests the degree of commonality among selected units in order to maximize the coherence of each cluster and the heterogeneity across different clusters.
Despite a growing interest on the measurement of various NIS and its effectiveness, few studies have been conducted to focus on the typology of the NIS over a large number of economies through cluster analysis with exceptions like Godinho, Mendonca and Pereira (2005), Castellacci and Archibugi (2008) and Lee and Lee (2019). Godinho et
al. (2005) used 24 variables including 8 NIS variables④ in 2002 or 2003 to analyze cluster over 69 countries and identified two or six clusters depending on the degree of aggregation. It also verified that three NIS variables related to innovation, diffusion and use of knowledge were more distinctive indicator than other remaining NIS variables. Castellacci and Archibugi (2008) identified six variables related to infrastructure, skills, and innovation using factor analysis. It also conducted a cluster analysis for 131 countries for year 1990 and 2000 and found three NIS clusters, i.e. advanced, followers, and marginalized. Recent study by Lee and Lee (2019) measured five NIS variables including the relative cycle time of technology, the decentralization, the localization of knowledge, the originality and the diversification of knowledge, using US granted patent data and conducted the cluster analysis of 32 countries for the period 2008 to 2015. It classified economies into five NIS clusters: Balanced and Mature NIS, Balanced Catching-up group, Imbalanced Catching-up NIS, Imbalanced and Trapped NIS, and Other-Balanced group.
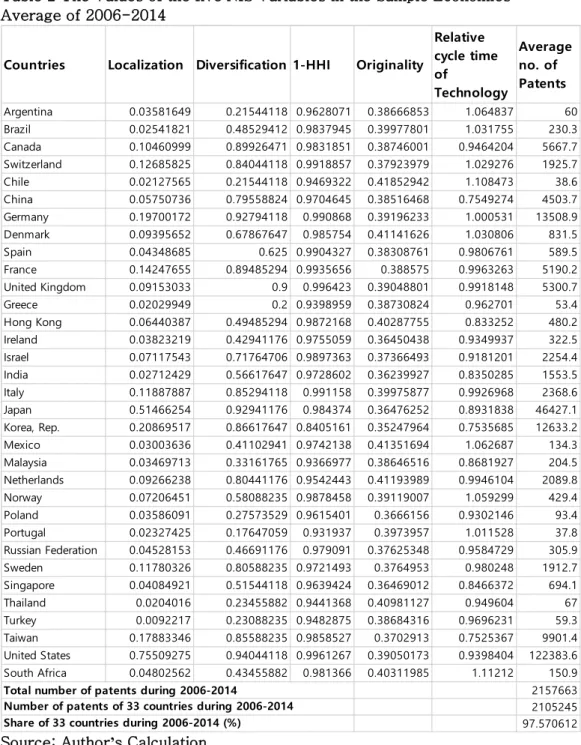
Then, this paper utilizes five NIS variables of the average from 2006 to 2014, namely the relative cycle time of technology, the decentralization, the localization of knowledge, the originality and the diversification of knowledge to proceed with clustering analysis of 33 countries⑤. As indicated in the table 2, the number of patents granted
in 33 countries from 2006 to 2014 is amount to 97.57% of all patent granted in the period. Because R&D expenditure (% GDP) and tertiary education enrollment rate data are missing in some countries, these two variables are not used in the cluster analysis. Unlike Lee and Lee
④ which includes market conditions, institutional conditions, investment climate
(educational and R&D investment), scientific knowledge (papers, researchers and college enrollment per capita, etc.), economic structure, openness and absorption, diffusion (internet host per capita), and innovation (patents and trademarks per capita)
⑤ United States, Japan, Sweden, United Kingdom, Italy, France, South Korea, Taiwan,
China, Singapore, India, Hong Kong, Norway, Denmark, Turkey, Thailand, Poland, Malaysia, Mexico, Brazil, Chile, Argentina, Canada, Switzerland, Netherlands, Russia, Ireland, Israel, Spain, Greece, Portugal and South Africa.
(2019)’s study using U.S. classification in measuring NIS variables, this paper calculates NIS variables based on the CPC classification, which brings 16% more number of patents used to measure the variables in the same period. This paper focuses the NIS type of economies using the most recent period information, because some degree of inter-temporal stability of NIS types and the lag in NIS type changes in statistical method can be found: for example, South Korea started to specialize in short cycle time of technology sectors since the mid-1980s, a new NIS cluster was realized only in the 1990s. Also, this paper adopts the Euclidean complete linkage approach⑥ which
uses the closest maximum distance between clusters, and applies a hierarchical classification method which provides a step-wise concentration of countries based on their distance.
⑥ Single complete linkage is as follows:
𝐷L(𝑋, 𝑌) = maxE∈{, H∈|𝑑(𝑥, 𝑦), where 𝑑(𝑥, 𝑦) denotes Euclidean distance (L2 measure);
Table 2 The Values of the five NIS Variables in the Sample Economies: Average of 2006-2014
Source: Author’s Calculation
5.2 The Data Envelopment Analysis
Data Envelopment Analysis (DEA) indicates the method of measuring the empirical production efficiency of decision making units
Countries Localization Diversification 1-HHI Originality
Relative cycle time of Technology Average no. of Patents Argentina 0.03581649 0.21544118 0.9628071 0.38666853 1.064837 60 Brazil 0.02541821 0.48529412 0.9837945 0.39977801 1.031755 230.3 Canada 0.10460999 0.89926471 0.9831851 0.38746001 0.9464204 5667.7 Switzerland 0.12685825 0.84044118 0.9918857 0.37923979 1.029276 1925.7 Chile 0.02127565 0.21544118 0.9469322 0.41852942 1.108473 38.6 China 0.05750736 0.79558824 0.9704645 0.38516468 0.7549274 4503.7 Germany 0.19700172 0.92794118 0.990868 0.39196233 1.000531 13508.9 Denmark 0.09395652 0.67867647 0.985754 0.41141626 1.030806 831.5 Spain 0.04348685 0.625 0.9904327 0.38308761 0.9806761 589.5 France 0.14247655 0.89485294 0.9935656 0.388575 0.9963263 5190.2 United Kingdom 0.09153033 0.9 0.996423 0.39048801 0.9918148 5300.7 Greece 0.02029949 0.2 0.9398959 0.38730824 0.962701 53.4 Hong Kong 0.06440387 0.49485294 0.9872168 0.40287755 0.833252 480.2 Ireland 0.03823219 0.42941176 0.9755059 0.36450438 0.9349937 322.5 Israel 0.07117543 0.71764706 0.9897363 0.37366493 0.9181201 2254.4 India 0.02712429 0.56617647 0.9728602 0.36239927 0.8350285 1553.5 Italy 0.11887887 0.85294118 0.991158 0.39975877 0.9926968 2368.6 Japan 0.51466254 0.92941176 0.984374 0.36476252 0.8931838 46427.1 Korea, Rep. 0.20869517 0.86617647 0.8405161 0.35247964 0.7535685 12633.2 Mexico 0.03003636 0.41102941 0.9742138 0.41351694 1.062687 134.3 Malaysia 0.03469713 0.33161765 0.9366977 0.38646516 0.8681927 204.5 Netherlands 0.09266238 0.80441176 0.9542443 0.41193989 0.9946104 2089.8 Norway 0.07206451 0.58088235 0.9878458 0.39119007 1.059299 429.4 Poland 0.03586091 0.27573529 0.9615401 0.3666156 0.9302146 93.4 Portugal 0.02327425 0.17647059 0.931937 0.3973957 1.011528 37.8 Russian Federation 0.04528153 0.46691176 0.979091 0.37625348 0.9584729 305.9 Sweden 0.11780326 0.80588235 0.9721493 0.3764953 0.980248 1912.7 Singapore 0.04084921 0.51544118 0.9639424 0.36469012 0.8466372 694.1 Thailand 0.0204016 0.23455882 0.9441368 0.40981127 0.949604 67 Turkey 0.0092217 0.23088235 0.9482875 0.38684316 0.9696231 59.3 Taiwan 0.17883346 0.85588235 0.9858527 0.3702913 0.7525367 9901.4 United States 0.75509275 0.94044118 0.9961267 0.39050173 0.9398404 122383.6 South Africa 0.04802562 0.43455882 0.981366 0.40311985 1.11212 150.9 2157663 2105245 97.570612 Total number of patents during 2006-2014
Number of patents of 33 countries during 2006-2014 Share of 33 countries during 2006-2014 (%)
(DMUs) and has been widely used on studies measuring the efficiency of NIS. DEA finds production points defined as the production of a country with a given combination of input factors and calculates a frontier function by finding those production points which are under dominated in comparing every observed production point of sample country. This result represents a piecewise linear surface which envelops all observations of a sample and which is considered as a benchmark for the determination of the efficiency of all production points by measuring distance to the frontier function (Kruger, Cantner and Hanusch, 2000).
Through DEA, this paper investigated how efficiently the seven NIS variables (the relative cycle time of technology, the decentralization, the localization of knowledge, the originality and the diversification of knowledge, R&D (%GDP), the tertiary education enrollment rate) were used in the growth rate of total factor productivity. To measure the distance from the frontier function, the output-oriented version⑦ of the DEA under constant returns to scale
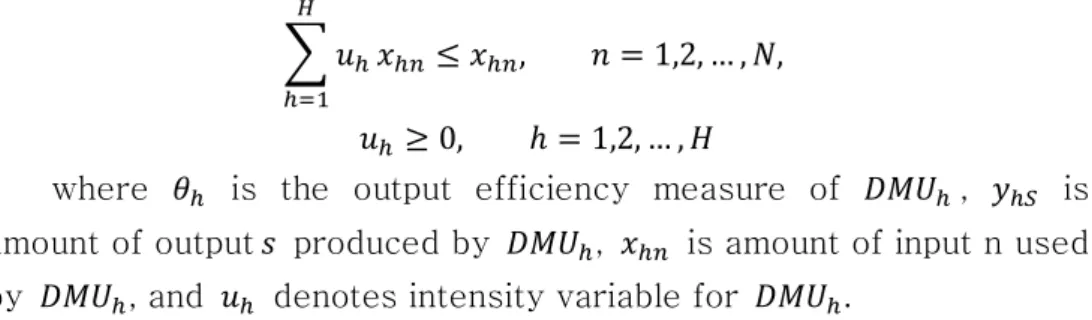
suggested by Charnes, Cooper and Rhodes (1978), i.e. CCR model was used: max &,‡ 𝜃ˆ 𝑠. 𝑡. 𝜃ˆ𝑦ˆ‰≤ F 𝑢ˆ ‹ ˆŒL 𝑦ˆ‰, 𝑠 = 1,2, … , 𝑆 ,
⑦ Output orientation is the more plausible assumption on the macroeconomic level because
it is closer to the objectives of growth policy to achieve a product as high as possible with a given resource endowment (Kruger, et al., 2000) However, since this study uses TFP growth rate as an output, it may have negative outputs, so it may not able to calculate efficiency. Therefore, input oriented CCR model can also be used:
min &,‡ 𝜃ˆ 𝑠. 𝑡. 𝑦ˆ‰≤ F 𝑢ˆ ‹ ˆŒL 𝑦ˆ‰, 𝑠 = 1,2, … , 𝑆 , F 𝑢ˆ ‹ ˆŒL 𝑥ˆQ, 𝑛 = 1,2, … , 𝑁, 𝑢ˆ≥ 0, ℎ = 1,2, … , 𝐻
where 𝜃ˆ is the efficiency measure of 𝐷𝑀𝑈ˆ, 𝑦ˆ‰ is amount of output 𝑠 produced by
𝐷𝑀𝑈ˆ, 𝑥ˆQ is amount of input n used by 𝐷𝑀𝑈ˆ, and 𝑢ˆ denotes intensity variable for
F 𝑢ˆ ‹ ˆŒL
𝑥ˆQ ≤ 𝑥ˆQ, 𝑛 = 1,2, … , 𝑁,
𝑢ˆ ≥ 0, ℎ = 1,2, … , 𝐻
where 𝜃ˆ is the output efficiency measure of 𝐷𝑀𝑈ˆ, 𝑦ˆ‰ is
amount of output 𝑠 produced by 𝐷𝑀𝑈ˆ, 𝑥ˆQ is amount of input n used
by 𝐷𝑀𝑈ˆ, and 𝑢ˆ denotes intensity variable for 𝐷𝑀𝑈ˆ.
Chapter 6.
Cluster Analysis Results and NIS comparison.
6.1 Cluster Analysis Results
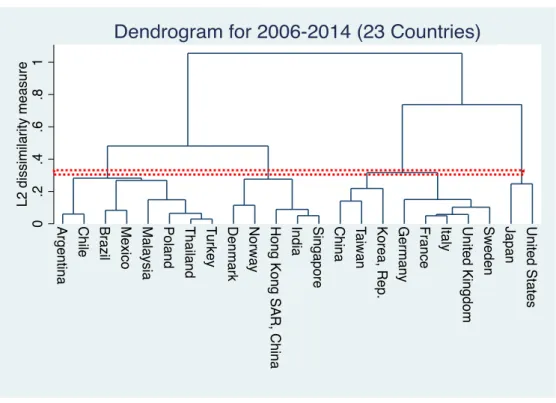
This section presents the results of the clustering analysis. To demonstrate the robustness of the results, the core 23 countries are analyzed, and then 33 countries are analyzed. The core 23 countries include United States, Japan, Sweden, United Kingdom, Italy, France, South Korea, Taiwan, China, Singapore, India, Hong Kong, Norway, Denmark, Turkey, Thailand, Poland, Malaysia, Mexico, Brazil, Chile and Argentina. And then, Canada, Switzerland, Netherlands, Russia, Ireland, Israel, Spain, Greece, Portugal and South Africa are added in the analysis.
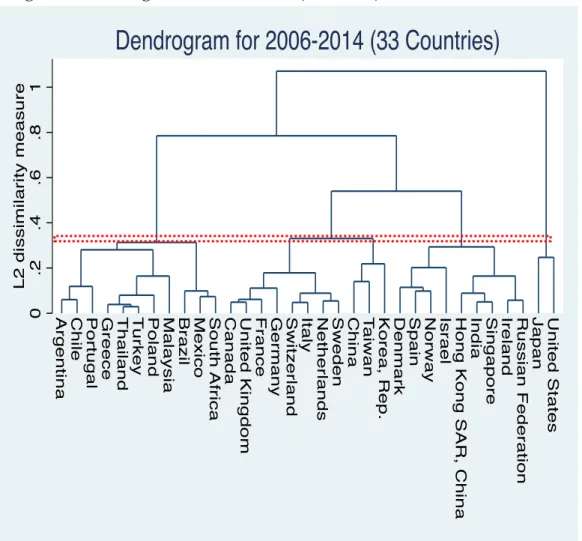
Figure 2A presents the dendrogram of the results of the hierarchical cluster analysis using the five NIS data for 2006-2014 period. The vertical axis in this analysis indicates the coefficient of dissimilarity among economies in different clusters. The clusters are consolidated at different stage. Then, the coefficient of dissimilarity tends to rise when the number of clusters decreases because dissimilar countries end up in the same cluster at the upper part of the graph.
grouping⑧, this paper sets at the 0.32 level of dissimilarity (red dotted lines in Figure 2A). At this level, 23 countries are classified into five clusters: outlier cluster (United States and Japan), a cluster of European developed countries (Sweden, United Kingdom, Italy, France, Germany), a cluster of East Asia Catching-up countries (S. Korea, Taiwan, China), a cluster including Singapore, India, Hong Kong, Norway, Denmark and a cluster including Turkey, Thailand, Poland, Malaysia, Mexico, Brazil, Chile and Argentina. Shown in Figure 2B, results of the clustering analysis using 33 countries remain same with five different clusters classified by the 0.33 level of dissimilarity.
Figure 2A. Dendrogram for 23 countries (2006-2014)
⑧ Milligan and Cooper (1985) considered 30 different methods for deciding on the number
of clusters. One commonly used rule is the Calinski–Harabasz pseudo-F statistics, which measures the variation among clusters relative to the variation within such clusters. The study found that this rule often resulted in strange groupings that were contrary to prior knowledge.
0 .2 .4 .6 .8 1 L 2 d issi mi la ri ty me a su re Arg e n tin a Chile Bra zi l Me xi co Ma la ysi a Po la n d Thailand T u rke y D e n ma rk N o rw a y H o n g Ko n g SAR , C h in a India Si n g a p o re China Taiwan Ko re a , R e p . G e rma n y F ra n ce Italy U n ite d Ki n g d o m Sw e d e n Ja p a n U n ite d St a te s
Figure 2B. Dendrogram for 33 countries (2006-2014)
The characteristics of the clusters seem to be apparent by making radial graphs as Figure 3A, B and C. The value of the NIS variables in radial graphs are all normalized in order to consolidate the range from 0 to 1⑨. Figure 3A compares normalized NIS variables between
balanced NIS clusters, i.e. the balanced mature cluster, the balanced
⑨ Normalized value A = (A − minimum values of A) / (maximum value of A − minimum
value of A). 0 .2 .4 .6 .8 1 L 2 d issi mi la ri ty me a su re Arg e n tin a Chile Po rt u g a l G re e ce Thailand T u rke y Po la n d Ma la ysi a Bra zi l Me xi co So u th Af ri ca Canada U n it e d Ki n g d o m F ra n ce G e rma n y Sw it ze rl a n d Italy N e th e rl a n d s Sw e d e n China T aiwan Ko re a , R e p . D e n ma rk Sp a in N o rw a y Isra e l H o n g Ko n g SAR , C h in a India Si n g a p o re Ire la n d R u ssi a n F e d e ra tio n Ja p a n U n it e d St a te s
Dendrogram for 2006-2014 (33 Countries)
Note: 1) Balanced Mature: Sweden, Netherlands, Italy, Swiss, Germany, France, UK, Canada
2) Imbalanced Catching up: Korea, Taiwan, China
3) Balanced mixed: Russia, Ireland, Singapore, Hong Kong, India, Israel, Norway, Spain, Denmark
4) Imbalanced Mixed: Poland, Chile, Malaysia, Mexico, Brazil, Argentina, South Africa, Thailand, Portugal, Greece and Turkey
Mixed cluster and the balanced catching-up cluster. The balanced mature cluster refers to a cluster of Sweden, Netherlands, Italy, Switzerland, Germany, France, United Kingdom and Canada. The cluster has relatively similar (Coefficient of variance is 0.48) and high value of all five NIS variables. The balanced mixed cluster refers to a cluster of Singapore, India, Hong Kong, Norway, Denmark, Spain, Israel, Ireland and Russia, because the term mixed means that a cluster includes India aside from the high-income economies. This cluster also has a similar (0.62, Coefficient of variance) value of all five NIS variables. Lee and Lee (2019) coined the term the ‘balanced Catching-up NIS’ economies which focus on the service sector. The balanced catching-up cluster includes Singapore, Hong Kong, Ireland and Spain and has 0.66 as the coefficient of variance.
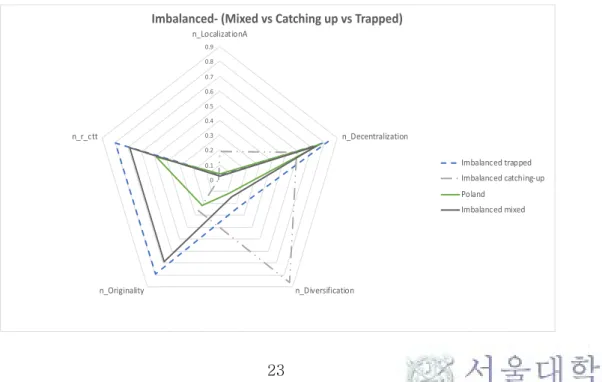
Figure 3B shows the radial graph of imbalanced NIS clusters, i.e. the imbalanced trapped, the imbalanced Catching-up and the imbalanced mixed. The imbalanced trapped refers to a cluster of economies failed to grow beyond the MIT and includes Mexico, Brazil, Argentina, South Africa and Thailand. This cluster shows a very imbalanced radial graph (0.7 Coefficient of variance), implying low levels of normalized diversification and localization NIS, and comparatively high levels of normalized relative cycle time of technology, decentralization and originality NIS. The imbalanced Catching-up indicates a cluster of East Asian catching-up economies (S. Korea, Taiwan and China) and has the highest value of coefficient of variation, 0.89. Characteristics of this cluster has low values of cycle time of technology and originality, and relatively high value of localization and diversification NIS.
Poland, Chile and Malaysia that have recently grown beyond the MIT can be classified into the imbalanced mixed cluster which has a high value of coefficient of variation, 0.75. Study of Chile and Malaysia analyzed by Lebdioui, Lee and Pietrobelli (2020) suggests that firms in the resource-based sector level close the technological gap with frontier capabilities. Meanwhile, Figure 3B captures that Poland has relatively low levels of normalized relative cycle time of technology, originality, localization and diversification NIS, and a high level of
normalized decentralization NIS. It shows that Poland does not belongs to the NIS growth path type.
Figure 3A. Radial graph of Balanced Clusters (Mature, Catching-up and Mixed)
Figure 3B. Radial graph of Imbalanced clusters (trapped, Catching-up and mixed) 0 0.1 0.2 0.3 0.4 0.5 0.6 0.7 0.8 0.9 1 n_LocalizationA n_Decentralization n_Diversification n_Originality n_r_ctt
Balanced- (Mature vs Catching up vs mixed)
Balanced Mature balanced mixed Balanced Catching up NIS
0 0.1 0.2 0.3 0.4 0.5 0.6 0.7 0.8 0.9 n_LocalizationA n_Decentralization n_Diversification n_Originality n_r_ctt
Imbalanced- (Mixed vs Catching up vs Trapped)
Imbalanced trapped Imbalanced catching-up Poland
6.2 NIS comparison
Cycle time of technologies
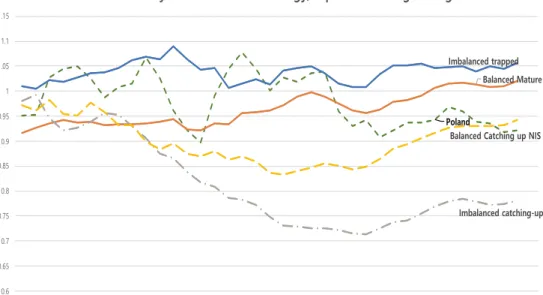
Figure 4A and B shows trends of the relative cycle time of technology (CTT) from 1980 to 2019 using 4 period moving average value. The relative CTT for the imbalanced trapped has a long stagnant trend above 1 the relative CTT. The balanced mature has an increasing trend of the relative CTT from 0.92 to 1.02, which is consistent with the fact that advanced countries have developed technologies with long longevity such as pharmaceutical technology. The imbalanced catching-up shows the extremely interesting pattern of the relative CTT, which has much lower value of the CTT than any other clusters. A sustain decline of this variable since 1980 implies that the success of East Asian economies is positively correlated with specialization in the short cycle technology.
Compared to other trapped economies shown in Figure 4B, the trend of Poland is evident. Poland has experienced decreasing trend since 1999, whereas Brazil, Argentina, Mexico, South Africa have high values of the relative cycle, which exceed 1. Moreover, Poland reached 0.9085 relative CTT in 2008. A short CTT means that the country focuses on the short life span of the knowledge, which does less rely on old technology and does more opportunity for new technology. According to appendix Table1, Poland was not focused on the specific patent class in 1996, however, in 2008, it focused on Electric communication technique, and recently, in 2019 focused on Computing calculating class. A short CTT in these field of patents appears to promote Poland to achieve economic growth.
Figure 4A. The Relative cycle time of technologies
Figure 4B. The Relative cycle time of technologies
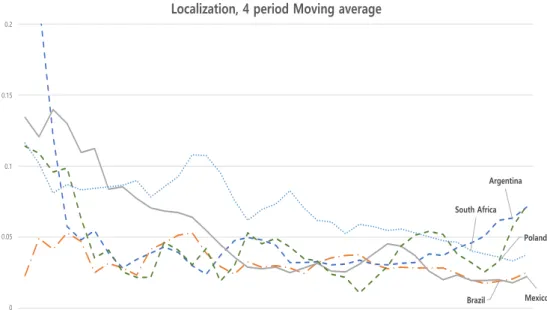
Knowledge localization
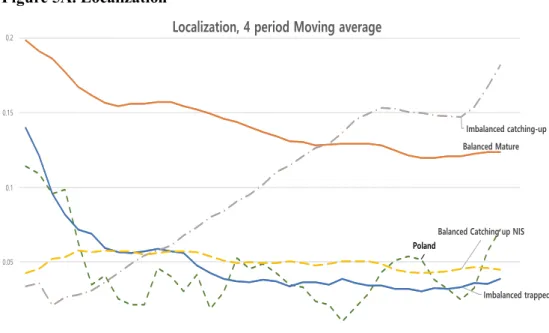
Figure 5A and B represents the localization NIS variable trends in cluster and country level respectively. Although the trend of the
Poland Imbalanced trapped
Balanced Mature
Imbalanced catching-up Balanced Catching up NIS
0.6 0.65 0.7 0.75 0.8 0.85 0.9 0.95 1 1.05 1.1 1.15 1983198419851986198719881989199019911992199319941995199619971998199920002001200220032004200520062007200820092010201120122013201420152016201720182019
The Relative cycles times of Techonolgy, 4 period Moving average
Argentina Brazil Mexico Poland South Africa 0.6 0.65 0.7 0.75 0.8 0.85 0.9 0.95 1 1.05 1.1 1.15 1983198419851986198719881989199019911992199319941995199619971998199920002001200220032004200520062007200820092010201120122013201420152016201720182019 The Relative cycles times of Techonolgy, 4 period Moving average
localization NIS for the balanced mature has a decreasing pattern, the value of the cluster remains higher than other clusters, except the imbalanced catching-up. The imbalanced catching-up has a steady and increasing trend of the localization of knowledge creation and diffusion since 1985 and overtakes the level of the balanced mature. Since the localization of knowledge creation and diffusion captures the extent to which patent citations are made within national boundaries, a finding is not surprising. Whereas the balanced catching-up, and the imbalanced trapped face long and low levels of localization trends.
As Figure 5B shows, Poland has experienced a low level of the localization NIS, albeit increases the value recently. Argentina, South Africa, Brazil and Mexico also do not demonstrate a similar catch-up as the imbalanced catching-up in terms of the localization of knowledge creation and diffusion. The decline trend during the 1980 in Argentina and Mexico coincides with the decline trend of the GDP per capita ratio to US per capita income.
Figure 5A. Localization
Poland
Imbalanced trapped Balanced Mature
Imbalanced catching-up
Balanced Catching up NIS
0 0.05 0.1 0.15 0.2 1983198419851986198719881989199019911992199319941995199619971998199920002001200220032004200520062007200820092010201120122013201420152016201720182019 Localization, 4 period Moving average
Figure 5B. Localization
Technological Diversification
Trends of the technological diversification NIS are presented in Figure 6A and B. The diversification for the balanced mature remains the highest level among clusters for 40 year. The imbalanced catching-up has steadily raised the diversification level since 1980 from 0.17 in 1983 to 0.85 in 2019 which is equivalent to the level of the balanced mature in 2019. The diversification for the balanced catching-up, and the imbalanced trapped have experienced the increasing trends, however, the value is much lower than that of the balanced mature or the imbalanced catching-up.
Poland have experienced a rapid increase in the diversification since 2010. However, shown in Figure 6A and B, the diversification level of Poland is lower than the level of the imbalanced trapped and the trapped economies like Brazil, Mexico and South Africa.
Argentina Brazil Mexico Poland South Africa 0 0.05 0.1 0.15 0.2 1983 1984 1985 1986 1987 1988 1989 1990 1991 1992 1993 1994 1995 1996 1997 1998 1999 2000 2001 2002 2003 2004 2005 2006 2007 2008 2009 2010 2011 2012 2013 2014 2015 2016 2017 2018 2019
Figure 6A. Technological Diversification
Figure 6B. Technological Diversification
Originality
Figure 7A and B show the patterns of the originality NIS. Although variations of the originality trend can be identified in all clusters in
Poland Imbalanced trapped
Balanced Mature
Imbalanced catching-up Balanced Catching up NIS
0 0.05 0.1 0.15 0.2 0.25 0.3 0.35 0.4 0.45 0.5 0.55 0.6 0.65 0.7 0.75 0.8 0.85 0.9 0.95 1 1983198419851986198719881989199019911992199319941995199619971998199920002001200220032004200520062007200820092010201120122013201420152016201720182019 Diversification, 4 period Moving average
Argentina Brazil Mexico Poland South Africa 0 0.05 0.1 0.15 0.2 0.25 0.3 0.35 0.4 0.45 0.5 0.55 0.6 0.65 0.7 1983198419851986198719881989199019911992199319941995199619971998199920002001200220032004200520062007200820092010201120122013201420152016201720182019 Diversification, 4 period Moving average
Figure 7A, the originality trends share a long and steady increase pattern among the clusters. Figure 7B captures that the originality of Poland slightly lags behind Mexico, Brazil, South Africa and Argentina. This implies the originality has failed to bring a difference in NIS.
Figure 7A. Originality
Figure 7B. Originality
Poland
Imbalanced trapped
Balanced Mature
Imbalanced catching-up Balanced Catching up NIS
0.25 0.3 0.35 0.4 0.45 1983 1984 1985 1986 1987 1988 1989 1990 1991 1992 1993 1994 1995 1996 1997 1998 1999 2000 2001 2002 2003 2004 2005 2006 2007 2008 2009 2010 2011 2012 2013 2014 2015 2016 2017 2018 2019 Originality, 4 period Moving average
Argentina Brazil Mexico Poland South Africa 0.25 0.3 0.35 0.4 0.45 1983 1984 1985 1986 1987 1988 1989 1990 1991 1992 1993 1994 1995 1996 1997 1998 1999 2000 2001 2002 2003 2004 2005 2006 2007 2008 2009 2010 2011 2012 2013 2014 2015 2016 2017 2018 2019
Decentralization across the assignee
Figure 8A and B shows the trend of the decentralization NIS or inverse concentration across the assignee in the cluster and country level, respectively. The decentralization for the balanced mature remains the highest level for 40 years among the clusters. In contrast, the decentralization NIS for the imbalanced catching-up cluster shows the large discrepancy with the balanced mature in the late 1990. Moreover, the imbalanced catching-up has been lagged behind the imbalanced trapped since 2000. In contrast, in the balanced mature cluster, inventions are spread more widely among a larger number of assignees, wherein in the imbalanced catching, they are dominated by a smaller number of assignees.
Shown in Figure 8A, Poland has been improved in the decentralization NIS variables, compared to other clusters. However, Figure 8B shows that Poland has comparatively low values of the decentralization than other trapped economies, South Africa, Brazil, Argentina and Mexico. Brazil and Argentina show a high degree of decentralization, which is the same level as that of the balanced mature cluster. Thus, this finding represents the decentralization NIS cannot be the key engine for growth beyond middle-income trap.
Figure 8A. Decentralization
Poland
Imbalanced trapped
Balanced Mature
Imbalanced catching-up Balanced Catching up NIS
0.75 0.8 0.85 0.9 0.95 1 1983 1984 1985 1986 1987 1988 1989 1990 1991 1992 1993 1994 1995 1996 1997 1998 1999 2000 2001 2002 2003 2004 2005 2006 2007 2008 2009 2010 2011 2012 2013 2014 2015 2016 2017 2018 2019 Decentralization , 4 period Moving average
Figure 8B. Decentralization
Research and Development (R&D)
Shown in Figure 9A, the research and development expenditure ratio for the imbalanced catching-up has surged from 1% in 1996 to 3.2% in 2018 and grown beyond the level of the balanced mature. The R&D ratio for the balanced mature sustains 2 percent of GDP, which is almost twice as large as the value for the imbalanced trapped. It can be identified in Figure 10A that all high-income clusters including the catching-up clusters and the mature cluster exceeds 1 percent of the R&D expenditure ratio to GDP. The R&D ratio seems to have positive relation with economic growth when the ratio exceeds the threshold, 1 percent to GDP.
In Figure 9B, Poland has sustained small growth in the R&D ratio, which has exceeded 1 percent to GDP in 2019. Meanwhile, the trapped economies such as South Africa, Argentina and Mexico have no increase in the variable. However, Brazil exceeds the threshold ratio. R&D expenditure alone appears to not have the positive influence on economic growth.
Argentina Brazil Mexico Poland South Africa 0.75 0.8 0.85 0.9 0.95 1 1983 1984 1985 1986 1987 1988 1989 1990 1991 1992 1993 1994 1995 1996 1997 1998 1999 2000 2001 2002 2003 2004 2005 2006 2007 2008 2009 2010 2011 2012 2013 2014 2015 2016 2017 2018 2019
Figure 9A. R&D Expenditure Ratio to GDP
Source: World Bank database and Taiwan Statistics authorities
Figure 9B. R&D Expenditure Ratio to GDP
Source: World Bank database and Taiwan Statistics authorities
Poland
Imbalanced trapped Balanced Mature Imbalanced catching-up
Balanced Catching up NIS
0 0.2 0.4 0.6 0.8 1 1.2 1.4 1.6 1.8 2 2.2 2.4 2.6 2.8 3 3.2 3.4 1999 2000 2001 2002 2003 2004 2005 2006 2007 2008 2009 2010 2011 2012 2013 2014 2015 2016 2017 2018 R&D(%GDP), 4 period Moving average
Argentina Brazil Mexico Poland South Africa 0.2 0.4 0.6 0.8 1 1.2 1999 2000 2001 2002 2003 2004 2005 2006 2007 2008 2009 2010 2011 2012 2013 2014 2015 2016 2017 2018
Tertiary enrollment ratio
Figure 10A presents the tertiary enrollment ratio as NIS variable. The balanced mature has sustained increasing trend of the tertiary ratio from 26% in 1993 to 65% in 2018, whereas the imbalanced trapped has increased the rate by 30% to 52% in 2018. The balanced catching-up has reached 80% in 2018. The imbalanced catching-up clusters also has exceeded 65% of the enrollment ratio since 2017. The imbalanced trapped lags behind by 30% compared to the balanced catching-up in 2015. Poland’s the tertiary enrollment ratio has been surged from less than 20% before 1995 to 75% in 2011 and surpassed other clusters.
Poland has experienced a rapid increase in the tertiary enrollment rate variable, whereas shown in Figure 10B, the enrollment rates for Brazil, Mexico and South Africa are below than 51%. However, Argentina has an increasing trend of the tertiary rate to 88% in 2018. Then, it may interpret that this variable alone cannot be used as the indicator of economic growth.
Figure 10A. Tertiary Enrollment Ratio
Source: World Bank database
Poland
Imbalanced trapped Balanced Mature
Imbalanced catching-up Balanced Catching up NIS
Imbalanced Catching-up2 0 10 20 30 40 50 60 70 80 90 100 198319841985198619871988198919901991199219931994199519961997199819992000200120022003200420052006200720082009201020112012201320142015201620172018
Figure 10B. Tertiary Enrollment Ratio
Source: World Bank database
Chapter 7.
Data Envelopment Analysis Result
This section shows the result of DEA. Because of the missing data issue in R&D expenditure and the tertiary enrollment rate, this study selects 26 countries to measure the efficiency of NIS variables on the total factor productivity growth rate. For consistency in the calculation of TFP, TFP at constant national prices data of Penn World Table 9.1 was used (Feenstra, Inklaar and Timmer, 2015). The data from 1999 to 2008 were used to measure the efficiency of Poland's transition from a middle-income country to a high-income country of more than 40 percent of the per capita income of the United States. Table 3 shows the average value of seven NIS variables during the period and the relative efficiency indicators as results of the DEA.
Both input oriented and output oriented methods show robust relative efficiency results. If a value of output oriented CCR efficiency Argentina Brazil Mexico Poland South Africa 10 20 30 40 50 60 70 80 90 100 1983 1984 1985 1986 1987 1988 1989 1990 1991 1992 1993 1994 1995 1996 1997 1998 1999 2000 2001 2002 2003 2004 2005 2006 2007 2008 2009 2010 2011 2012 2013 2014 2015 2016 2017 2018 2019
is 1, a DMU, one of selected countries, is efficient, while more than a value of 1 indicates that a DMU is inefficient. Hong Kong, for instance, has a score of 1.671, which means that it should be possible to increase the TFP growth rate by 67% with the same level of inputs. If a value of input oriented CCR efficiency is 1, a country is efficient; less than a value of 1 means a country is inefficient. For example, South Korea could reduce the NIS input variables by 2.1%, and produce the same level of the TFP growth. As Table 3 shows, high-income countries with slower economic growth have resulted in relative low efficiency rates. Other trapped countries, Argentina, Brazil, and Mexico have also low levels of the relative efficiency rate. While both Malaysia and Chile follow the resource-based growth path, Malaysia uses NIS for TFP growth efficiently, however, Chile faces the negative TFP growth rate. Poland, China, and Malaysia belong to the efficient frontier, followed by Russia and South Korea. Thus, it can be inferred that Poland sought the efficient use of NIS variables in the growth of TFP.
Table 3. DEA results (1999-2008 average)
DMU Localization Relative CTT Diversification Decentralization Originality RD tertiary TFP growth rate CCR_eff_Input CCR_eff_Output
China 0.042 0.781 0.573 0.966 0.370 1.147 15.006 2.914 1.000 1.000 Malaysia 0.021 0.796 0.255 0.917 0.384 0.624 28.108 2.049 1.000 1.000 Poland 0.032 0.986 0.162 0.930 0.349 0.587 59.420 1.583 1.000 1.000 Russian Federation 0.041 1.015 0.463 0.986 0.372 1.121 67.165 2.553 0.981 1.019 Korea, Rep. 0.135 0.705 0.818 0.831 0.291 2.533 87.733 2.240 0.979 1.021 Greece 0.015 0.997 0.139 0.908 0.345 0.573 69.907 0.699 0.599 1.671
Hong Kong SAR, China 0.092 0.812 0.476 0.989 0.451 0.669 38.342 1.182 0.551 1.814
Sweden 0.111 0.983 0.793 0.975 0.336 3.493 74.821 1.228 0.464 2.157 India 0.035 0.899 0.371 0.928 0.356 0.771 11.253 0.772 0.398 2.515 United Kingdom 0.092 0.974 0.904 0.996 0.370 1.603 59.498 0.791 0.272 3.681 United States 0.738 0.893 0.940 0.997 0.391 2.593 78.026 0.771 0.257 3.896 Israel 0.063 0.882 0.713 0.992 0.363 4.033 56.201 0.590 0.207 4.839 Netherlands 0.090 0.948 0.775 0.930 0.417 1.753 56.282 0.552 0.197 5.076 Argentina 0.032 1.040 0.203 0.939 0.337 0.432 62.062 0.279 0.196 5.092 Switzerland 0.132 1.012 0.813 0.993 0.358 2.570 43.355 0.541 0.192 5.202 Ireland 0.036 0.889 0.355 0.974 0.349 1.166 54.536 0.261 0.118 8.488 France 0.152 0.966 0.899 0.993 0.360 2.092 52.175 0.333 0.117 8.517 Canada 0.106 0.949 0.896 0.994 0.385 1.930 61.256 0.096 0.032 31.111 Brazil 0.030 1.035 0.404 0.975 0.395 1.031 25.557 0.004 0.002 632.200 Chile 0.043 1.038 0.143 0.901 0.428 0.342 50.444 -0.626 0.000 Denmark 0.082 1.026 0.626 0.969 0.423 2.434 69.207 -0.090 0.000 Spain 0.042 0.964 0.566 0.984 0.365 1.046 63.837 -0.578 0.000 Italy 0.149 0.968 0.843 0.987 0.373 1.066 59.129 -0.786 0.000 Mexico 0.031 1.030 0.340 0.955 0.406 0.377 23.022 -0.958 0.000 Norway 0.054 1.083 0.546 0.986 0.374 1.564 74.176 -0.299 0.000 Portugal 0.015 1.036 0.103 0.859 0.377 0.860 53.707 -0.222 0.000
Chapter 8.
Concluding Remarks
This paper first uses five national innovation system variables, i.e. the relative cycle time of technology, the localization, the originality, the decentralization and the diversification of knowledge to carry out clustering analysis and compares the performance of 33 selected economies. The clustering analysis identifies not only several types of economies such as the balanced mature, the imbalanced mixed and the imbalanced trapped, but also confirms catching-up NIS clusters which succeed in growth beyond MIT. The analysis identifies the uniqueness of Poland economic growth in the sense that it does not belongs to existing catching-up NIS types.
Unlike two pathways to catch up from middle-income countries to high-income, Poland has relatively low levels of relative cycle time of technology, originality, localization and diversification NIS, and a high level of decentralization NIS. As the granted Polish patent of U.S. patent data is concentrated on the electric communication technique class, Poland has focused on the short cycle technology. Moreover, R&D expenditure (%GDP) and the tertiary education enrollment rate have been increased. Poland has a steady increasing trend of tertiary enrollment rate 75% in 2012, and it exceeds 1% of GDP as R&D expenditure.
From 1996 to 2008, Poland’s economic growth beyond the MIT was not explained in much part by the accumulation of capital and labor. Studies of total factor productivity, unexplained part of the growth, have rarely addressed the national innovation system. In this study, Data envelopment analysis measures the efficiency of seven NIS variables which additionally include R&D expenditure (%GDP) and the tertiary education enrollment rate on the TFP growth. Both input oriented and output oriented CCR model indicate that already high-income economies such as U.K., U.S., and Netherlands have moderate relative efficiency. And trapped countries show relatively inefficient
use of NIS variables. Mexico has a negative TFP growth rate. On the other hand, Poland, China and Malaysia use the national innovation system most efficiently among selected sample countries. It can be argued that Poland has efficiently used the national innovation system in the growth of total factor productivity.
Bibliography
Amsden, A.H. and Chu, W.W. (2003). Beyond late development: Taiwan's upgrading
policies. Boston: MIT Press.
Balcerzak, A. P., & Zurek, M. (2011). Foreign direct investment and unemployment : VAR
analysis for Poland in the years 1995-2009, European Research Studies Journal, 14(1): 3-14,
accessed 20 June 2020 from Springer database.
Breznitz, D. and Ornston, D. (2017). EU financing and innovation in Poland. EBRD Working
Paper No. 198, accessed 20 June 2020 from SSRN database.
Castellacci, Fulvio, and Archibugi, Daniele. (2008). The technology clubs: The distribution
of knowledge across nations. Research policy, 37(10): 1659-1673, accessed 15 May 2020
from JSTOR database.
Charnes, A., Cooper, W.W. and Rhodes, E. (1978). Measuring the efficiency of decision
making units. European journal of operational research, 2(6): 429-444, accessed 10 June
2020 from Springer database.
Chase-Dunn, C., Kawano, Y., and Brewer, B. D. (2000). Trade globalization since 1795:
Waves of integration in the world-system. American Sociological Review, 65(1): 77–95,
accessed 20 June 2020 from Springer database.
Cirera, Xavier, and William F. Maloney (2017). The Innovation Paradox. Washington, DC:
World Bank.
EBRD (2014). Transition Report 2014, accessed 18 June 2020 from EBRD database.
Eichengreen, Barry, Park Donghyun, and Shin Kwanho (2013). Growth Slowdowns Redux:
New Evidence on
the Middle-Income Trap. NBER Working Paper No. 18673
Feenstra, R., Inklaar, R., and Timmer, M. (2015). The Next Generation of the Penn World
Table. American Economic Review, 105(10): 3150-3182 accessed 20 May 2020 from JSTOR
database.
Gill, Indermit S., and Homi Kharas (2007). An East Asian Renaissance: Ideas for Economic
Growth. washington, DC: World Bank.
Godinho, Manuel M., Mendonca, Sandro F., and Pereira, Tiago S. (2005). Towards a taxonomy of innovation
systems. Instituto Superior de Economia e Gestão - DE Working papers No.13, accessed 20
May 2020 from https://www.repository.utl.pt/handle/10400.5/2682.
Grossman, G.M. and Helpman, E. (1991). Trade, knowledge spillovers, and growth.
European economic review, 35(2-3): 517-526, accessed 18 June 2020 from NBER database.
Hagemejer, J., and Kolasa ,M. (2011). Internationalisation and Economic Performance of
Enterprises: Evidence from Polish Firm-level Data, The World Economy, 34 (1): 74-100,
Han, Xuehui, and Shang-Jin Wei (2015). Re-examining the Middle-Income Trap Hypothesis: What to Reject
and What to Revive. The ADB, Economics Working Paper Series No. 436
Im, Fernando Gabriel, and David Rosenblatt (2013). Middle-income traps: A conceptual and
Empirical survey. The World Bank, Policy Research Working Papers No. 6954
International Monetary Fund. (2019). World economic outlook, accessed 5 May 2020 from
IMF database.
Iradian, Garbis (2007). Rapid Growth in Transition Economies: Growth-Accounting
Approach. IMF Working Paper No. 07/164, accessed 20 June 2020 from SSRN database.
Jaffe, Adam B., and Trajtenberg, M. (2002). Patents, Citations, and Innovations: A Window
on the Knowledge Economy. Cambridge: MIT Press.
Jaffe, Adam B., Trajtenberg, M., and Henderson, R. (1993). Geographic Localization of
Knowledge Spillovers as Evidenced by Patent Citations. Quarterly Journal of Economics,
108(3):577-598, accessed 20 May 2020 from JSTOR database.
Kaüger, J.J., Cantner, U. and Hanusch, H., (2000). Total factor productivity, the East Asian
miracle, and the world production frontier. Weltwirtschaftliches Archiv, 136(1):111-136,
accessed 19 June 2020 from Springer database.
Kosztowniak, A. (2013). Foreign Direct Investment as a Factor of Economic Growth in
Poland. Empirical Analysis for the Period 1995-2012. Advances in Economics and Business,
1(2): 203-212, accessed 18 June 2020 from JSTOR database.
Lebdioui, A., Lee, K. and Pietrobelli, C. (2020). Local-foreign technology interface, resource-based development, and industrial policy: how Chile and Malaysia are escaping the
middle-income trap. The Journal of Technology Transfer, (0): 1-26, accessed 19 June 2020
from Springer database.
Lee, Keun (2013). Schumpeterian Analysis of Economic Catch-up: Knowledge,
Path-Creation, and the Middle-Income Trap. Cambridge: Cambridge University Press.
Lee, Keun and Kim, B.Y. (2009). Both institutions and policies matter but differently for different income groups of countries: Determinants of long-run economic growth revisited.
World development, 37(3): 533-549, accessed 20 May 2020 from JSTOR database.
Lee, Keun. and Lee, Jongho. (2019). Variety of National Innovation Systems and Alternative
Pathways to Growth beyond the Middle-Income Stage: Balanced, Imbalanced, Catching-up, and Trapped NIS. Working Paper.
Lundvall, Bengt-Åke (1992). National systems of innovation: Toward a theory of innovation
and interactive learning. London: Anthem Press.
Martin, M. (2013). Constructing Capitalisms: Transforming Business Systems in Central and
Milligan, Glenn W., and Cooper, M.C. (1985). An examination of procedures for determining
the number of clusters in a data set. Psychometrika 50(2): 159-179, accessed 20 May 2020
from JSTOR database.
OECD (2015). Frascati Manual 2015: Guidelines for Collecting and Reporting Data on
Research and Experimental Development, accessed 20 May 2020 from http://dx.doi.org/10.1787/9789264239012-en
OECD (1997). National Innovation Systems, accessed 20 May 2020 from OECD database.
Piatkowski, M. (2018). Europe's Growth Champion: Insights from the Economic Rise of
Poland, Oxford: OUP
Rokach, L., and Maimon, O. (2005). Clustering Methods. In: Maimon, Oded, and Lior
Rokach (eds). Data Mining and Knowledge Discovery Handbook, accessed 20 May 2020
from Springer database.
Sachs, J. (1993). Poland’s Jump to the Market Economy, Boston: MIT press.
World Bank (2012). China 2030: Building a Modern, Harmonious, and Creative
High-Income Society. Washington, DC: World Bank.