Lean Six Sigma in East Africa: Findings from a Pilot Study
ABSTRACT
Purpose
This paper reports the results of a pilot study on the implementation of LSS in East African service and manufacturing organizations. The aim was to determine the critical success factors for implementation of such a strategy as well as any barriers. A further aim was to determine the knowledge, usage and usefulness of Lean Six Sigma tools and techniques within those organizations.
Methodology
A quantitative approach was taken utilizing a survey questionnaire which was sent to a sample of
organisation employees who had attended Yellow, Green or Black Belt Lean Six Sigma courses organised by the Kenya Institute of Management in Nairobi. Employees attending such courses came from Kenya, Uganda, Tanzania and Rwanda.
Findings
Results indicate that the most useful tools are most of the original 7 tools of quality improvement proposed by Ishikawa over 50 years ago and the most important factor for successful implementation of LSS is management involvement and participation.
Research Implications and Limitations
The findings have implications for trainers, consultants and practitioners with regards to the implementation of Lean Six Sigma within organizations as well as the focus of the content of Lean Six Sigma training courses. The main limitation is that this is a pilot study so to confirm the findings a full survey of East African organization needs to be undertaken.
Originality/value
This paper reports the first study on the implementation of Lean Six Sigma in East Africa and will be of value to practitioners, trainers, consultants and researchers of Lean Six Sigma in East Africa and beyond.
Keywords Lean six sigma, Training, Critical success factors, East Africa.
Paper type Research paper
Introduction
This paper examines the state of Lean Six Sigma implementation in East African Organisations that have introduced Lean Six Sigma as part of their business strategy and have already committed resources to the
acquisition and training of staff in order to begin to create the necessary infrastructure of Lean Six Sigma, i.e. Champions, Master Black Belt, Black Belt, Green Belt and Yellow Belt.
Lean originated at Toyota in Japan and Six Sigma was founded by Motorola in the USA. The term “Lean Thinking” was first used by Womak and Jones (1996) and was based on the Toyota Production System (TPS) approach to manufacturing. The system was based on the identification of value-added and non value added activities. Non value-added activities, or waste, were then eliminated. A range of tools such as Value Stream Mapping (VSM), single minute exchange of die (SMED) and 5S were employed to help achieve lean goals (Pepper and Spedding, 2010). Six Sigma was developed to reduce variation and bring structure to
process improvement through the define-measure-analyse-improve-control (DMAIC) cycle (Pande et al.,
2000). Each stage in the improvement cycle has a number of tools and techniques associated with it that provide the users with the means to bring about the necessary improvements (Keller, 2005). Indeed Six Sigma relies on approximately 140 statistical tools and concepts within the DMAIC approach (Bendell, 2006).
Lean Six Sigma describes the integration of the lean philosophy and associated tools and techniques with the six sigma philosophy and its associated tools and techniques. Both improvement philosophies had
experienced individual successes in a wide range of industries but their integration offered an even more powerful improvement philosophy with associated tools and techniques (Pepper and Spedding, 2010). Lean Six Sigma combines the waste elimination tools and techniques of lean with the variation reduction tools and techniques of six sigma (Antony et al., 2004). Lean Six Sigma deals with issues that would otherwise be
overlooked if the two were applied individually (Salah et al., 2010). The combined approach can simultaneously achieve cost, quality, variability and lead time improvements.
Lean Six Sigma enables improvement people to select the right tools to deal with different problems. It is important to stress that not all problems require the DMAIC approach, which is for more complex problems; some problems require a faster approach such as Kaizen (Salah et al., 2010). The advantages of integration
have been documented by various researchers including Arnheiter and Maleyoff (2005), Snee (2010) and Salah et al., (2010).
Lean Six Sigma Implementation
Training
As with all new initiatives Lean Six Sigma introduction requires new skills and this means training employees to Yellow, Green and Black Belt levels so that they will have the necessary skill sets to participate and manage improvement projects. The number and range of tools and techniques available in the Lean Six Sigma tool kit is vast and it is critical that staff are aware of them and importantly, trained in their use as well as being able to follow the DMAIC methodology (BSI, 2011). It is vital that organizations get the training right. Courses should cover the basic DMAIC approach and core Lean Six Sigma tools and techniques but also creative thinking, project management and team working (Lee-Mortimer, 2006). Interestingly, Japanese quality guru Ishikawa, the founder of the Quality Circle, stated that 95% of quality related problems could be solved using the 7 basic tools of quality (Antony and Kumar, 2010) that were the
basis of Total Quality Management (TQM) i.e. Control charts, histograms, check sheets, scatter diagrams, cause and effect diagrams, flow charts and pareto charts (Arnheiter and Maleyeff, 2005).
In a study of large UK based organizations primarily from the automotive, machinery and aerospace sectors (n=27) Antony et al. (2004) found that the most popular tools and techniques with regards to usage were
pareto analysis, cause and effect analysis, root cause analysis, brainstorming, 5S and benchmarking with all respondents utilizing these tools and techniques. The least popular with regards to usage were design of experiments (DOE), robust design and regression analysis, with less than 50% of respondents utilizing these tools.
The International Standard for Six Sigma, BS ISO 13053-1 (BSI, 2011) recommends the minimum competencies for six sigma personnel depending on their belt level. Table 1 below shows some of these competencies and the required level where 0 = skill not needed, 1 = basic competence, 2 = proficient user and 3 = highest level of ability.
Take in Table 1 here
It is important that any training courses provide candidates with the appropriate level of knowledge and skill. However, Lean Six Sigma training programmes are expensive, typically between £5,000 and £10,000 in the UK to train someone to Black Belt. Small businesses in particular are reluctant to spend that money to develop staff to Green or Black Belt level. Davies (2004) believes that to be a false economy because of the potential payback that successful projects can deliver, claiming a Black Belt project is able to deliver 2.5 times the training cost within six months on of the first project. It should be remembered that organizations with a quality ethos should always view training as an investment not a cost.
Critical Success Factors for Lean Six Sigma Implementation
The literature on Lean Six Sigma is full of success stories from organizations that have implemented that approach to quality improvement. However there are many organizations that have not been so successful. In the UK study by Antony et al., (2004) respondents identified essential elements for success with Lean Six
Sigma as:
Top Management involvement and commitment
Resource allocation for training and for projects
Team selection and the right people within the team
Management of the organisation’s culture
Regular project reviews and tracking
Understanding of lean six sigma tools and techniques
Understanding of the integrated methodology
Project selection
Process owners responsible for sustaining the gains
Over the years a body of literature has emerged documenting those factors that are critical to success – critical success factors (CSFs). Antony et al.,(2005) utilized this body of literature to identify 11 CSFs:
1. Management involvement and participation 2. Organisational Infrastructure
3. Cultural change
4. Training
5. Linking Six Sigma to customers
6. Linking six sigma to business strategy
7. Linking six sigma to employees
8. Linking six sigma to suppliers
9. Understanding of six sigma methodology
10. Project management skills 11. Project prioritization and selection
These CSFs were adapted to include lean and were incorporated into the research questionnaire used in this pilot study.
Aims and Objectives
The main aims of this pilot study therefore were to examine the extent to which East African manufacturing and service organisations had implemented Lean Six Sigma. In order to achieve this aim the following research questions were developed:
What are the critical success factors for Lean Six Sigma implementation?
What are the barriers to successful Lean Six Sigma Implementation?
To what extent are organisations familiar with the many tools and techniques of Lean Six Sigma?
To what extent do East African organisations actually use those tools and techniques and how useful do they perceive them to be?
What benefits has Lean Six Sigma implementation brought to these organisations?
Research Method, Data and Analysis
In order to allow those research questions to be answered a survey questionnaire was designed. The questionniare was developed from the extant literature and is an adapted version of that developed by Antony et al. (2005) in their survey of Six Sigma implementation in small-and-medium-sized UK manufacturing enterprises. The modified questionnaire contains questions pertaining to lean tools and techniques and lean measures of performance. The questionnaire focused on operational matters associated with Lean Six Sigma. The questionnaire was sent to a sample of organisational employees who had attended Yellow, Green or Black Belt courses organised by the Kenya Institute of Management in Nairobi. A total of 23 questionnaires were returned. The data were analysed using SPSS version 21. Results of the survey are based primarily on descriptive statistics.
Demographics
The majority of respondents (n=15) worked for large companies, i.e. companies with more than 250 employees. There were 7 respondents from medium-sized companies, i.e. companies with 50-250 employees and only one respondent from a small company, i.e. less than 50 employees. The questionnaires were completed by Master Black Belt (1), Black Belts (9), Green Belts (8), Yellow Belts (3) and non-respondents (2).
The type of industries that participated in this study included retail , food processing , education and training, textiles, banking and finance, agriculture, health, utilities and manufacturing.
East African Organisations’ Experiences with Lean Six Sigma
(a) Number of Champions, Master Black Belts, Black Belts, Green Belts and Yellow Belts
Only 11 respondents reported that their organization had a Lean Six Sigma Champion. However the number of yellow belts in organizations ranged from 1 to 80 with the number of Green Belts ranging from 1 to 30. The maximum number of Black Belts reported in any organization was 7 and there was only one Master Black Belt in all the respondent organizations.
(b) Common Lean Six Sigma Metrics used by East African Companies
A metric is an attribute or specification against which process outputs are compared and declared acceptable or unacceptable. The most commonly used metrics cited by respondents were costs of poor quality (n=8), number of complaints (n=4) and process capability (n= 4). Others cited by respondents included percentage scrap, customer defections, defect rate, first time yield and throughput yield.
(c) Lean Six Sigma Projects Completed and their Financial Impact
Analysis of the results revealed that 72% of respondents had completed between one and five lean six sigma projects. About 14% had completed between five and ten projects, 5% had completed between ten and twenty projects and 9% had completed more than 20 projects. Of the 18 respondents who reported financial benefits from their projects 20% reported savings of between 500,000 and one million Kenya Shillings (KES) per year, 37% reported benefits of between 1million KES and 10million KES per year, 32% reported savings of between 10million KES and 50million KES per year, 5% reported benefits of greater than 100 million KES per year and one respondent didn’t know.
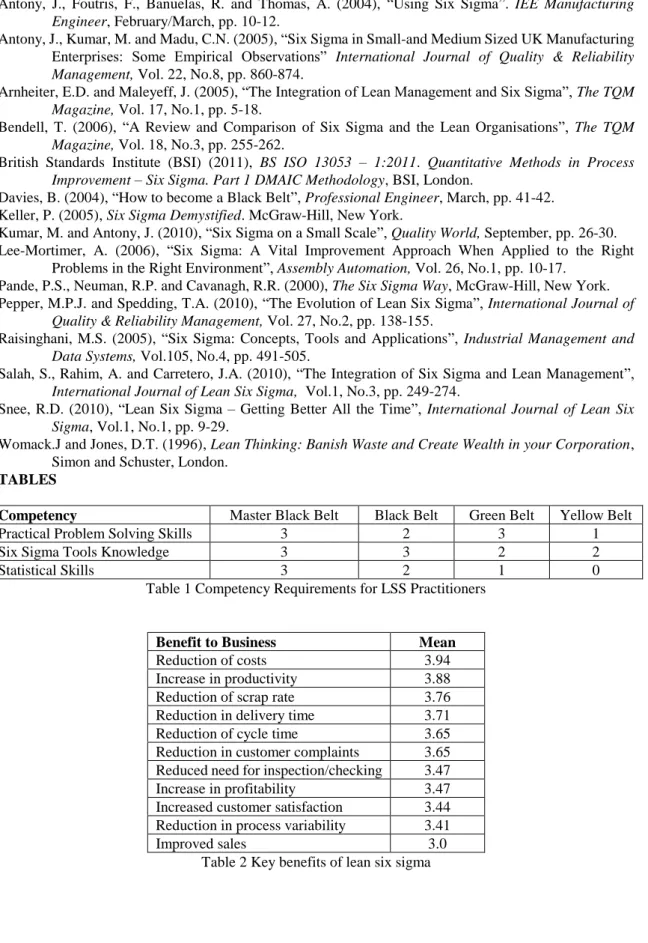
(d) Benefits of Lean Six Sigma
The respondents were asked to use a 5 point Likert scale to rate the benefits that lean six sigma had brought to their organizations since implementation, where 0 = no benefit, 1 = some benefit, 3 = significant benefit, 4 = very significant benefit and 5 = crucial. Table 2 below summarises the responses. The areas that have experienced the greatest benefit are reduction in costs, increased productivity, reduction in scrap and reduction in delivery time.
Take in Table 2 here
Overall these results suggest that the respondents perceive lean six sigma to have been of benefit to their organizations.
(e) Barriers to Lean Six Sigma success
Respondents were asked to identify the top three factors that they perceived to be barriers to the successful introduction of lean six sigma. Competing projects, lack of tangible results and change of management were perceived as the major barriers to successful implementation.
(f) Lean Six Sigma Tools and Techniques in East African Companies
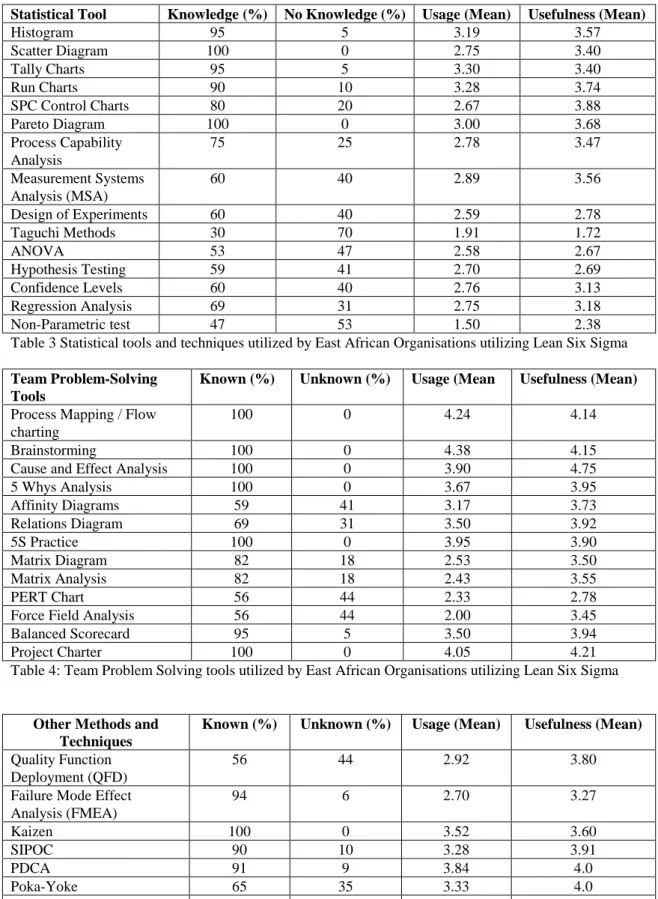
Lean Six Sigma utilizes both statistical and non-statistical tools and techniques within the DMAIC approach to problem solving. Respondents were asked about their knowledge with, their usage of and the usefulness of a range of tools, techniques and problem solving methods. Knowledge was either “yes” = Knowledge or “no” = No knowledge. Usage was rated on a 5 point Likert scale where 1 = Never been used, 2 = Used only once, 3 = Used rarely, 4 = Used frequently and 5 = Used continuously. Usefulness was rated on a 5 point likert scale where 1 = Not useful, 2 = Slightly useful, 3 = More useful, 4 = Very useful and 5 = Extremely useful. Table 3 below summarises the results for Statistical tools and techniques.
As can be seen from table 3 the most popular (i.e. knowledge of) tools were Pareto Diagram, Scatter Diagram, Histogram and Run Charts. Taguchi Methods, Non-Parametric tests and ANOVA were the least popular. The most commonly used tools and techniques were Tally Charts, Run Charts, Histogram and Pareto Diagram. The most useful statistical tools were SPC Control Charts, Run Charts and Pareto Diagrams. The least useful were identified as Taguchi Methods, Non-Parametric Tests and ANOVA. Based on these results it seems that the tools with more visual impact are used more and considered the most useful whereas the more complex statistical tools are not.
Take in Tables 3, 4 and 5 here
Tables 4 and 5 (above) summarise the results for team problem solving tools and other methods and techniques.
The most popular (knowledge of) problem solving tools (Table 4) are process mapping, brainstorming, cause and effect analysis, 5Whys analysis, 5S and the Project Charter. Interestingly, cause and effect analysis, Project charter, brainstorming and process mapping are also deemed to be the most useful tool. The most popular other methods and techniques (Table 5) are Kaizen and Benchmarking but the most useful are deemed to be Quality costing analysis, PDCA and Poka-Yoke.
(g) Critical Success Factors for Lean Six Sigma Implementation
Respondents had to rank the 11 CFSs discussed in 2.2 above on a 5 point Likert scale where 1= Not important, 2= Less important, 3=Important, 4=Very important and 5= Crucial. The aim was determine which factors East African organizations deemed to be important and by using previously identified CSFs the results of this study could be compared with previous studies. Figure 1 below shows the CSF scores for
East African Organisations where: A= Management Involvement and Participation, B=Organsational Infrastructure, C=Cultural Change, D=Training, E=Linking Lean Six Sigma to Customers, F=Linking Lean Six Sigma to business strategy, G=Linking Lean Six Sigma to Employees, H=Linking Lean Six Sigma to suppliers, I=Understanding of the lean six sigma methodology. J=Project Management skills and K=Project prioritization and selection.
Take in Figure 1 here
The top three CSFs were identified as Management involvement and participation (A), Organisational Infrastructure (B) and Cultural change (C). These results concur with the findings of Antony (2004) from a survey of UK service organizations where he found that the top three CSFs were Top management commitment (A), Cultural Change (C) and Linking Six Sigma to business strategy (F).
Conclusions
Lean Six Sigma is rapidly emerging as an important quality improvement strategy in East Africa. There are clearly benefits to be accrued from the implementation of such a strategy. However, the methodology is such that managers and employees require to be trained in the very many tools and techniques that make up the lean six sigma approach. However, the most important factor for successful implementation is management involvement and participation. Without this any improvement strategy will struggle to succeed.
Interestingly, of all the tools and techniques available in the lean six sigma improvement tool box it seems that the most popular and indeed the most useful are still most of the 7 quality improvement tools first proposed by Ishikawa in the 1960s when he invented the quality circle and which he later stated could solve 95% of quality related problems – process mapping, brainstorming, cause and effect analysis, pareto analysis and control charts. That is not to say the other tools and techniques are unimportant or not useful. The important thing is to use the right tool for the right job at the right time in the right environment and without knowledge of such tools, gained through training, this will not happen.
Implications
Clearly the findings have implications for the content of Lean Six Sigma training courses. The focus must be on giving trainees practice in using the most useful tools and techniques whilst ensuring they have knowledge of others that May prove useful over time. However, by their very nature Lean Six Sigma training courses are high intensity and this may work against trainees understanding more complex tools and techniques and having the time to practice their use in class. For even the most simple tools and techniques trainees must practice their use when they return to their organizations when their training is complete, When it comes to competence and confidence in using tools and techniques it really is a case of “use it or lose it”.
References
Antony, J. (2004), “Six Sigma in the UK service organizations: results from a pilot survey”, Managerial Auditing Journal, Vol. 19, No.8, pp. 1006-1013.
Antony, J., Foutris, F., Banuelas, R. and Thomas, A. (2004), “Using Six Sigma”. IEE Manufacturing Engineer, February/March, pp. 10-12.
Antony, J., Kumar, M. and Madu, C.N. (2005), “Six Sigma in Small-and Medium Sized UK Manufacturing Enterprises: Some Empirical Observations” International Journal of Quality & Reliability Management, Vol. 22, No.8, pp. 860-874.
Arnheiter, E.D. and Maleyeff, J. (2005), “The Integration of Lean Management and Six Sigma”, The TQM
Magazine, Vol. 17, No.1, pp. 5-18.
Bendell, T. (2006), “A Review and Comparison of Six Sigma and the Lean Organisations”, The TQM Magazine, Vol. 18, No.3, pp. 255-262.
British Standards Institute (BSI) (2011), BS ISO 13053 – 1:2011. Quantitative Methods in Process Improvement – Six Sigma. Part 1 DMAIC Methodology, BSI, London.
Davies, B. (2004), “How to become a Black Belt”, Professional Engineer, March, pp. 41-42. Keller, P. (2005), Six Sigma Demystified. McGraw-Hill, New York.
Kumar, M. and Antony, J. (2010), “Six Sigma on a Small Scale”, Quality World, September, pp. 26-30. Lee-Mortimer, A. (2006), “Six Sigma: A Vital Improvement Approach When Applied to the Right
Problems in the Right Environment”, Assembly Automation, Vol. 26, No.1, pp. 10-17.
Pande, P.S., Neuman, R.P. and Cavanagh, R.R. (2000), The Six Sigma Way, McGraw-Hill, New York.
Pepper, M.P.J. and Spedding, T.A. (2010), “The Evolution of Lean Six Sigma”, International Journal of
Quality & Reliability Management, Vol. 27, No.2, pp. 138-155.
Raisinghani, M.S. (2005), “Six Sigma: Concepts, Tools and Applications”, Industrial Management and Data Systems, Vol.105, No.4, pp. 491-505.
Salah, S., Rahim, A. and Carretero, J.A. (2010), “The Integration of Six Sigma and Lean Management”,
International Journal of Lean Six Sigma, Vol.1, No.3, pp. 249-274.
Snee, R.D. (2010), “Lean Six Sigma – Getting Better All the Time”, International Journal of Lean Six Sigma, Vol.1, No.1, pp. 9-29.
Womack.J and Jones, D.T. (1996), Lean Thinking: Banish Waste and Create Wealth in your Corporation,
Simon and Schuster, London.
TABLES
Competency Master Black Belt Black Belt Green Belt Yellow Belt
Practical Problem Solving Skills 3 2 3 1
Six Sigma Tools Knowledge 3 3 2 2
Statistical Skills 3 2 1 0
Table 1 Competency Requirements for LSS Practitioners
Benefit to Business Mean
Reduction of costs 3.94
Increase in productivity 3.88
Reduction of scrap rate 3.76
Reduction in delivery time 3.71
Reduction of cycle time 3.65
Reduction in customer complaints 3.65
Reduced need for inspection/checking 3.47
Increase in profitability 3.47
Increased customer satisfaction 3.44
Reduction in process variability 3.41
Improved sales 3.0
Statistical Tool Knowledge (%) No Knowledge (%) Usage (Mean) Usefulness (Mean) Histogram 95 5 3.19 3.57 Scatter Diagram 100 0 2.75 3.40 Tally Charts 95 5 3.30 3.40 Run Charts 90 10 3.28 3.74 SPC Control Charts 80 20 2.67 3.88 Pareto Diagram 100 0 3.00 3.68 Process Capability Analysis 75 25 2.78 3.47 Measurement Systems Analysis (MSA) 60 40 2.89 3.56 Design of Experiments 60 40 2.59 2.78 Taguchi Methods 30 70 1.91 1.72 ANOVA 53 47 2.58 2.67 Hypothesis Testing 59 41 2.70 2.69 Confidence Levels 60 40 2.76 3.13 Regression Analysis 69 31 2.75 3.18 Non-Parametric test 47 53 1.50 2.38
Table 3 Statistical tools and techniques utilized by East African Organisations utilizing Lean Six Sigma
Team Problem-Solving Tools
Known (%) Unknown (%) Usage (Mean Usefulness (Mean)
Process Mapping / Flow charting
100 0 4.24 4.14
Brainstorming 100 0 4.38 4.15
Cause and Effect Analysis 100 0 3.90 4.75
5 Whys Analysis 100 0 3.67 3.95 Affinity Diagrams 59 41 3.17 3.73 Relations Diagram 69 31 3.50 3.92 5S Practice 100 0 3.95 3.90 Matrix Diagram 82 18 2.53 3.50 Matrix Analysis 82 18 2.43 3.55 PERT Chart 56 44 2.33 2.78
Force Field Analysis 56 44 2.00 3.45
Balanced Scorecard 95 5 3.50 3.94
Project Charter 100 0 4.05 4.21
Table 4: Team Problem Solving tools utilized by East African Organisations utilizing Lean Six Sigma
Other Methods and Techniques
Known (%) Unknown (%) Usage (Mean) Usefulness (Mean)
Quality Function Deployment (QFD)
56 44 2.92 3.80
Failure Mode Effect Analysis (FMEA) 94 6 2.70 3.27 Kaizen 100 0 3.52 3.60 SIPOC 90 10 3.28 3.91 PDCA 91 9 3.84 4.0 Poka-Yoke 65 35 3.33 4.0 Benchmarking 100 0 3.35 3.50
Quality Costing Analysis 84 16 3.63 4.21
3.4 3.5 3.6 3.7 3.8 3.9 4 4.1 4.2 4.3 4.25 4.19 4.15 3.8 4.04 3.97 3.69 3.71 4.03 4 3.9 A B C D E F G H I J K