Hearing screening by telephone
fundamentals & applications
The research described in this thesis was carried out at the Audiology section of the department of Otorhinolaryngology / Head & Neck Surgery, VU University Medical Center, Amsterdam, the Netherlands.
Cover-design by Aaf
Printed by Febodruk BV ISBN-10: 90-9020208-0 ISBN-13: 978-90-9020208-2
Financial support for publication of this thesis was kindly provided by:
Nationale Hoorstichting, Stichting Atze Spoor Fonds, Oticon Nederland BV, Veenhuis Medical Audio BV, GN Resound BV, Siemens Audiologie Techniek BV, Schoonenberg Hoorcomfort.
Copyright © 2005 by Cas Smits. All rights reserved. No part of this publication may be reproduced, stored in a retrieval system, or transmittted, in any form or by any means, electronic, mechanical, photocopying, recording, or otherwise, without the prior written permision of the author.
VRIJE UNIVERSITEIT
HEARING SCREENING BY TELEPHONE fundamentals & applications
ACADEMISCH PROEFSCHRIFT
ter verkrijging van de graad Doctor aan de Vrije Universiteit Amsterdam op gezag van de rector magnificus
prof.dr. T. Sminia, in het openbaar te verdedigen ten overstaan van de promotiecommissie
van de faculteit der Geneeskunde op donderdag 12 januari 2006 om 10.45 uur
in de aula van de universiteit, De Boelelaan 1105
door
Jasper Cornelis Maria Smits
promotor: prof.dr.ir. T. Houtgast
Contents
Chapter 1 Chapter 2 Chapter 3 Chapter 4 Chapter 5 Chapter 6 Chapter 7 Chapter 8 General introduction
Development and validation of an automatic speech-in-noise screening test by telephone
Results from the Dutch speech-in-noise screening test by telephone
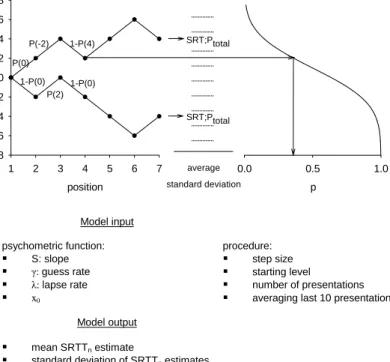
Measurements and calculations on the simple up-down adaptive procedure for speech-in-noise tests
Experiences with the Dutch functional hearing-screening tests by telephone and internet
Recognition of digits in different types of noise by normal-hearing and hearing-impaired listeners
Speech-reception-thresholds in noise and self-reported hearing disability in a general adult population
Summary and general discussion
Samenvatting Dankwoord Curriculum Vitae 7 15 39 53 83 93 113 135 149 153 155
Chapter
1
9 I. INTRODUCTION
Hearing impairment is one of the most frequent health problems in western societies. In the majority of cases is cure by surgery or medicine not possible. Therefore, hearing impairment must be considered a chronic disease and it is associated with considerable social-psychological and social-societal consequences (RGO, 2003).
The prevalence of hearing impairment in the Netherlands has been estimated to be between 4.5% and 11.4% (Chorus et al., 1995). Prevalence figures strongly depend on the definition of hearing impairment. Duijvestijn et al. (1999) showed that, depending on the used definition of hearing impairment, estimated prevalence of hearing impairment for Dutch people of 55 years and older vary between 8% and 38%.
Because presbyacusis is the most common cause of hearing impairment, the prevalence of hearing impairment strongly increases with age. In many western countries the population ages the coming years which will increase prevalence figures further.
The primary method for audiological rehabilitation is the prescribtion of hearing aids. However, it has been noted that the use of hearing aids among hearing impaired elderly is low. In the Netherlands, costs for hearing aids are partly reimbursed for people with better-ear average pure-tone thresholds of at least 35 dB at 1, 2 and 4 kHz. Davis (1997) reported the proportion of people who possess a hearing aid as a function of degree of hearing impairment in the UK. Only 6.6% of the people with average pure-tone thresholds (0.5, 1, 2, 4 kHz) in their better ear between 30-34 dB possess hearing aids. For the people with average thresholds between 55-64 dB this percentage increases to 57.3%. Popelka et al. (1998) found a prevalence of 14.6% of current hearing aid use among those with average thresholds of more than 25 dB. Gussekloo et al. (2003) showed for a Dutch population over 85 years of age, that 66% of the subjects with average thresholds (1, 2, 4 kHz) higher than 35 dB in their better ear did not have hearing aids.
Although only estimates of prevalence figures of hearing impairment and hearing aid possession are known, it can be stated that hearing impairment is a major problem, especially in older age groups, and auditory rehabilitation is inadequate.
Several reasons can be given for the low prevalence of hearing aids among the hearing impaired elderly. Probably the most important reason is a negative feeling about hearing aids. As Jerger et al. (1995) wrote : ‘Most older persons still view the use of a hearing aid as a sign of failing abilities instead of a sensory aid. Not wanting to be stigmatised as mentally incompetent, they are reluctant to take advantage of amplification systems.’ These negative feelings are often strengthened by unsatisfactory experiences with hearing aids by friends or relatives, who in many cases had linear analogue hearing aids. Besides, several studies have shown that, for a given hearing loss, the actually perceived hearing disability decreases with increasing age (Gordon-Sallant 1994, Wiley et al. 2000).
The availability of self-screening tests could be important to raise the awareness of hearing disability and to encourage persons to seek help for their hearing disabilities.
10
Screening for hearing loss in adults
Routine screening for hearing impairment is common practice in neonates, schoolchildren and workers in noisy environments. However, at least in the Netherlands, no general screening program for adults exists. Probably, such a screening program would not be cost-effectiven. Self-tests that can be used for screening are much cheaper, but likely less effective. Several screening instruments that can be used for self-screening are available. The American Academy of Otolaryngology- Head and Neck Surgery (AAO-HNS) developed a questionnaire called the Five-Minute Hearing test. Ventry and Weinstein (1983) developed the Hearing Handicap Inventory for the Elderly-Screening version (HHIE-S) and Schow and Nerbonne (1982) introduced the Self-Assessment of Communication (SAC). Unfortunately, these instruments measure the perceived disability and it may be assumed that they have difficulty convincing people that they have a hearing impairment. A functional test might have a stronger impact and is independent from subjective interpretation or age effects. A speech-in-noise test could satisfy the requirements for such a self-test. This thesis will focus on speech-in-noise tests that can be used for screening purposes. The starting point is the clinical speech-in-noise test as developed by Plomp and Mimpen (1979).
A speech-in-noise test for screening purposes
Plomp and Mimpen (1979) developed a test to measure the speech reception threshold in noise (SRTn). The test consists of lists of 13 meaningful sentences. Noise with the long term
average speech spectrum is used as masker. The simple adaptive up-down procedure with a step size of 2 dB is used, which means that after repeating a sentence incorrect the signal-to-noise ratio of the next sentence is increased by 2 dB. After repeating a sentence correct the signal-to-noise ratio of the next sentence is decreased by 2 dB. The SRTn is calculated by taking the
average signal-to-noise ratio of the last 10 presentations omitting the first four presentations. In doing so, the average signal-to-noise ratio, represented by the SRTn, aims at the point of 50%
intelligibility.
Plomp (1986) developed a model that is capable of describing SRTn data for normal hearing
subjects and hearing impaired subjects very well. The model only contains two parameters to account for hearing loss. These two parameters describe the hearing loss for speech in quiet and the hearing loss for speech in noise. Hawkins and Stevens (1950) showed that at higher noise levels the threshold of speech in a background of white noise increases at the same rate as the noise level. This finding was generalized for normal hearing listeners and hearing impaired listeners by Plomp in his model. It means that the SRTn of a listener does not depend on
absolute presentation level but only on the ratio between speech and noise. This makes a speech-in-noise test suitable for screening purposes, even by telephone, because no exact control over presentation level is necessary.
However, it must be realized that only a small band of speech (300-3400 Hz) is transmitted by telephone. Consequently, the signal-to-noise ratio necessary to understand 50% of the speech will be higher. Egan and Wiener (1946) already investigated the relation between intelligibility of speech-in-noise for different band-pass systems. They found that for constant noise levels the gain for the speech signal to give the same speech intelligibility increases with decreasing band
11 width. Thus, SRTns measured by telephone will be systematically higher than SRTns measured
in broadband conditions.
These considerations suggest that it should be possible to perform reliable speech-in-noise measurements by telephone. The use of sentences as speech material is not possible for an automatic self-test because of difficulty in judging the response. Therefore, it was decided to use digits as speech material.
Digit speech material
The use of digits as speech material for testing speech intelligibility in quiet or noise has a long history. In the 1920s the Western Electric No. 4A speech audiometer that used numbers recorded on a disc, was used to test hearing acuity (Fletcher, 1995). Miller et al. (1951) used digits as speech material in a classic study in which they explored the influence of context on the intelligibility of speech. Rudmin (1987) concluded that digits are viable SRT testing material for Canadian non-native speakers of English. Ramkissoon et al. (2002) used digit pairs to measure SRT´s for native and native speakers of English. They conclude that for non-native speakers of English digit pairs are more accurate than a standard word test to determine the hearing threshold for speech. Digit speech material is available in Denmark (Elberling et al., 1989) and has been used in Norway (Quist-Hanssen et al., 1979). Recently, Wilson and colleagues (Wilson & Weakley, 2004) investigated the applicability of digit triplets and digit pairs for intelligibility experiments in multitalker babble. Digits have been used for dichotic test material also.
Validity and reliability of speech-in-noise test
Simply, the purpose of a speech-in-noise test is to measure a person’s (dis)ability to understand speech in noise. According to the definition of the World Health Organization (WHO, 1980) disability is any restriction or lack (resulting from an impairment) of ability to perform an activity in the manner or within the range considered normal for a human being. In the new international classification of functioning, disability and health (ICF, 2001) by the WHO a disability to understand speech in noise would be characterized as an activity limitation. Because there exist numerous different noise environments and different types of speech, it can not be assumed that the ability to understand speech in all situations can be measured correctly by a single test. For instance, the ability to understand single digits in a background of continuous noise is probably not the same as the ability to understand complex speech in competing babble noise. Happily, there is a strong relationship between test results on different speech-in-noise tests. Therefore, in general, normal hearing subjects perform well on different speech-in-noise tests and hearing impaired listeners show a poor performance. This makes a speech-in-noise test applicable for screening purposes. However, it should be noted that every speech-in-noise test just measures the ability to understand that specific type of speech in that specific type of noise and is not necessarily a valid universal tool to measure the disability to understand speech-in-noise in general.
Validity of a speech-in-noise test is important because it is assumed that the test actually assesses the underlying skill it is designed to assess. Maybe even more important is the
12
reliability of the test. The reliability of a test can be described in terms of accuracy and precision. In the context of speech-in-noise tests that aims at measuring the signal-to-noise ratio corresponding to 50% intelligibility (SRTn), accuracy relates to the difference between the
true SRTn and the SRTn that would be found after averaging an infinite number of
measurements. The difference is called bias. Often the occurrence of bias is ignored. Precision reflects the random measurement error, often described as the standard deviation of estimates, that can be calculated from test-retest differences.
Types of speech-in-noise tests
The description of psychophysical speech-on-noise tests in literature is in general rather ambiguous. No precise and universal definitions are used. For instance the terms ´procedure´ and ´method´ are often used interchangeable. Here, no attempt is made to define the different terms but an overview is given of the important properties of a speech-in-noise test. These properties all together specify the test and they have effect on the accuracy and precision of the test.
Speech material
It has been demonstrated that the intelligibility of speech (i.e. the proportion understood correctly) increases with decreasing set size (Miller et al, 1951). Also, the intelligibility of words in a meaningful sentence increases due to context effects (Bronkhorst et al., 1993). Differences in articulation and speaker effect the intelligibility of speech as well (Versfeld et al., 2000). Noise
Both spectral and temporal properties of the masking noise have an effect on the intelligibility of the speech. Artificial noises, e.g. white noise, pink noise or stationary noise with the long term average speech spectrum (LTASS) can be used. These noises can be altered to create prominent temporal properties, e.g. interrupted noise, or speech-like temporal properties (Festen and Plomp, 1990, Bacon et al., 1998; Eisenberg et al., 1995). Also a speech masker consisting of a single speaker or multiple speakers can be used as noise. Sometimes the masking speech is presented as reversed speech.
Measurement procedure
The measurement procedure describes how the different stimuli in a single measurement are presented, and the number of presentations or stopping criterion. The measurement procedure can be adaptive or fixed levels can be used. Different adaptive procedures are proposed, e.g. the simple up-down adaptive procedure (Plomp and Mimpen, 1979), adaptive procedures with decreasing step-size (Brand & Kollmeier, 2002) or a maximum likelihood procedure (Zera, 2004).
Calculation method
The calculation method describes how the result of the test is calculated. Often the calculation method is related to the measurement procedure. Among the calculation methods that are in
13 use are: averaging presentation levels in an adaptive measurement procedure (e.g. Plomp and Mimpen, 1979), maximum likelihood method (Brand & Kollmeier, 2002) and Spearman-Kärber equation (Wilson & Weakley, 2004)
Outline of this thesis
In chapter 2 the approach taken by Plomp and Mimpen (1979) for developing their
speech-in-noise test is largely followed to develop a new speech-in-speech-in-noise test with digit triplets as speech material. The test runs on a PC with modem and soundcard, and can be done by telephone. The test is validated by comparing this new test with the existing sentence speech-in-noise test by Plomp and Mimpen.
Chapter 3 describes the implementation of the test on a telephone platform, which makes it
accessible for multiple users. Results from the first four months after the test has been introduced nationwide as the National Hearing test, are analysed.
In chapter 4 results from the National Hearing test are used to explore several properties of the speech material. The measurement procedure is investigated by using a calculation model. The results of the detailed analysis of the data of the National Hearing test is used together with the calculation model to optimise the speech material. An experimental verification of the predicted increase in precision is presented.
In chapter 5 the implementation of the National Hearing test by internet is described. Results from the test by internet are compared with results from the test by telephone. Also the effectiveness of the National Hearing test and the experiences of participants were investigated by questionnaires.
Chapter 6 describes the development of different speech-in-noise tests with single digits as
speech material. Each test uses a different type of noise. It is investigated whether interrupted noise leads to a more efficient test. An increase in difference between normal hearing listeners and hearing impaired listeners is expected, however the effect on precision is equally important.
Chapter 7 presents a population study in which the SRTn as a function of age in the general
Dutch population is investigated. Also the self-reported hearing disability is described, and compared to the results from the SRTn test.
The final chapter (chapter 8) summarizes and discusses the most import results. REFERENCES
Bacon, S. P., Opie, J. M. & Montoya, D. Y. 1998. The effects of hearing loss and noise masking on the masking release for speech in temporally complex backgrounds. J Speech Lang. Hear. Res., 41, 549-563.
Brand, T. & Kollmeier, B. 2002. Efficient adaptive procedures for threshold and concurrent slope estimates for psychophysics and speech intelligibility tests. J Acous. Soc Am, 111, 2801-2810.
Bronkhorst, A.W., Bosman, A.J. & Smoorenburg, G.F. 1993. A model for context effects in speech recognition. J Acous. Soc Am, 93, 499-509.
Chorus A.M.J., Kremer, A., Oortwijn, W.J. & Schaapveld, K. 1995. Slechthorendheid in Nederland, TNO-rapport 95-076, Leiden.
14
Davis, A. 1997. Epidemiology. In D. Stephens (Ed.), Scott-Brown´s Otolaryngology. Vol. 2, Adult Audiology (pp. 2/3/1-2/3/38). Oxford: Butterworths.
Duijvestijn, J.A., Anteunis, L.J., Hendriks, J.J.T. & Manni, J. 1999. Definition of hearing impairment and its effect on prevalence figures. Acta Otolaryngol, 119, 420-423.
Egan, J.P. & Wiener, F.M. 1946. On the intelligibility of bands of speech in noise. J Acoust Soc Am, 18, 435-441. Eisenberg, L. S., Dirks, D. D. & Bell, T.S. 1995. Speech recognition in amplitude-modulated noise of listeners with
normal and listeners with impaired hearing. J Speech Hear. Res., 38, 222-233.
Elberling, C., Ludvigsen, C. & Lyregaard, P.E. 1989. Dantale: a new Danish speech material. Scand Audiol, 18, 169– 175.
Festen, J.M. & Plomp, R. 1990. Effects of fluctuating noise and interfering speech on the speech-reception threshold for impaired and normal hearing. J Acoust Soc Am, 88, 1725–1736.
Fletcher, H. 1995. Speech and Hearing in Communication. Springer-Verlag, New York.
Gordon-Salant, S., Lantz, J. & Fitzgibbons, P. 1994. Age effects on measures of hearing disability. Ear Hear, 15, 262-265.
Gussekloo, J., de Bont, L.E.A., von Faber, M., Eekhof, J.A.H., de Laat, J.A.P.M., Hulshof, J.H., van Dongen, E. & Westendorp, R.G. 2003. Auditory rehabilitation of older people from the general population - the Leiden 85-plus study. Br J Gen Pract, 53, 536-540.
Hawkins, J.E. & Stevens, S.S.1950. The masking of pure tones and of speech by white noise. J Acoust Soc Am, 22, 6-13.
Jerger J., Chmiel, R., Wilson, N. & Luchi, R. 1995. Hearing impairment in older adults: new concepts. J Am Geriatr Soc, 43, 928-935.
Plomp, R. & Mimpen, A.M. 1979. Improving the reliability of testing the speech reception threshold for sentences. Audiology, 18, 43–52.
Plomp, R. 1986. A signal-to-noise ratio model for the speech-reception threshold of the hearing impaired. J Speech Hear Res, 29, 146–154.
Popelka, M.M., Cruickshanks, K.J., Wiley, T.L., Tweed, T.S., Klein, B.E.K. & Klein, R. 1998. Low prevalence of hearing aid use among older adults with hearing loss: the epidemiology of hearing loss study. J Am Geriatr Soc, 46, 1075-1078.
Quist-Hanssen, S.V., Thorud, E. & Aasand, G. 1979. Noise-induced hearing loss and the comprehension of speech in noise. Acta Otolaryngol Suppl. 360, 90-95.
Ramkissoon, I., Proctor, A., Lansing, C.R. & Bilger, R.C. 2002. Digit speech recognition thresholds (SRT) for non-native speakers of English. Am J Audiol. 11, 23-28.
Rudmin, F. 1987. Speech reception thresholds for digits. J Audiol Res, 27, 15–21.
RGO, Raad voor gezondheidsonderzoek. 2003. Advies gehooronderzoek, Gehoor voor het gehoor. Den Haag. Schow, R.L. & Nerbonne, M.A. 1982. Communication screening profile: use with elderly clients. Ear Hear, 3,
135-147.
Ventry, I.M., Weinstein, B.E. 1983. Identification of elderly people with hearing problems. ASHA, 25, 37-42. Versfeld, N.J., Daalder, L., Festen, J.M. & Houtgast, T. 2000. Method for the selection of sentence materials for
efficient measurement of the speech reception threshold. J Acoust Soc Am, 107, 1671–1684.
Wiley, T.L., Cruickshanks, K.J., Nondahl, D.M. & Tweed, T.S. 2000. Self-reported hearing handicap and audiometric measures in older adults. J Am Acad Audiol, 11, 67-75.
Wilson, R.H. & Weakley, D.G. 2004. The use of digit triplets to evaluate word recognition abilities in multitalker babble. Seminars Hearing, 25, 93-111.
Miller, G.A., Heise, G.A. & Lichten, W. 1951. The intelligibility of speech as a function of the context of the test material. J Exp Psychol, 41, 329–335.
Chapter
2
Development and validation of an automatic
speech-in-noise screening test by telephone
Cas Smits, Theo S. Kapteyn & Tammo Houtgast International Journal of Audiology 2004; 43:15-28
To meet the need for an objective self-test for hearing screening, a new Dutch speech-in-noise test was developed. Digit triplets were used as speech material. The test was made fully automatic, was controlled by a computer, and can be done by telephone. It measures the speech reception threshold (triplet SRTn)
using an adaptive procedure, in about 3 min. Our experiments showed no significant influence of telephone type or listening environment. Measurement errors were within 1 dB, which makes the test accurate. In additional experiments with hearing-impaired subjects (76 ears of 38 listeners), the new test was compared to the existing sentence SRTn test of Plomp and Mimpen, which is considered to be the
standard. The correlation between both SRTns was 0.866. As expected, correlations between the triplet
SRTn test by telephone and average pure-tone thresholds are somewhat lower: 0.732 for PTA0.5, 1, 2, and
0.770 for PTA0.5, 1, 2, 4. When proper SRTn values were chosen for distinguishing between normal-hearing
and hearing-impaired subjects, the triplet SRTn test was found to have a sensitivity of 0.91 and a
17 I. INTRODUCTION
It is well known that hearing loss has a high incidence, increasing with age. However, many hearing-impaired people still do not seek medical help for their handicap. Probably, one reason for this is the fact that only subjective ratings for their hearing abilities are available. To get an objective measurement, a visit to a specialist is inevitable, which is a big step for many people. Therefore, there is a need for an objective hearing test for screening purposes that can be done easily in a home situation, preferably without needing an instructor.
The difficulty in understanding speech in noise is considered by many people to be the greatest handicap associated with their hearing impairment (Kramer et al, 1998). Therefore, a test for measuring this ability would be perfect for the described aim. Several investigators have shown that pure-tone audiometry and speech audiometry (in quiet) are not very good predictors of this ability (Smoorenburg, 1992; Bosman & Smoorenburg, 1995). Different tests were developed for measuring speech intelligibility in noise, using sentences as speech material and using fixed signal-to-noise levels or an adaptive procedure (Plomp & Mimpen, 1979a; Kollmeier & Wesselkamp, 1997; Nilsson et al, 1994; Hagerman, 1982). The use of sentences instead of words as speech material has the advantage that it is closer to everyday situations. For the Dutch language, the test developed by Plomp & Mimpen (1979a) is used for clinical purposes as well as for assessing the effects of a diversity of parameters on speech reception (e.g. Noordhoek et al, 2001; Duquesnoy, 1983). A CD with the sentences and noise is available. The ability to understand speech in noise is generally presented as the speech reception threshold (SRTn), which is defined as the signal-to-noise ratio necessary for a person to
recognize 50% of the speech material correctly.
This article describes the development of an SRTn test in which digit triplets (e.g. 6–2–8) were
used as speech material. The use of digits in speech intelligibility measurements has been described earlier. Miller et al (1951) used digits to explore the effect of context on speech intelligibility in noise. Rudmin (1987) used digits for SRT measurements (in quiet) with a non-native English-speaking population, because SRT testing using words may be difficult or invalid with this population. Digit triplets form part of the speech material on the CD used for speech audiometry in Denmark (Elberling et al, 1989).
For the test described here, it was decided to use digit triplets, for several reasons. First, digits are among the most frequent words and therefore very familiar. Second, in contrast to a sentence SRTn test, the test can be repeated, because the risk that people will remember which
triplets are used is very low. Third, the use of digits made it possible to make the test fully automatic: a telephone can be used to connect to a computer, which presents the test and judges the responses (which can be given by pressing the keys on the telephone pad). Finally, it was decided to use triplets because this would give more accurate results than using single digits.
The goal of the present project was to develop an SRTn test that can be done by telephone. The
test should be easy, quick and suitable for screening purposes (high sensitivity and specificity). Because it was intended to develop a test that measures the ability to understand speech in
18
noise, the SRTns measured with the new test and SRTns measured with the standard Dutch
speech-in-noise test (Plomp & Mimpen, 1979a) should be strongly correlated.
In the first section of this paper, the selection, recording and processing of the speech material is described. Also, the measurement procedure and test setup are described. In the second section, evaluation of the test with normal-hearing listeners is described. Important questions about the influence of telephone use and magnitude of measurement errors are investigated. Finally, in the third section, a comparison is reported of the new test with average pure-tone thresholds and with the existing test of Plomp & Mimpen (1979a) by measurements with subjects with different hearing losses.
II. DEVELOPMENT OF SPEECH MATERIAL Introduction
The preparation of the speech material consisted of several steps. Because it should be possible to do the test by telephone and to use a computer for judging the responses, it was chosen to use digit triplets instead of sentences as speech material. Important for a reliable test are equal intelligibility of the triplets and steep discrimination functions. First, some technical details of the test are described, and then the preparation and selection of the triplets is presented.
Apparatus
Sound files were stored on a computer hard disk and played by use of a sound card (Creative labs, Soundblaster 16 value PnP). The signals were routed from the output of the sound card to a modem (E-tech, PC336RVP). The modem was modified to make it possible to play files by use of the sound card and couple the output directly to the telephone line. The modem software used was Voiceguide V2.9 (Katalina Technologies). This software is used for telephone handling: answering the telephone, and detecting the keys pressed by the listener on its telephone pad (i.e. response to the triplets heard). The program for mixing speech and noise, playing sound files, calculating levels and SRTns, judging responses, randomly choosing
triplets and controlling the Voiceguide program was made in Delphi (Borland Software). The program is fully automatic: a subject dials the telephone number and is connected to the computer. If needed, introductory text is presented. Then, digits in background noise are presented. The subject enters his response on the telephone pad, and the computer compares the entered triplet with the presented triplet. Depending on the response, the signal-to-noise level of the next presentation is calculated. After the last presentation, the SRTn is calculated,
and the modem disconnects and waits for the next call (if desired, the computer can return the SRTn or present text to the subject before disconnecting). All presented digits and responses are
stored on hard disk.
Adaptive test procedure
The same (adaptive) testing procedure as described by Plomp & Mimpen (1979a) is used. The only difference is that, for better accuracy, 10 extra presentations are used, resulting in 23
19 presentations per SRTn measurement. In the test, the noise level is fixed and the speech level
varies. The triplet is judged to be correct only when all digits are entered correctly.
1. The first triplet is presented repeatedly, increasing the speech level (step size 4 dB) until the triplet is entered correctly.
2. The speech level is decreased by 2 dB, and the second triplet is presented.
3. Based on the subject’s response, the subsequent triplets are presented at a 2-dB higher level (incorrect response) or a 2-dB lower level (correct response).
4. The SRTn is calculated as the average signal-to-noise ratio of triplets 5–24. The last triplet
is not actually presented, but its level is calculated from the response to triplet 23.
Initial selection of speech material
To form a homogeneous group, it was decided to use only monosyllables. In Dutch, the digits 7 and 9 are two-syllable digits, so they were excluded. The digits left were: 0, 1, 2, 3, 4, 5, 6, and 8. To reduce the chance of the subject guessing the correct response, and to make accurate measurements possible, it was decided to use digit triplets. It is well known that increasing the number of independent items increases the measurement efficiency (Versfeld et al, 2000). However, using more than three digits would probably make demands on cognitive abilities (memory). Five lists were created, each containing 23 different triplets (total of 115 triplets). In order to create balanced lists, within every list triplets were chosen in such a way as to provide an almost equal distribution of different digits over the possible positions in the triplets.
Recording and processing of the speech material
All triplets were pronounced by a female speaker in a soundproof booth and recorded on a DAT recorder. The digits were pronounced separately, with natural pauses between digits: for example, 2–1–6 was spoken as two–one–six (not as two hundred (and) sixty-one). Triplets were digitized (22 050 Hz) and saved on hard disk as different files. It was noticed that, in general, the last digit was pronounced more softly than the first one. This is often observed when listening to sentences: the level decreases as the sentence proceeds (Versfeld et al, 2000). To correct for this and equalize the intelligibility of separate digits, amplitude was increased linearly with time from 0 dB to 6 dB for every triplet (note: the silence that preceded and followed the digits was included; therefore, the last digit was increased by about 3.5 dB relative to the first digit). This process had no (subjective) effect on the quality of speech. Finally, speech noise was shaped to match the long-term average speech spectrum. The standard deviation of differences between the speech spectrum and noise spectrum, calculated in third-octave bands from 80 Hz to 10 000 Hz, was 2.8 dB.
Selection and equalization of speech material
Eighty normal-hearing subjects participated in a listening experiment. The subjects used a telephone (at home) to connect to the measurement PC. Then, depending on how much time
20
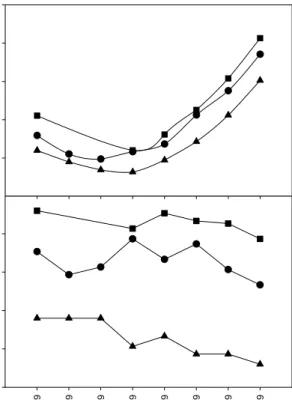
RMS level (dB re:average triplet level)
-4 -2 0 2 4 6 8
first digit second digit third digit
triplet
Figure 1. Average RMS levels ±1 standard deviation of triplets and first, second and third digits, relative to the average RMS level of triplets. The calculated RMS level of triplets includes natural pauses.
they wanted to spend, between one and five lists were presented adaptively. The order of the triplets in each list was randomized for every subject. The noise level in this experiment was fixed at 62 dBA, measured with one telephone. Small absolute-level differences between different telephones will undoubtedly exist. In total, 285 lists were presented. For every triplet presented, the signal-to-noise ratio for that presentation was corrected for interindividual differences by adding the difference between the SRTn (calculated by averaging the 20
signal-to-noise levels) for that individual and the average SRTn for all individuals. Because every
triplet was presented at various different signal-to-noise ratios during the adaptive procedure, and because it is known whether the response at that level was correct or incorrect, a psychometric function could be fitted to the data for each triplet (on average, about 50 data points per triplet). The function used was a logistic function, and is given by
) 4 ) SRT SNR ( exp( 1 1 ) SNR ( n s P ⋅ − − + = (1)
where SNR = signal-to-noise ratio, SRTn = speech-reception-thresholds, i.e. signal-to-noise
ratio corresponding to 50% intelligibility, and s = slope of the psychometric function at 50% intelligibility.
Only triplets with steep slopes (s ≥ 9%/dB) and SRTns between –2 dB and –12 dB were
selected for the final set of triplets. This yielded 80 triplets (thus, 35 triplets were excluded), with an average SRTn of –7 dB. Equal intelligibility (50% at –7 dB) for every triplet was
achieved by applying a level correction to the triplets.
Average triplet RMS levels, and average RMS levels of the first, second and third digits, were calculated over the full digitization range and are shown relative to the average triplet RMS
21 level in Figure 1. The RMS level of the triplets includes short periods of silence before, between and after the digits.
Testing procedure
For the final test, no fixed lists were used. At the beginning of a test, 23 different triplets were chosen randomly from the 80 available triplets. Thus every test was different, and subjects could repeat the test without being able to remember the order of triplets. Presentation levels were varied adaptively, as described earlier. To make the test suitable for hearing-impaired subjects, the noise level was increased and fixed at 73 dBA (measured through a telephone at the Audiology Department).
III. EVALUATION OF THE SRTN TEST IN NORMAL-HEARING LISTENERS
Introduction
One aim of the study was to develop a test that could be done fully automatically by using an arbitrary telephone. An important question arises about the influence of different telephones and listening environments on the measured triplet SRTns. Therefore, the next step was to
compare SRTn measurements in normal-hearing listeners when they use their own telephone at
home and a standard telephone in a standardized listening environment. To gain insight into the influence of using the telephone instead of headphones, SRTn measurements with
headphones (full bandwidth) were also included. Finally, the purpose of part of this study was to estimate measurement errors and a possible learning effect.
Methods Subjects
Ten normal-hearing subjects (five males and five females) participated in this experiment. A pure-tone audiogram was recorded at the octave frequencies of 250–8000 Hz, using a Madsen OB 822 clinical audiometer and TDH-39 headphones. All subjects had pure-tone thresholds not exceeding 15 dB HL (International Standards Organization, 1998) at any frequency. Subjects were members of the Audiology or Ear, Nose and Throat (ENT) Departments. Therefore, some of them had experience with performing speech-in-noise measurements. Procedure
For all 10 subjects, triplet SRTns were measured in three conditions in fixed order:
1. Using headphones (Sony MDR-V900) directly connected to the sound card of the computer.
2. Using a telephone at the Audiology Department (ptt telecom, Palermo plus AT). 3. Using their own telephone at home.
There were no restrictions on the telephone that subjects wanted to use at home, except that no mobile phones that use the GSM network were allowed.
22
The measurement procedure was adaptive, as described in ‘Development of speech material’, and involved the use of 23 triplets per measurement. The first combination was presented at signal-to-noise ratios of –6 dB for the conditions with the telephone and –10 dB for the condition with the headphones. Noise levels were fixed at 73 dBA (of course, this could not be checked for the condition at home). In the conditions at the Audiology Department (telephone and headphone), both ears were measured twice: left–right–left–right or right–left–right–left. In the home condition (telephone), every ear was measured only once. Five people started with the left ear, and five with the right ear. In every person, the order was fixed for the three different measurement conditions.
The subjects had to enter the response on the telephone or the computer keyboard. In conditions 1 and 2, the tests were done in a quiet, non-sound-treated, room. Subjects were asked to also do the test at home in a quiet room where they would not be disturbed during the test.
Results
Speech reception thresholds for the normal-hearing subjects in the three conditions are given in Table I. As indicated before, the triplet SRTns are calculated as the average of 20 triplets per
ear. To look for significant differences between the measurements done at home and at the Audiology Department, both using the telephone, a paired t-test was performed. No significant difference (p > 0.4) was found between the two conditions (measurements from both ears pooled, n = 20). An important issue is the question of whether a learning effect occurs. When looking at Table I, it can be seen that differences exist between first–third and second–fourth measurements in the conditions where both ears were tested twice. The impression arises that these differences are due to a learning effect. This is explored in more detail by splitting every individual SRTn measurement into two: the 20 used triplets are split, and the SRTn is
calculated for each series of 10 triplets.
Table I. Results from triplets SRTn measurements by telephone and headphones. Average data from
ten normal hearing subjects. Also given is de slope of the psychometric function fitted to the data. Measurement number SRTn (sd) in dB Average SRTn (sd) in dB Slope (%/dB) telephone at the department
own telephone at home
headphones 1 2 3 4 1 2 1 2 3 4 -6.6 (1.2) -6.7 (1.7) -7.4 (1.5) -7.9 (1.3) -7.1 (1.4) -6.7 (1.6) -11.0 (1.4) -10.7 (1.4) -11.7 (1.0) -11.4 (1.3) -7.1 (1.5) -6.9 (1.5) -11.2 (1.3) 20 20 16
23 It is now possible to compare two successive SRTn measurements done in the same ear. No
learning effect is observed (Wilcoxon signed ranks test). Both calculated triplet SRTns (based
on 10 presentations each) can be handled as repeated measurements, and the standard deviation of differences in repeated measurements can be calculated. These values are 1.0, 1.1 and 1.3 dB for, respectively, the following conditions: controlled condition at the department (always same telephone), telephone at home, and headphone condition. Because the standard triplet SRTn test, as developed, uses 20 triplets for the SRTn calculation, the standard
deviations of repeated measurements should be a factor 2 smaller, and equal 0.7, 0.8 and 0.9 dB respectively. These values can be compared to the standard deviation of 0.9 for sentence SRTn measurements as found by Plomp & Mimpen (1979a). Another measure of the accuracy
of the test is the slope of the psychometric function. To calculate an estimate of the overall psychometric function, the following procedure was used. For every single SRTn measurement,
a correction to the signal-to-noise ratios of the presented triplets was made in order to correct for interindividual differences in SRTn. Then the percentages of correct triplets at levels of 1, 2,
3 dB etc. below or above average were calculated. The results are shown in Figure 2. The curve for the condition in which subjects used their own telephone at home is based on 380 responses. The two other curves are based on 760 responses. All curves are fitted with a logistic function. The slopes of these functions at 50% intelligibility are shown in Table I. Festen & Plomp (1990) used the sentence material from Plomp & Mimpen (1979a) to measure SRTns
and fitted their data with the same logistic function used here. They found very comparable slopes of 21%/dB and 20%/dB for normal-hearing and hearing-impaired listeners, respectively. Discussion and conclusions
The measured average triplet SRTn for normal-hearing subjects using headphones is –11.2 dB.
Average SRTns for normal-hearing subjects measured with the standard Dutch speech-in-noise
test (Plomp & Mimpen, 1979a) range between –4.5 dB and –5.8 dB, as shown in Figure 3.
speech-to-noise ratio (dB) -18 -16 -14 -12 -10 -8 -6 -4 -2 0 P e rc ent age of t ri p le ts c o rr ec t 0 20 40 60 80 100 At home, by telephone At the department, by headphones At the department, by telephone
Figure 2. Estimated psychometric curves for triplets in noise presented by telephone at home, telephone at the department, and headphones.
24
speech-to-noise ratio (dB)
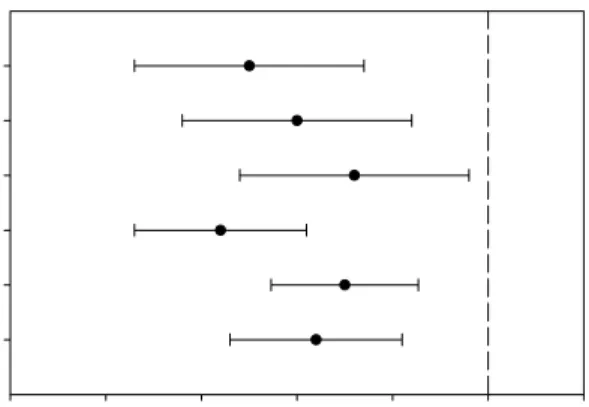
-8 -7 -6 -5 -4 -3 -2 Plomp and Mimpen (1979b)
Duquesnoy (1983) Festen and Plomp (1990) Versfeld et al. (2000) Noordhoek et al. (2001) Bosman and Smoorenburg (1995)
Figure 3. Normal values ±1 standard deviation of the sentence SRTns by headphones as found in the
literature.
The most important reason for the low SRTn value in the new test is probably the fact that a
closed set of speech material is used, which improves the speech recognition scores (Miller et al, 1951).
The measured triplet SRTns by headphones are, as expected, better than the triplet SRTns by
telephone. A more than 4 dB better SRTn for the headphone condition (Table I) means that a
lot of speech information is lost when using a telephone. Partly, this could be due to the inferior quality of the transducer in the telephone compared to the headphone, but most of the loss of speech information takes place during transmission of the signal through the telephone network. Without doing a quantitative analysis, the main factors are given. The most important factor is the limited bandwidth of the telephone network (300–3400 Hz). As known from, for example, the speech intelligibility index model (American National Standards Institute, 1997), most of the speech information lies within this band but, depending on speaker and speech level, a significant part of the speech information lies outside this frequency band. A second factor is the (frequency-dependent) transmission loss. Because a signal-to-noise ratio is measured and not an absolute level, some transmission loss does not have an effect on the measured SRTn. Frequency dependence also occurs for group delay distortion, which can
have negative influence on speech intelligibility. Finally, some sources of noise can be distinguished: noise that comes from within the telephone network, crosstalk from other telephone calls, and noise due to induction signals from other circuits. However, it is very unlikely that those noise levels are of the same order as the noise level used in the test. Therefore, no significant effect is expected from these noise sources.
The test–retest reliability of the test is largely determined by the steepness of the slope of the psychometric function. It is interesting that steeper slopes (and lower measurement errors) are found for triplet SRTn measurements by telephone than for triplet SRTn measurements by
headphone. This is probably due to the selection method used in the development phase(see ‘Development of speech material): with use of the telephone, only the triplets that lead to steep
25 logistic functions were selected for the definitive test. When those triplets are used in headphone conditions (i.e. broadband), the selection criteria are no longer optimal, and less steep slopes are to be expected.
An important question was whether the developed test gives useful results when people do the test in a home situation and use their own telephone. In that situation, the telephone used (transducer), the presentation level and environmental noise level are unknown. It is expected that, under normal circumstances, listeners use telephones that make normal communication possible. In the test, the input level is higher than the normal conversation level, and the unknown variables will probably have little effect. Because no significant differences were found in a paired-comparison test and because the test–retest reliability and slope of the psychometric function were almost the same, the test can be used at home for screening purposes.
It can be concluded that the newly developed triplet SRTn test gives accurate SRTn values when
headphones or the telephone are used. The test–retest reliability is estimated to be better than 1 dB. No significant influence on the measured SRTn value is found when the use of a standard
telephone in a controlled setting is compared with the use of different telephones in a home situation and the national telephone network.
IV. VALIDATION OF THE TRIPLET SRTN TEST
Introduction
Now that an accurate triplet SRTn test is available, the next step was to compare this new test
with an existing (reference) speech-in-noise test. The test of choice was the sentences-in-noise test developed by Plomp & Mimpen (1979a). This test has been used extensively in clinical practice, and is the standard for measuring the ability to understand speech in noise in the Dutch language. Because two main differences between the new test and the reference test exist (numbers versus sentences and telephone versus headphones), a systematic study was done in which all four possible tests were used to measure SRTns in both normal-hearing and
hearing-impaired subjects. Results from measurements with the triplet SRTn by telephone test are also
compared with average pure-tone thresholds of the subjects.
Methods Subjects
In this experiment, both ears from 38 subjects were investigated. Because it was intended to compare different measurement methods, subjects with a wide range of hearing losses were included. The distribution of the tone-audiometric thresholds found for the 76 ears is presented in Figure 4. Twenty-two ears can be considered as normal-hearing ears (using the definition: pure-tone threshold not exceeding 15 dB HL at any frequency from 250 to 8000 Hz). The remaining 54 ears can be considered as hearing-impaired ears. These numbers are only given to provide an impression of the included subjects. No further distinction
26 Frequency (Hz) 250 500 1000 2000 4000 8000 H e ar in g t h re s h ol d ( d B H L ) -10 0 10 20 30 40 50 60 70 80 90 100 10% 25% 50% 75% 90%
Figure 4. Distribution of pure-tone thresholds. The percentage indicated represents the fraction of ears at a certain frequency with better tone thresholds than the plotted value.
between these different groups is made in the experiments or data analysis. For screening purposes, this criterion is far too stringent, and a classification on the basis of SRTns will be
used. The hearing-impaired subjects were all patients from the Audiology Department. Subjects with very poor speech understanding were excluded, because adaptive speech-in-noise measurements cannot be done in these severely hearing-impaired people. The total group of 76 ears included two ears with pure conductive loss and seven ears with mixed hearing loss. The remaining 67 ears consisted of normal-hearing ears or ears with perceptive hearing loss. All subjects were unfamiliar with speech-in-noise testing.
Test material
The ability to understand speech in noise is usually measured by a speech-in-noise test using Dutch sentences. This test was originally developed by Plomp & Mimpen (1979a), and is available on CD. The output from the CD player is delivered to headphones (TDH-39) via an audiometer (Madsen OB 822), in which mixing of the speech and noise signal takes place. The SRTn obtained with this test (sentence SRTn by headphones) is used as a reference value. To be
able to investigate the influence of using the telephone instead of headphones on the SRTn,
some modifications of the test described above were made to develop a new test. The original sentences and noise were taken from CD, stored on a hard disk, and down-sampled to 22 050 Hz in order to create the same sample rate as for the triplet SRTn test. The original
software developed for that test was modified in such a way that the sentence SRTn test could
be done by telephone. This new test follows exactly the standard procedure (Plomp & Mimpen, 1979a), with the exception that the telephone (via sound card and modem) is used and that mixing is done by a computer. The two other tests used in this section (triplet SRTn
27 the SRTn test in normal-hearing listeners’. One was done by using headphones and the other
by using the telephone, both at the Audiology Department.
Procedure
Because the hearing-impaired subjects were all patients from the Audiology Department, pure-tone audiometry (air and bone conduction thresholds) and speech audiometry (monosyllables) results were already available. For the normal-hearing subjects, a pure-tone audiogram was recorded.
For each subject, the following tests, using one list of 13 sentences or 23 triplets per test, were performed in the same order:
1. triplet SRTn test by telephone
2. sentence SRTn test by telephone
3. triplet SRTn test by headphones
4. sentence SRTn test by headphones.
Noise levels were 73 dBA. Every subject started each test with the ear that was normally used for telephoning. After that, the same test was done with the second ear, and the procedure was continued with the next test. Total test time (without pure-tone and speech audiometry) was 30–45 min.
Results
Some caution should be exercised when performing correlation and regression analysis on measured SRTns. Depending on hearing loss, a sufficiently high noise level is necessary for
reliable measurements of the ability to understand speech in noise. This can easily be understood by looking at the model proposed by Plomp (1986). In the Appendix, this model is used to select measured SRTns for the analysis. Only four SRTns were excluded from
correlation and regression analysis on SRTns. When SRTns are compared with pure-tone
thresholds, fundamental differences arise between, on the one hand, conductive and mixed hearing losses, and, on the other, perceptive hearing losses . Therefore, in those cases, only ears with pure perceptive losses were considered (excluding seven more ears).
Table II. Correlation matrix for values of the SRTn, measured with four different SRTn tests, and
average pure-tone thresholds. All correlations are significant at the 0.001 level.
Sentences headphones Triplets headphones Sentences telephone Triplets
telephone PTA 0.5,1,2 PTA 0.5,1,2,4 Sentences headphones Triplets headphones Sentences telephone Triplets telephone PTA 0.5,1,2 PTA 0.5,1,2,4 * 0.849 0.746 0.866 0.718 0.770 * 0.726 0.836 0.771 0.821 * 0.749 0.615 0.642 * 0.732 0.770 * 0.986 *
28
Correlation between test results
In Table II, the correlation coefficients for the SRTns obtained with the different tests are
given. Correlation coefficients between the average pure-tone thresholds at 0.5, 1 and 2 kHz (PTA0.5, 1, 2), and at 0.5, 1, 2 and 4 kHz (PTA0.5, 1, 2, 4) and SRTns are also given. For the reasons
given above, four or 11 ears were excluded from the calculations. Correlations between SRTns
are between 0.726 and 0.866. The highest correlation is found between the sentence SRTn by
headphones (i.e. clinical speech-in-noise test) and triplet SRTn by telephone (i.e. newly
developed test).
Relationships between SRTns
To explore the relationships between the used tests, linear regression was performed. An assumption that is implicit in normal linear regression models is that the X-values are measured without error. When this assumption is not met, as in many comparison studies, normal linear regression is inappropriate for determining the (linear) relationship between both variables. In many cases, interchanging the X and Y variables yields different values for slope and intercept of the regression line. The problem can be solved by using a technique generally known as Deming’s regression. A necessary condition for using this technique is that the ratio, λ, between the squares of the measurement error in the X and Y variables, respectively σx and σy,
is known. Good estimates for the measurement errors for the triplet SRTn test by telephone
and triplet SRTn test by headphones are 0.7 and 0.9 dB, respectively (‘Evaluation of the SRTn
test in normal-hearing listeners’). For the sentence SRTn test by headphones, a value of 0.9 dB
can be taken (Plomp & Mimpen, 1979a). The measurement error for the sentence SRTn test
by telephone is estimated as 0.9 dB, because it has been verified (from the present data) that the slope of the psychometric curve for the normal-hearing subjects is the same in the conditions with telephone and headphones. Formulae to calculate slope, intercept and 95% confidence intervals (CIs) can be found in some textbooks (e.g. Strike, 1991).
The sentence SRTn by headphones is taken as a reference value (X-value). The three remaining
SRTns, sentence SRTn by telephone, triplet SRTn by headphones, and triplet SRTn by
telephone, are taken as Y-values. Scatterplots and regression lines are shown in Figures 5–7. In Table III, details of the regression lines are given. It should be noted that, for this type of analysis, changing X- and Y-values has no influence on slope and intercept, because the underlying functional relationship is estimated.
29 sentences SRTn by headphones (dB) -10 -8 -6 -4 -2 0 2 4 6 tri p le ts S R T byn headphones (dB ) -14 -12 -10 -8 -6 -4 -2 0 2 r = 0.85
Figure 5. Scatterplot of the triplet SRTns by headphones versus the sentence SRTns by headphones,
together with the regression line (Deming’s regression).
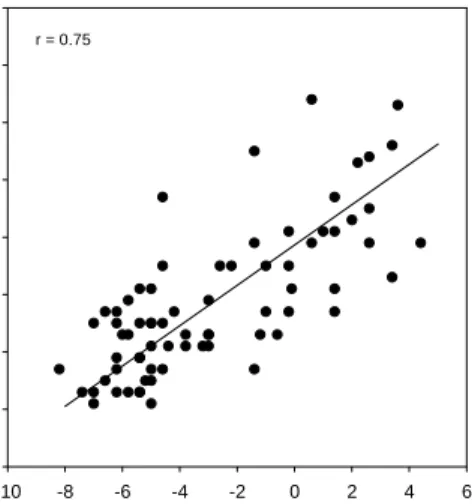
sentences SRTn by headphones (dB) -10 -8 -6 -4 -2 0 2 4 6 s e nt enc es S R T byn t e le phone ( d B ) -6 -4 -2 0 2 4 6 8 10 r = 0.75
Figure 6. Scatterplot of the sentence SRTns by telephone versus the sentence SRTns by headphones,
30 sentences SRTn by headphones (dB) -10 -8 -6 -4 -2 0 2 4 6 tr ip le ts S R T byn t e le phone (dB ) -10 -8 -6 -4 -2 0 2 4 6 r = 0.87
Figure 7. Scatterplot of the triplet SRTns by telephone versus the sentence SRTns by headphones,
together with the regression line.
Table III. Results from regression analysis (Deming´s regression) on SRTns measured with different
SRTn tests compared to sentences SRT by headphones and average pure-tone thresholds.
X-value SRTn, Y-value Slope (95% confidence
interval) Intercept (dB) (95% confidence interval) Sentences headphones Sentences headphones Sentences headphones PTA 0.5,1,2 PTA 0.5,1,2,4 Sentences telephone Triplets headphones Triplets telephone Triplets telephone Triplets telephone 0.70 (0.55 – 0.85) 1.02 (0.87 – 1.17) 0.90 (0.78 – 1.03) 0.13 (0.10 – 0.15) 0.12 (0.09 – 0.14) 1.73 (1.08 – 2.39) -4.48 (-3.82 to -5.14) -1.43 (-0.89 to -1.97) -6.65 (-5.81 to -7.49) -6.87 (-6.07 to -7.66)
Finally, the four ears excluded from correlation and regression analysis on SRTns were
included, and it was investigated how well the newly developed test (triplet SRTn test by
telephone) discriminates between normal-hearing and hearing-impaired subjects. First, a definition of normal hearing was needed. Because the intention was to develop a screening test that measures the ability to understand speech in noise, normal hearing was defined in these terms. The conventional clinical test to measure this ability is the SRTn test by Plomp &
Mimpen (1979a), also used here: sentence SRTn test by headphones. Although the test is very
accurate, the presented mean and spread of SRTns for normal-hearing listeners differ between
papers. In Figure 3, a summary of published data is given. Based on these publications, for normal-hearing subjects, a deviant sentence SRTn by headphones was taken as greater than –
3.0 dB. When an SRTn was measured with a value of –3.0 dB or better, this ear was, by
definition, said to be a normal-hearing ear. For obvious reasons, the definition of normal hearing is less strict for screening purposes than for scientific research purposes. Next, a value
31 for the minimal triplets SRTn by telephone needed to be chosen. This value can be found
straightforwardly by using the regression equation (Table III).
Triplet SRTn by telephone = 0.90 · sentence SRTn by headphones – 1.43 (2)
With use of the value of –3.0 dB for sentence SRTn by headphones, a value of –4.1 dB is
found. Then, the sensitivity (number of subjects correctly identified as hearing impaired/total number of hearing-impaired subjects) and specificity (number of subjects correctly identified as normal hearing/total number of normal-hearing subjects) for the test can be calculated, by using the matrix shown in Table IV, and are 0.91 and 0.93 respectively.
Both the sensitivity and specificity of the triplet SRTn test depend on the value of the SRTn
which is used in the test to distinguish between normal hearing and impaired hearing (cut-off value). These relationships are explored in more detail by calculating the receiver operating characteristic (ROC) curve, shown in Figure 8. The area under the curve is 0.974. The point representing the cut-off value of –4.1 is clearly a good compromise between high sensitivity and high specificity.
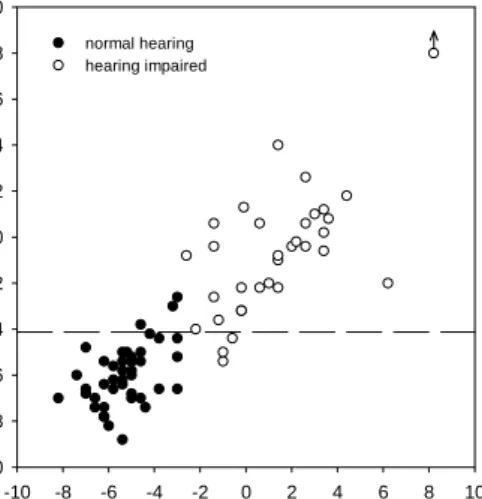
In Figure 9, the scatterplot is shown for triplet SRTn by telephone versus sentence SRTn by
headphones. Normal-hearing and hearing-impaied ears are represented by filled and open circles, respectively. Also shown is a horizontal line at –4.1 dB that is used in the newly developed test for distinguishing between normal hearing and hearing impairment. Owing to the high sensitivity and high specificity of the test, only a few ears are wrongly classified.
Table IV. Matrix showing the number of ears correctly identified with the triplet SRTn test; also
shown are the number of false positives and false negatives. The numbers hold for the chosen cut-off
value of –4.1 dB for the triplet SRTns by telephone.
Sentences SRTn test
Normal hearing Hearing impaired
Pass Normal hearing, correctly identified. 40 ears False positive 3 ears Triplets SRT n test Refer False negative 3 ears Hearing impaired, correctly identified. 30 ears
32
1-specificity (false positive)
0.00 0.25 0.50 0.75 1.00 s e n s itiv ity 0.00 0.25 0.50 0.75 1.00 (0.00,0.76|-2.4 dB) (0.02,0.79|-2.8 dB) (0.05,0.88|-3.7 dB) (0.07,0.91|-4.1 dB) (0.14,0.94|-4.6 dB) (0.23,0.97|-5.1 dB) (0.40,1.00|-5.5 dB)
Figure 8. Receiver operating characteristic (ROC) curve, showing the sensitivity and specificity of
the triplet SRTn test, depending on the cut-off value (i.e. the triplet SRTn value that differentiates
between normal-hearing and hearing-impaired ears). The 1-specificity, sensitivity and cut-off value are given in parentheses. The underlined values represent the values chosen as optimal.
sentences SRTn by headphones (dB) -10 -8 -6 -4 -2 0 2 4 6 8 10 trip le ts S R T byn t e le phone (dB ) -10 -8 -6 -4 -2 0 2 4 6 8 10 normal hearing hearing impaired
Figure 9. Scatterplot of all measured triplet SRTns by telephone versus sentence SRTns by
headphones. Filled circles represent normal-hearing subjects (sentence SRTs by headphones less than
or equal to–3 dB), and open circles represent hearing-impaired subjects (sentence SRTns by
headphones greater than –3 dB). The line at y = –4.1 dB represents the separation between normal-hearing and normal-hearing-impaired ears based on the new test (cut-off value).
33 Relationships between pure-tone thresholds and the triplet SRTns by telephone
Because hearing disability is in general still expressed in pure-tone thresholds, relationships between average pure-tone thresholds (PTA0.5, 1, 2 and PTA0.5, 1, 2, 4) and the triplet SRTn by
telephone were explored. The results of Deming’s regression are shown in Table III. Figures 10 and 11 show scatterplots of triplet SRTns by telephone versus PTA0.5, 1, 2 and PTA0.5, 1, 2, 4
respectively. With the use of appropriate regression equations, the chosen definition of normal hearing (sentence SRTn by headphones less than or equal to –3.0 dB) yields values of PTA0.5, 1, 2
= 20.6 dB and PTA0.5, 1, 2, 4 = 23.5 dB. For the regression lines in both figures, the line
separating normal-hearing from hearing-impaired ears with the triplet SRTn by telephone test
and ears with conductive or mixed losses (open squares) are added. Defining normal hearing by the calculated average pure-tone thresholds, and excluding ears with conductive or mixed hearing loss, gives sensitivities and specificities of 0.75 and 0.91 (PTA0.5, 1, 2) or 0.79 and 1.0
(PTA0.5, 1, 2, 4). PTA0.5,1,2 (dB HL) -10 0 10 20 30 40 50 60 trip le ts SRT n by t e lephone (dB ) -10 -8 -6 -4 -2 0 2 4 6 PTA 0.5,1,2 < 20.6 dB HL conductive or mixed losses PTA 0.5,1,2 > 20.6 dB HL
Figure 10. Scatterplot of all measured triplet SRTns by telephone versus average pure-tone
thresholds at 0.5, 1 and 2 kHz. Filled circles represent subjects with PTA0.5, 1 ,2 ≤ 20.6 dB HL
(corresponding to sentence SRTs by headphones less than or equal to–3 dB). Open squares represent subjects with conductive or mixed hearing losses. The line at y = –4.1 dB represents the separation between normal-hearing and hearing-impaired ears based on the new test. Also shown is the regression line (Deming’s regression).
34 PTA 0.5,1,2,4 (dB HL) -10 0 10 20 30 40 50 60 tr ip le ts SR T byn t e lephone ( d B ) -10 -8 -6 -4 -2 0 2 4 6 PTA 0.5,1,2,4 < 23.5 dB HL PTA 0.5,1,2,4 > 23.5 dB HL conductive or mixed losses
Figure 11. Scatterplot of all measured triplet SRTns by telephone versus average pure-tone
thresholds at 0.5, 1, 2 and 4 kHz. Filled circles represent subjects with PTA0.5, 1, 2, 4 ≤ 23.5 dB HL
(corresponding to sentence SRTs by headphones less than or equal to –3 dB). Open squares represent subjects with conductive or mixed hearing losses. The line at y = –4.1 dB represents the separation between normal-hearing and hearing-impaired ears based on the new test. Also shown is the regression line.
Discussion
The highest correlation (r = 0.866) between SRTn measurements is found between the newly
developed test (triplet SRTn test by telephone) and the reference test (sentence SRTn test by
headphones). This seems counter-intuitive, because both the type of speech material and the presentation methods (headphones versus telephone) differ. A possible explanation is that selecting and processing of the speech material (equalization of intelligibility and selecting steep slopes of the psychometric curve) was done by presenting the sentences by headphones, and by presenting the triplets by telephone. Consequently, the measurement errors for these two conditions are the smallest, resulting in the highest correlation. When the conditions that differ most are compared with the conditions in which the selection of the speech material took place, i.e. sentence SRTn by telephone and triplet SRTn by headphones, the lowest correlation
(r = 0.726) is, indeed, found. Although the correlation between sentence SRTn by headphones
and triplet SRTn by telephone is very high (r = 0.866), an even higher correlation should be
found when only measurement errors as calculated in ‘Evaluation of the SRTn test in
normal-hearing listeners’ cause the spread around the regression line. The extra spread is probably due to differences between the two SRTn measurement methods. Because the triplet SRTn by
telephone measurement is bandwidth limited, this test does not measure hearing disabilities that are purely due tohearing losses outside this frequency band, e.g. ski-slope hearing losses. A second difference is caused by the speech material used. For many hearing loss configurations, the audibility of consonants is particularly diminished. Consonant recognition is probably more important for the sentence SRTn test than for the triplet SRTn test. Because in the triplet
35 SRTn test the intelligibility of short words from a small, closed set is tested, a correctly
perceived vowel will very often result in a correctly reproduced digit. In the sentence SRTn test,
more information is needed to correctly reproduce the entire sentence. Before discussing the magnitudes of the slopes of the curves in the regression analysis, some remarks on the reliability of the regression analysis are made. First, the assumption of a straight-line relationship between both variables should not be violated. A visual inspection of the scatterplots does not reveal any inconsistency in the relationship. Second, as mentioned before, the ratio between the squared measurement errors in both variables, λ, should be known. In the 95% CIs, the uncertainty in
λ is not accounted for. Therefore, recalculations of the slope intercept and CIs were done in which the ratio between the measurement errors λ was set to plus and minus 10% of its actual (estimated) value. Maximum changes in calculated slopes were less than 0.02, and changes were also less than 0.02 in 95% CI of slopes. The maximum changes in calculated intercepts were less than 0.06 dB, and they were less than 0.08 dB in 95% CI. Slopes and intercepts are clearly not very sensitive to small errors in estimated measurement error ratio. Third, in the regression analysis, it is assumed that measurement errors directly related to the slope of the psychometric curve are constant across hearing loss. Duquesnoy (1983) found diminishing slopes of the psychometric curves for increasing hearing loss. Bosman & Smoorenburg (1995) also found steeper slopes for normal-hearing subjects than for hearing-impaired subjects. Festen & Plomp (1990) and Smoorenburg (1992), on the other hand, found almost the same slopes for normal-hearing and hearing-impaired listeners. Therefore, it is expected that there might be some difference in measurement error between normal-hearing and hearing-impaired subjects, but this effect is probably negligible in the regression analysis. In Table III, the slopes as given by the regression analysis are shown. The slope from nearly 1.0 for both headphone conditions is as expected: hearing-impaired subjects have worse SRTns
independently of the speech material. For the conditions in which the speech material is the same (sentences) but the presentation method differs (headphones versus telephone), a slope that differs significantly from 1.0 (0.70) is found. This means that, for hearing-impaired subjects, the triplet SRTn by telephone differs less from normal values than the sentence SRTn
by headphones. The reason for this can be found in the effect of the limited bandwidth of the telephone. For subjects with high-frequency hearing losses, low-pass filtering the signal should have less effect on SRTn, because high-frequency speech information is already inaudible in the
broadband situation. Second, increases in the upward spread of masking in cochlear hearing-impaired subjects could account for the observed slope. Upward spread of masking is less in the limited bandwidth condition (telephone), especially at low frequencies, because only frequencies between 300 and 3400 Hz are used. Therefore, the difference between sentence SRTn by headphones and sentence SRTn by telephone decreases with increasing hearing loss.
When pure-tone thresholds are compared with SRTns, the correlation is, as expected, not very
high. This illustrates again that pure-tone audiometry is not a valid measure of speech-understanding abilities in noise (e.g. Kramer et al, 1996; Smoorenburg, 1992). The correlation between PTA0.5, 1, 2 and sentence SRTn by headphones, 0.718, is very comparable with the
value of 0.727 as found by Bosman & Smoorenburg (1995). Subjects with conductive or mixed hearing losses score better on the triplet SRTn test by telephone than do subjects with