Does Pinning Lead to Purchasing?
An Evaluation of the Impact Social Media Connectedness has on Online Purchase
Behavior
By: Ryan W. Grange
Abstract
Internet retailing has become extremely competitive in recent years, and this trend will likely continue. While the online retailing universe develops, social media will play an increasing role in how consumers gain information and interact online. As such, it will become pertinent for marketers to understand how their online customers utilize social media and online interactions to shop. Currently, research in this area focuses primarily on brand liking based off of social sources, but what marketers really care about is how that translates into increased sales. There is a lack of research around how social media interaction and usage leads to purchase intent for online consumers. This study utilizes survey data to measure social media usage, and then examines how usage level affects purchase decision making and intent based on hypothetical scenarios with varying influences. The study finds evidence that online interactions have a higher impact for those that are more heavily engaged online, but that this effect does not transcend all product categories. These findings will help marketers target both heavy and light social media users and cater to their online shopping habits in the future.
Key Words: Social Media, Purchase Behavior, Online shopping, Online retailing
Submitted under the faculty supervision of Professor Carlos Torelli, in partial fulfillment of the requirements for the Bachelor of Science in Business, summa cum laude, Carlson School of Management, University of Minnesota, Spring 2015.
Introduction
It is obvious that our world is becoming more digital, but to what extent? Black Friday of 2013 was the first time ever that online retailing outpaced brick and mortar stores as the preferred destination for holiday shopping (Holliday 2013). Although that may come as a surprise to some, online retailing is becoming the norm. At the same time it is hard to forget the other recent online boom: social media. Social media sites like Facebook and Pinterest have captivated all
generations in the last decade, but we have yet to see the full impact that this new connectedness will have on other aspects of life online, especially online shopping. 93% of marketers utilize social media for their online business, but are they using it effectively (Pick 2013)? That is a question that will be asked more often in the coming years, and this study is vital to addressing it as online retailing takes over. Marketers are desperate to learn more about how consumers interact and shop online as the line between social media and retailing becomes blurrier. The intent of this study is to provide insight into that relationship.
This study answers the basic question “Does a high level of social media usage lead to increased purchase intent online based off of information gained in the social atmosphere versus other avenues?” For this study “social media” is defined as any social networking site with greater than 250,000 users from a comprehensive, crowd sourced list of all social networking sites as of June, 2014 (Wikipedia 2014). This method was chosen to provide a reasonably short list for the survey used in this study, although participants were also able to report additional websites they used. Social media usage level was measured on 5 dimensions: Number of
accounts, Number of unique acquaintances, Time spent on social media sites, Interactions when online, and Login Frequency. This study researches this question by utilizing a survey that collects data surrounding social media usage levels as well as respondents’ level of purchase intent when given hypothetical situations in which they gain information about an online
purchase from social and non-social sources. The scenarios measure purchase intent for products across three categories (low to high purchase intent) to add to the breadth of categories the study results can be applied to.
By showing that social media usage level has a direct influence on purchase intent based on social information, as opposed to solely measuring the effect on one brand or one interaction, this study expands on the research that has already been completed on this topic. It encompasses overall social media usage, as opposed to one interaction and helps determine the effect on purchase intent, as opposed to brand liking. This information is useful to online retailing marketers, whose focus is on sales in addition to brand awareness or liking. Ideally, the results could lead to a new way of targeting consumers based on how intertwined their lives are with social media.
This study is organized in the following way. It begins with a review of current literature to provide a grounding of how advanced research in the subject area is. It then discusses the methodology and results of this study, and ends with a discussion and reasoning section. Finally, ideas for future research are provided.
Literature Review
Social media as a means of communication and commerce has been growing exponentially over the last decade; therefore, the need for research on this relatively misunderstood subject has been dramatically increasing. Much of the research done in recent years focuses on the social
interaction that takes place on social media websites, but less on the effects of that interaction on retailing. Despite this, information on how social media influences users in both the retail and other industries is vital as more brick and mortar stores close and retailers open their doors online. This literature review is organized into three themes; each covering a different area of
research this study aims to improve on. The first section discusses research having to do with users’ interaction with online websites and brands, the second covers research on internet users being influenced by other users, and the third discusses studies that link social interactions to purchase intent.
Social Media Acquaintances and Influencers
Much of the research done on the behavior of social media users does not link the
relationships to retailing (i.e. purchase behavior). Instead, most studies stay within the realm of a single or limited number of brands and the effect social media users have on the participants’ liking and interaction with that brand.
For there to be any link between social media usage and user behavior, theoretically there would first have to be a link between brand liking and social media usage or behavior. A study by Naylor, Lamberton and West (2012) utilized a fake brand website to test the relationship between the presence of social media profiles on a brand page and liking of a single brand. The researchers controlled what profiles participants saw and either made the profiles on the page appear to have the same age and gender as the participants, a different age and gender, or left the pictures blank. They found that profiles “like me,” where profiles looked similar to the user in age and gender, as well as blank profiles increased the users’ liking of the brand.
In addition, Banerjee, Mukherjee, and Bandyopadhyay (2012) used a computerized model and varied the number of influencers (those who create social media trends) and friends in a hypothetical online social network to see what impact the influencers had on the network. They found that raising the number of influencers or friends made information travel faster and made the number of people acting on a “task” increase. The study supports the fact that increased
online behavior may lead to action by peers, but it remains to be seen whether these results hold true for real consumers.
Both of these studies contribute important findings to research in this field, but also have opportunities for expansion. Naylor et al. (2012) lacks a tie to purchase intent and did not test the influence level of social media interaction, and Banerjee et al. (2012) lacks the use of real life participants who can react to different stimuli. These studies are the basis for the notion that peers can have an influence on purchase intent, which is part of the inspiration for this study.
Social Presence within a Website
Other studies focus on the effect that having a social presence within a brand website has on users of that site. These studies expand on previous works by examining retailing websites that have a social element or influence. This is the first step to directly linking a social influence with purchase intent.
The most comprehensive study in this category is an experiment done by Park and Cho (2012), where they observed college aged females who were part of an online social apparel brand community. Subjects were studied over three months to ensure that the participants were knowledgeable and immersed in the website and community. What they found is that
participation in this community led to high rates of advice-seeking behavior in relation to the purchase of apparel. This finding is one of the first connections made between social interactions online and decision-seeking behavior. The study was limited, however, in it did not measure social media usage level, but only general participation, and only included females on one social platform.
Other studies focus explicitly on consumers’ interactions with a website. Hwang, Lee, and Kim (2014) found support that social presence (such as user reviews, customer assistance,
etc.) on social-commerce sites (such as Groupon.com) led to increased consumer trust in the website as well as increased purchases overall. Although this study does not plan to measure trust directly, this insight is useful because it points towards a correlation between social interactions and increased confidence in a website, which may lead to purchases from that site. Hutter and Hautz (2013) used the auto brand MINI and its Facebook page to conclude that within fans of the MINI brand on Facebook, heavy interactions with the site led to increased brand liking. This study provided a direct connection with site interaction level to attitudes about a particular brand. This suggests that heightened consumer interaction online with a brand can have a similar effect to interaction with individuals. Both of these studies provide support for the hypotheses of this study because they show directionally that increased interaction and trust lead to greater liking, which in turn should lead to greater purchase intent.
All three studies about social presence within a website provide insight and information into social presence and interaction within individual webpages and brand pages. What these studies lack, however, is a connection to purchase intent from these interactions. These studies were also very limited in their scope. They focused on users of a single platform, and the study by Park and Cho (2012) only included females.
Peer Influence on Purchase Intent
More recent studies have begun to connect the dots between peer influence, social media, and purchase behavior. Cheung et al. (2014) found support that peer action (purchase) displayed on social media and peer reviews on social media would influence a higher purchase intent for those interacting with the influencers. Through data obtained from the website, they also found that the effect of an action by a peer (a purchase) was stronger than a review, which almost directly supports the hypotheses for this study. The study, however, only tested across one social
platform that had only female users, and across only 8 products in one category (health and beauty). Finally, there was no differentiating between heavy and light users, which are all factors this study addresses.
Another study by Hajli (2014) found support for the notion that predicted social support and relationship quality on social media sites would positively influence social commerce intention (purchase). The researcher contained his study to one product category and loosely defined social commerce intention, instead of asking about purchase intent directly. This study expands on Haijli’s work by asking about purchase intent directly across three categories.
Finally, research by Chevalier and Mayzin (2006) and Amblee et al. (2012) studied the effect that online reviews have on purchase intent. The first study shows that consumers do in fact read the text of a review more often than not and that positive reviews had a positive effect on purchase intent. Amblee found the same effect, but limited the study to the online book category. Park et al. (2007) studied online reviews, and found that reviews affect high and low involvement consumers differently. For this reason, three categories with different levels of involvement were chosen for this study. It also includes consumer reviews to study the effect they have on purchase intent, but also extends current research by testing them against other means of gathering information.
Despite similarities to this study, these recent works are lacking in their breadth (i.e. product categories, sample, etc.). This study builds on current research by taking two popular concepts (social influence on purchase intent) and expanding to find a more concrete link between the two. This study utilizes elements of past research by testing proven elements, such as online reviews and webpage usage level; however, it does so in an advanced way by using 5
dimensions to measure social media usage, and testing across three product categories that vary in their purchase involvement from low (apparel) to high (automobiles).
There is a strong presence of recent studies in this field due to the growing importance of social media, but many are narrowly targeted on very specific brands, websites, or consumer types. There is support that increased usage (number of friends) leads to faster information distribution (Banjeree et al. 2012), as well as support that social media users “like me” on a website can increase liking of that brand, and possibly lead to purchase intent (Naylor et al. 2012). Additionally, there is support that online reviews are not as strong as an influencer of purchase as peer interaction (Amblee 2012). Based on these findings, this study proposes that not only is there a direct connection between social relationships and purchase intent, but that it may vary by social media usage level and product category. This study enhances current research by including both female and male consumers across multiple product categories, as well as differentiating between heavy and light users. Purchase intent measurement is also a key point this study addresses, as opposed to solely brand liking. The methodology section describes how this study accomplishes that.
Methodology
This study evaluates whether people who are heavy social media users have different purchase intent habits based on where their product information is gained when making online purchases. A survey was used to collect responses to hypothetical online purchasing situations. These responses from heavy and light social media users were evaluated with a correlation and ANOVA analysis. Additionally, tests were run on light users in a post hoc analysis to add additional insights to the results of this study.
3.1 Hypotheses
As seen from recent work reviewed earlier, social influences and opinions are more readily available and may have an increased effect on decisions we make. It has been demonstrated that a higher level of interaction with a brand page leads to increased liking of that brand, but
increased liking among users that were not as engaged with the Facebook page was not found (Hutter and Hautz 2013). This study utilizes this logic by first measuring the social media usage level of consumers. It then goes beyond that by testing hypothetical situations where a friend recommends a product versus other sources of information when making an online purchase. One of these scenarios is online reviews, which have been shown to be less effective than a social interaction when shopping (Amblee 2012). This information is used to see what effect social media usage level has on actual purchase intent when social relationships are involved. Based on the previous research mentioned, it is expected that those with a higher interaction rate on social media in general are more influenced by social media and their social relationships online when shopping. The first hypothesis is as follows:
Hypothesis 1: Heavy social media users have a higher purchase intent in a situation where a
friend is recommending a product than light users.
The study mentioned earlier by Naylor, Lamberton and West (2012) suggests a higher purchase intent on a fake brand website when actual social media profiles were shown as opposed to dummy profiles. Studies by Cheung et al. (2012) and Amblee et al. (2014) showed support that peer purchase and online reviews have a positive influence on purchase intent. Based on this research, this study expands this idea to multiple categories which have varying levels of purchase interaction, and another dimension: social media usage level. This study also presents another source of information (online website research) to participants to expand the
analysis. Based on previous information, it is believed that the effect on purchase intent,
especially for heavy social media users may stem from the influence a personal acquaintance or friend has versus another anonymous or non-human source. Thus, hypothesis two is as follows: Hypothesis 2: Heavy social media users have higher purchase intent in a situation where a
friend is recommending a product than in other scenarios where only product research is done.
3.2 Data collection and Variables Data Collection
Data was collected via a survey created specifically for this study. In addition to questions about general social media usage were questions that captured social media usage level across 5 dimensions (Number of accounts, Number of unique acquaintances, Time spent on social media sites, Interactions when online, and Login Frequency). Additionally, hypothetical scenarios across three product categories from low to high purchase interaction (Apparel (low), laptop computers (medium), and cars (high)) were presented to capture purchase intent in each scenario based off of the source of information. Three categories were studied to examine whether the effect holds true across multiple categories, or if the level of interaction in a category nullified the effect. The full survey can be found in Appendix A.
The survey was sent out over Facebook since social media use was a qualifier to
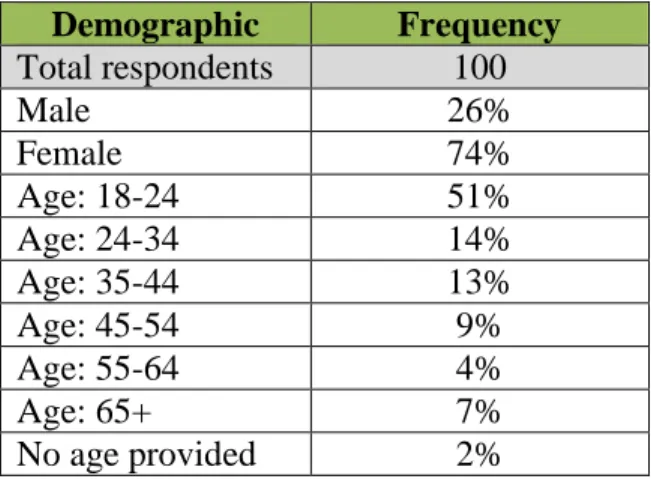
participate in the study. Participants were not paid for their responses due to limited funding and the survey was short in length (<15 minute completion time) to encourage participation. One limitation to this method is the inability to limit sharing of the survey over social media, which resulted in a skewed sample that was younger (65% <34 years old) and female (72% female). The impact of this will be discussed in the limitations section. Table 1 below provides a detailed description of the sample (n=100).
Table 1: Survey Sample Description Demographic Frequency Total respondents 100 Male 26% Female 74% Age: 18-24 51% Age: 24-34 14% Age: 35-44 13% Age: 45-54 9% Age: 55-64 4% Age: 65+ 7% No age provided 2% Variables
For a deeper understanding of the research question and for the ability to analyze the hypotheses from many angles, the analysis was run across five dimensions of social media usage level, three product categories, and three sources of product information (for the hypothetical scenarios shown to participants). The variable used in the analysis, called “social media usage,” is described in table 2:
Table 2: Social Media Usage Variable
Variable Sub variable Description
Social Media Usage
# of social media accounts The number of social media platforms one has an account for in total
Login frequency How often one logs into any of their social media accounts
# of interactions per day How many times one posts, comments, likes, or otherwise interacts with acquaintances on any of their accounts # of unique followers/friends The total number of unique acquaintances one holds on all of
their social media accounts combined
Time spent online in general How long (duration) one spends on social media sites in general in any given day (excluding for work)
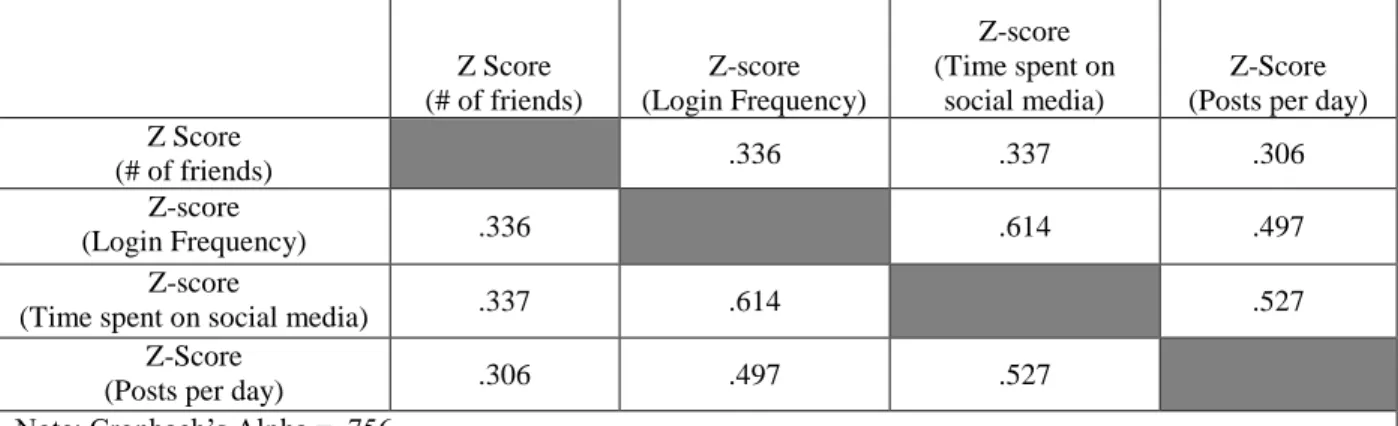
From the data collected, a reliability analysis was run to see how the individual items measuring social media usage correlated with each other. First, the measures were z-scored, since they had differing scales, to allow for comparison. From this exercise, it was found that
four of the five dimensions (Number of unique acquaintances, Time spent on social media sites, Interactions when online, and Login Frequency) were correlated with each other closely. It is believed that “number of accounts” was not a factor in social media usage level for two reasons: First, since new social media platforms pop up frequently, others become obsolete just as fast, so it is hypothesized that people are using fewer platforms consistently. Second, social media platforms are becoming more interconnected, making it easier to post on multiple accounts at one time. For these reasons, it is hypothesized that many people are heavy users as defined by this study, but are truly only heavily active on a few accounts. Table 3 outlines the reliability analysis that was run to help create the social media usage variable.
Table 3: Defining Social Media Usage Variable (Reliability Analysis)
Z Score (# of friends) Z-score (Login Frequency) Z-score (Time spent on social media) Z-Score (Posts per day) Z Score
(# of friends) .336 .337 .306
Z-score
(Login Frequency) .336 .614 .497
Z-score
(Time spent on social media) .337 .614 .527
Z-Score
(Posts per day) .306 .497 .527
Note: Cronbach’s Alpha = .756
Based on a Cronbach’s Alpha of .756 (Kline 2000) and the fact that all inter-item correlations are above .30, it can be concluded that our measure of “social media usage” is reliable. From this variable, heavy users are defined as those one standard deviation above the mean, and light users as those one standard deviation below.
Measuring Purchase Intent
Hypothetical scenarios were used to determine the level of purchase intent when shopping online. An example of one of these scenarios is as follows:
“Imagine you are in need of a new laptop computer, and you have decided to purchase a new one online. You think you want to buy model X from Company B, but you do not know very much about the
performance of the product. To find out more about the product, you go online to learn about the computer model. Please keep this information in mind as you answer the following questions. You know many of your friends online have the same model of computer you are interested in, so you decide to log onto social media and create a post asking for opinions on the computer model. One of your friends leaves a comment that says "I have the same one and I really like it! Works great!" How much does this information alone affect your intent to purchase model X?”
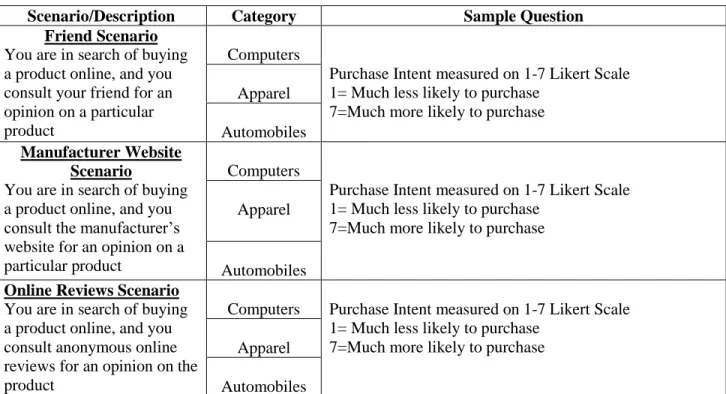
Each scenario presented to the consumer informed them that they were searching for a product online from one of three categories: Apparel (low involvement), Laptop Computers (medium involvement), and Cars (high involvement). Each consumer was presented with all three categories, and hypothetically given information from three sources (a social acquaintance, the manufacturer website, and an online review) about each product. Purchase intent was then measured with a Likert scale based on each information source. Table 4 outlines the scenarios and how purchase intent was measured in each scenario.
Table 4: Hypothetical Scenario Description
Scenario/Description Category Sample Question Friend Scenario
You are in search of buying a product online, and you consult your friend for an opinion on a particular product
Computers
Purchase Intent measured on 1-7 Likert Scale 1= Much less likely to purchase
7=Much more likely to purchase Apparel
Automobiles
Manufacturer Website Scenario
You are in search of buying a product online, and you consult the manufacturer’s website for an opinion on a particular product
Computers
Purchase Intent measured on 1-7 Likert Scale 1= Much less likely to purchase
7=Much more likely to purchase Apparel
Automobiles
Online Reviews Scenario
You are in search of buying a product online, and you consult anonymous online reviews for an opinion on the product
Computers Purchase Intent measured on 1-7 Likert Scale 1= Much less likely to purchase
7=Much more likely to purchase Apparel
Automobiles
Figure 1 maps both hypotheses to the social media usage variable and survey scenarios for easy comprehension of the complete methodology section.
3.3 Statistical analysis
Once the variable “social media usage” was defined, this study utilized a correlation analysis and a Repeated Measures ANOVA with a Continuous Predictor analysis to evaluate the two hypotheses.
Hypothesis 1-Correlation Test
For hypothesis one, purchase intent data from the scenario where a friend recommended a product to the consumer was used. The mean purchase intent of heavy social media users was correlated with the mean purchase intent of light users. Results of this test are discussed in the next section.
Hypothesis 2-Repeated Measures ANOVA with a Continuous Predictor
For hypothesis two, an ANOVA analysis was used to investigate the relationships between heavy social media users while they reacted to three separate scenarios of information gathering when making online purchase decisions. The continuous predictor in this test is social media usage, and the fact that each participant answered all hypothetical scenarios makes it a repeated measures test. This test was chosen to allow us to run a more complex analysis with a limited sample. Results for hypothesis two and additional analysis is displayed in the next section. Due to the multiple product categories (3) this test was run across, support is defined as significant interaction in at least one category.
Upon arriving at the results for these hypotheses, we concluded that additional testing was needed to fully understand the effects that social media usage level, as well as product category were having on consumers. To expand on the study, we ran the analysis for hypothesis two on light users as well, and shared and analyzed those results in the following section as well.
3.4 Appropriateness of Methodology Strengths
The intent of the methodology was to measure a difference in purchase intent among consumers with varying levels of social media usage. With the limited budget available, a survey is a reasonable means of collecting this data. Additionally, writing hypothetical situations that many people taking the survey could relate to (98% of people taking the survey had purchased
something online before) was the best feasible way to measure this. To ensure that every type of heavy user was accounted for, data was initially collected across five types of usage instead of one to provide more depth and gain additional insight. The study also tested scenarios across three product categories with differing levels of purchase interaction to see how the results varied across product category, and to ensure the study was as thorough as possible. It was determined three product categories with differing levels of purchase involvement (apparel=low,
computer=medium, automobile=high) was sufficient to make a reasonable conclusion.
Assumptions
When primary data is collected, there are typically assumptions made based on the researcher’s personal experience and past research. In this study, hypothetical scenarios were worded slightly different to accommodate for the three different categories, and are all worded positively in the sense that it assumed the participant needed to buy the product presented in the survey. It was assumed that participants would interpret all scenarios equally, but it is recognized this is not the case, and different interpretations could affect the results. The study was limited to three
categories, which can never comprehensively capture the effect that all real life scenarios, like the hypothetical ones presented, can have on purchase intent. In choosing three specific categories, it was also assumed that the participants were familiar with those categories and would be able to make a reasonable purchase decision in that category. If this is not the case,
results may be skewed because the participants would be dependent on someone else to make that purchase decision in real life.
Results
4.1 Evaluation of Hypotheses
As stated previously, a correlation and an ANOVA analysis were run to test the two hypotheses. An alpha of 0.05 was used for analysis to ensure statistical significance of a high level.
Evaluation of Hypothesis 1
Hypothesis one stated that when a friend recommended a product to a participant, heavy social media users would have a higher purchase intent than light users based off of that information. A p-value of less than 0.05 is considered significant, and is how support was determined for
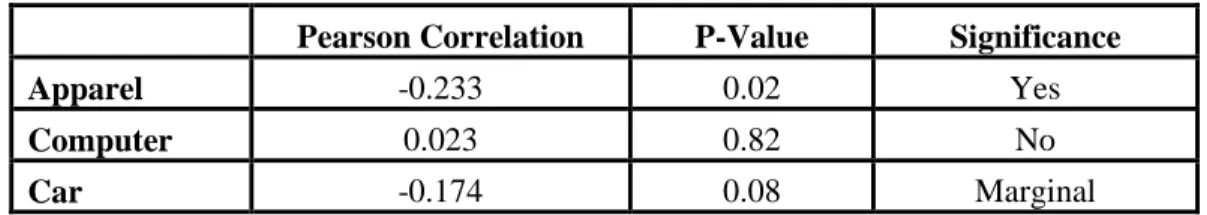
hypothesis one. For hypothesis one, significance was found for the apparel category, and marginal significance was found for the car category, although both correlations were
negative. This finding is based on p-values of 0.02 and 0.08 respectively. This result suggests that heavy social media usage may not be a critical factor when interacting online, and people may react similarly to suggestions from friends regardless of how much they use social media in general. Table 5 displays these findings, and Chart 1 displays the results graphically.
Table 5: Findings for Hypothesis 1
Pearson Correlation P-Value Significance
Apparel -0.233 0.02 Yes
Computer 0.023 0.82 No
Chart 1: Hypothesis 1 Results
Evaluation of Hypothesis 2
Hypothesis two stated that heavy social media users have a higher purchase intent in a situation where a friend recommends a product than other scenarios where social interactions are not involved in gaining product information. A p-value of less than 0.05 is considered significant, and is how support was determined for hypothesis two. Support for hypothesis two was found for both scenarios (friend vs. online reviews, friend vs. website research) in the apparel
category and marginal support was found for the friend vs. online review scenario in the
car category. Support for the apparel category is based on mean differences of 0.9 and 0.85, and p-values of 0.00. In the scenario where website research was used, the correlation is negative, so although the difference in means was statistically significant, it does not support the hypothesis. Marginal support for the online review scenario in the car category is based on a mean difference of 0.26 and a p-value of 0.07. It is believed that significance was found in the apparel and car categories because they are products that allow consumers to display their sense of personality in a more outward manner, and so a social opinion is more important for these products. This will
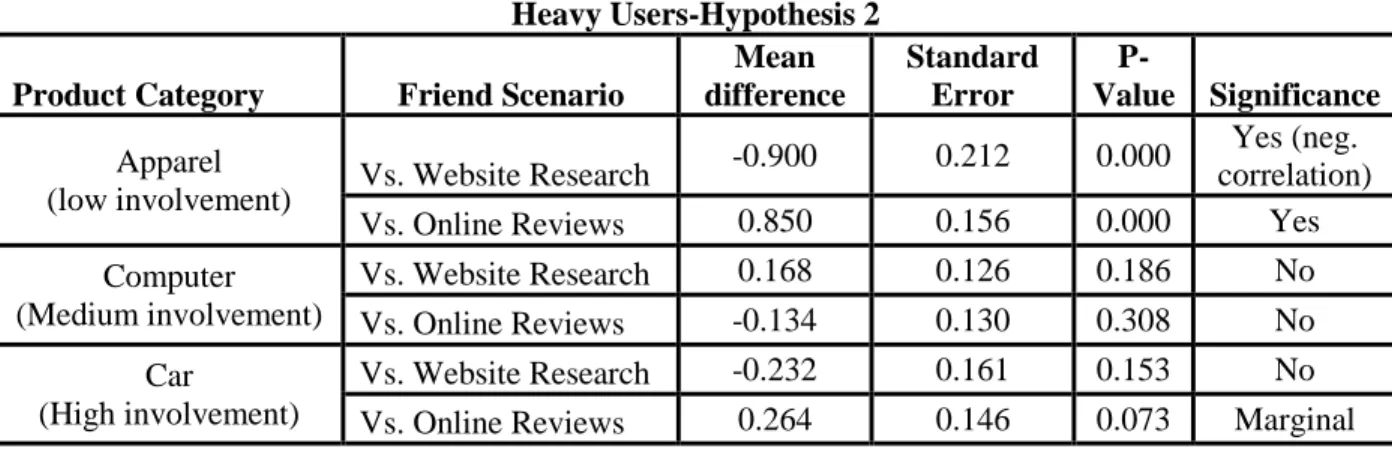
be discussed further later on. Table 6 displays these findings, Chart 2 displays the differences in means, and Chart 3 displays the P-values for heavy users.
Table 6: Findings for Hypothesis 2 (Heavy Users)
Heavy Users-Hypothesis 2
Product Category Friend Scenario
Mean difference Standard Error P-Value Significance Apparel
(low involvement) Vs. Website Research
-0.900 0.212 0.000 Yes (neg. correlation) Vs. Online Reviews 0.850 0.156 0.000 Yes Computer (Medium involvement) Vs. Website Research 0.168 0.126 0.186 No Vs. Online Reviews -0.134 0.130 0.308 No Car (High involvement) Vs. Website Research -0.232 0.161 0.153 No Vs. Online Reviews 0.264 0.146 0.073 Marginal
Chart 2: Mean Differences for Hypothesis 2 (Heavy Users)
-0.90 0.85 0.17 -0.13 -0.23 0.26 -1 -0.8 -0.6 -0.4 -0.20 0.2 0.4 0.6 0.81 Vs. Website Research Vs. Online Reviews Vs. Website Research Vs. Online Reviews Vs. Website Research Vs. Online Reviews
Apparel Computer Car
Chart 3: P-values for Hypothesis 2 (Heavy Users)
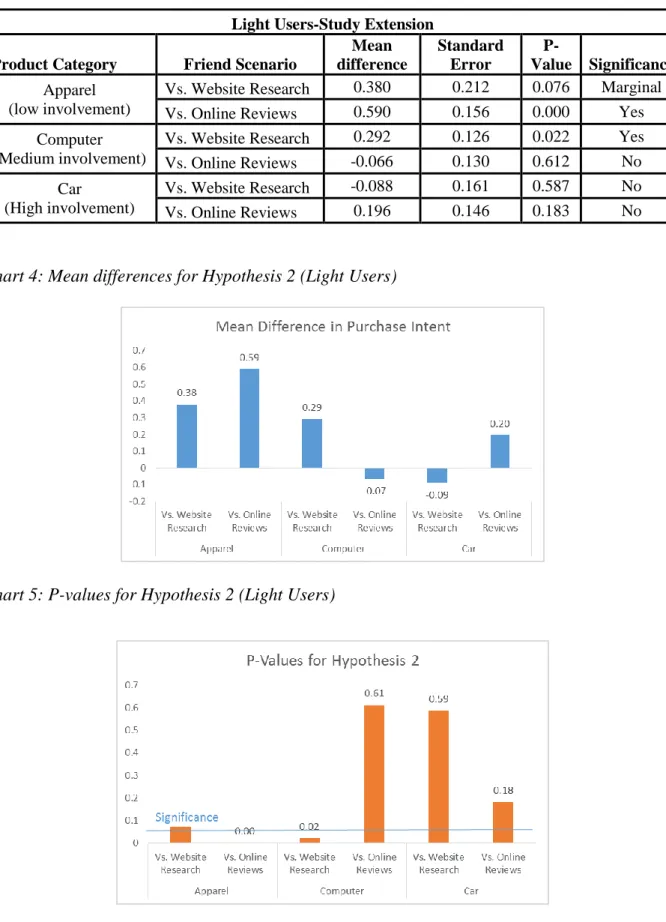
To expand on this study, the same test was run as a post-hoc analysis among light users. Among that group, the hypothesis was found to be true in the apparel category for the friend vs. online review scenario and in the computer category for the friend vs. website research scenario, as well as marginally true for the website research scenario in the apparel category. This support is based off of mean differences of 0.59, 0.29 and 0.38 and p-values of 0.00, 0.02, and 0.07 respectfully. Although the results differed slightly, this suggest that there may be an overarching effect based on trust that a personal relationship has when making purchase decisions, as well as that this effect differs significantly based on product category. Another explanation for both sets of results for hypothesis two may be an overall enhanced online awareness and usage
competency among heavy users. This could affect the results in the sense that they would be more willing to gain information from multiple online sources. This is discussed in more detail in the discussion section. Detailed results of this analysis are in Table 7.
Table 7: Post-Hoc Analysis on Light Users
Light Users-Study Extension
Product Category Friend Scenario
Mean difference Standard Error P-Value Significance Apparel (low involvement)
Vs. Website Research 0.380 0.212 0.076 Marginal Vs. Online Reviews 0.590 0.156 0.000 Yes Computer
(Medium involvement)
Vs. Website Research 0.292 0.126 0.022 Yes Vs. Online Reviews -0.066 0.130 0.612 No Car
(High involvement)
Vs. Website Research -0.088 0.161 0.587 No
Vs. Online Reviews 0.196 0.146 0.183 No
Chart 4: Mean differences for Hypothesis 2 (Light Users)
Discussion
Key takeaways
Based on the partial support for both hypotheses, it can be concluded that there certainly is an effect social media acquaintances have on purchase decision making online. The role that social media usage, as defined by this study, and product category play in this interaction is less clear, however. Overall, this effect was greatest in the apparel category, the one deemed least involved when making a purchase decision based on price point and frequency of purchase.
This finding is important for marketing managers and the business population in general because it provides context around how consumers utilize social interactions when shopping online. What they can learn from this is that social media usage level may be a factor only in certain categories. Findings for hypothesis one showed that although purchase intent means for heavy users were significantly different, social media usage level may not be a critical factor when interacting online, and people may react similarly to suggestions from friends regardless of how much they use social media in general. This may be based on the external factor of trust of online resources, and would have to be explored further. One can see, however, that on less personal or social items, such as a computer, there is less of an effect there. From hypothesis two, there is great value to managers in learning that in some categories social media influences have greater effects on shoppers than other information sources. They can use this information to best spend their marketing dollars targeting influencers online or advertising to highly-connected people online to prompt them to share products, instead of investing in building positive
anonymous reviews or in their own webpage. Again, this applies only to certain categories, and so marketers particularly in low involvement categories can benefit from this knowledge.
Possible Explanations
Because of the variance in the results, here are a few possible explanations. Results for
hypothesis one were only significant for two of the three categories. The least of the “personal” categories, laptop computers, was the only category without significantly different means between heavy and light users. When consumers buy cars and apparel, they buy them to fit their sense of style and personality. These are products consumers wear and show off on a daily basis, as opposed to a computer which is typically used in private or in a working setting. Because of this, it is hypothesized consumers in general would be more inclined to seek social approval or social opinions when buying the more personal items. Additionally, heavy social media users may be more versed online in general, and more likely and willing to seek information online. These external factors could have influenced the results as well.
There was also varying support for hypothesis two, but again the most support was seen in the apparel category. This effect was also found among light users, however the bond was not as strong suggesting social media usage level does have a small, but not significant, effect on how much influence a friend has versus other means of gathering information. Based on these results, there may be an overarching trust placed in friendships online that transcends social media usage level, and only applies on lower involvement items. When buying more expensive, higher involvement items, people may do more research in general, and so this effect would not be shown since in the survey scenarios information was only provided from one source at a time. Again, heavy users may be more competent online in general, which may have had an effect on the results for hypothesis two as well. For both hypotheses, this could have caused them to report a lower level of purchase intent because they are used to researching products from multiple
sources every time they shop. Recreating this study while measuring trust of online resources and online competency is an opportunity for future research in this area.
Conclusion
The general purpose of this study was to see how purchase intent when online shopping is influenced by different social and non-social information sources. There was an overlying goal of measuring social media usage and seeing if that played a role in those influencing factors as well. Additionally, more tests were run to better understand these interactions and expand the study with the data collected. Overall, both hypotheses were supported partially, but particularly in the apparel category, which included products that are low involvement purchase items and more symbolic products that tells others about oneself. This has many implications for managers, who can utilize this information when budgeting marketing dollars. They can focus on personal interactions for low involvement categories, and allocate dollars across more sources (reviews, websites, etc.) for other categories. When spending to target consumers that are highly connected online, they can focus on these users for certain categories that are more personal, as opposed to less personal products (like computers). Although many useful insights were discovered, there is always room for advancing this research area.
Limitations and Areas of Future Research
The study faced some limitations, which will be discussed here. Specifically related to the sample, the fact that it was a convenience sample was limiting in itself, and having 100 usable responses limited the breadth of the study. The sample was skewed female and younger overall (76% female; 51% age 18-24). This impacts where and how this information can be applied. It cannot be extrapolated to represent the entire population, therefore findings must have that
caveat. Additionally, the study was limited to three product categories, so it cannot be assumed that consumers would react the same to all products, despite similar purchase involvement.
When applying these results in a business context, although the majority of companies promote themselves online today, not all have the budget to target specific audiences with their social media advertisements. This research applies more directly to companies trying to cater to niche markets and in categories that are highly dependent on word of mouth promotion. Due to the specificity of the study and its focus on heavy users, findings cannot be applied to all users. We defined social media usage by first measuring 5 dimensions, four of which were z-scored to create a measure of social media usage. There are countless ways to measure this variable, and so this study had to be limited to one specific definition. Future research could certainly define it differently to add to these findings. It may also be difficult for companies to define and target heavy users, since it may not be cost effective as a marketing strategy, limiting the application of the results that focus on heavy vs. light social media users.
The final aspect of the study was the measurement of purchase intent. The utilization of a convenience sample survey to collect data is not the most concrete way of measuring purchase intent. All data was self-reported, and so a lot of trust is placed in the consumer to accurately report their purchase intent and usage. Additionally, all of the scenarios were worded slightly differently to accommodate for products, and so were not 100% comparable. In presenting these scenarios it was assumed that participants were familiar with and able to make a purchase decision in all categories. All of these limitations effect where this information can be applied, and so overall these findings should be taken directionally.
Because of these limitations there are many ways to expand on and add to this study. A few very simple ways would be to replicate the study across other categories to see if the findings hold true in similar purchase situations. Researchers could also define social media usage level differently to examine how different measures affect these results.
More broadly, it is hypothesized that trust, personalization of the items presented, and internet competency had great overarching effects on these results. To expand on this research, the methodology from this study should be examined in the context of how much trust users have on each of the three information sources presented. Additionally, there are ways to measure how consumers feel about how much a certain product represents them. Asking these questions in addition to the ones already asked in this study could provide more context and add value to this area of research.
References
1. Amblee, Naveen, and Tung Bui. "Harnessing the Influence of Social Proof in Online Shopping: The Effect of Electronic Word of Mouth on Sales of Digital Microproducts." International Journal of Electronic Commerce 16.2 (2012): 91-113. Print.
2. Banerjee, S., Mukherjee, A., & Bandyopadhyay, S. (2012). Effect of Social Networks on Consumers' Inclination towards Online Shopping using Transaction Cost Analysis in an Agent-based Framework [Electronic version]. GSTF, 1-5.
doi:10.5176/2251-2055_MME1225
3. Chevalier, Judith A., and Dina Mayzlin. "The Effect of Word of Mouth on Sales: Online Book Reviews." Journal of Marketing Research 11.3 (2006): 345-54. Print.
4. Holliday, Katie. "New top choice for shoppers: Online overtakes brick-and-mortar."CNBC. N.p., 18 Nov. 2013. Web. 22 Apr. 2014.
<http://www.cnbc.com/id/101205503>.
5. Hutter, K., & Hautz, J. (2013). The impact of user interactions in social media on brand awareness and purchase intention: the case of MINI on Facebook [Electronic version]. Journal of Product & Brand Management, 22(5), 342-351.
6. Hwang, I., Lee, B. G., & Kim, K. Y. (2014). Information Asymmetry, Social Networking Site Word of Mouth, and Mobility Effects on Social Commerce in Korea
[Electronic version]. Journal of Cyberpsychology, Behavior and Social Networking,17(2), 117-124.
7. K. Cheung, Christy M., Bo S. Xiao, and Ivy L. B. Liu. "Do actions speak louder than voices? The Signaling Role of Social Information Cues in Influencing Consumer Purchase Decisions." Elsevier-Decision Support Systems 65 (2014): 50-58. Print. 8. Kline, Paul. The handbook of psychological testing. 2nd ed. London: Routledge, 2000.
Print.
9. "List of social networking websites." Wikipedia. N.p., June 2014. Web. 9 June 2014. 10.Naylor, R. W., Lamberton, C. P., & West, P. M. (2012, November). Beyond the "Like"
Button: The Impact of Mere Virtual Presence on Brand Evaluations and Purchase Intentions in Social Media Settings [Electronic version]. Journal of
Marketing, 76, 105-120.
11.Nick Hajli, M. "The Role of Social Support on Relationship Quality and Social
12.Park, H., & Cho, H. (2012). Social network online communities: information sources for apparel shopping [Electronic version].Journal of Consumer Marketing, 29(6), 400-411.
13.Park, Do-Hyung, Jumin Lee, and Ingoo Han. "The Effect of On-Line Consumer Reviews on Consumer Purchase Intention: The Moderating Role of Involvement." International Journal of Electronic Commerce 11.4 (2007): 125-48. Print.
14.Pew Research Internet Project. N.p., Sept. 2013. Web. 23 Apr. 2014.
<http://www.pewinternet.org/fact-sheets/social-networking-fact-sheet/>. 15.Pick, Tom. "101 Vital Social Media and Digital Marketing Statistics."social media
today. N.p., 6 Aug. 2013. Web. 23 Apr.
2014.<http://socialmediatoday.com/tompick/1647801/101-vital-social-media-and-digital-marketing-statistics-rest-2013>.
APPENDIX A Survey
Q1 The purpose of this research survey is to collect information on social media and online purchase habits and behavior. This is a research project being conducted by Ryan Grange at the University of Minnesota. Your participation in this research study is voluntary. You may choose not to participate. If you decide to participate in this research survey, you may withdraw at any time. If you decide not to participate in this study or if you withdrawal from participating at any time, you will not be penalized. The procedure involves filling out an online survey that will take approximately 10 minutes. Your responses will be confidential and we do not collect identifying information such as your name, email address or IP address. We will do our best to keep your information confidential. All data is stored in a password protected electronic format. To help protect your confidentiality, the surveys will not contain information that will personally identify you. The results of this study will be used for scholarly purposes only and may be shared with University of Minnesota representatives. If you have any questions about the research study, please contact Ryan Grange ([email protected]).This research has been reviewed according to University of Minnesota IRB procedures for research involving human subjects. ELECTRONIC CONSENT: Please select your choice below. Clicking on the "I agree “button below indicates that:• you have read the above information• you voluntarily agree to participate• you are at least 18 years of age If you do not wish to participate in the research study, please decline
participation by clicking on the "I disagree" button.
I Agree
Q2 Please check the following General/Sharing social media services for which you have an account, if any (select as many as apply).
Facebook Friendster Google + LinkedIn Myspace Orkut Pinterest Reddit Faceparty Bebo Habbo Delicious Digg Other ____________________
I do not have an account with any of the above services
Q3 Please check the following Microblog/Blog social media services for which you have an account, if any (select as many as apply).
Wordpress
Tumblr
Other ____________________
I do not have an account with any of the above services
Q4 Please check the following Music Related social media services for which you have an account, if any (select as many as apply).
Last.FM (1)
Spotify (2)
Soundcloud (3)
Other (4) ____________________
Q5 Please check the following Photo/Video Sharing social media services for which you have an account, if any (select as many as apply).
YouTube
Vine
Flikr
Other ____________________
I do not have an account with any of the above services
Q6 Please check the following Messaging social media services for which you have an account, if any (select as many as apply).
GroupMe
Kik
Other ____________________
I do not have an account with any of the above services
Q7 Please check the following Specialty/Other social media services for which you have an account, if any (select as many as apply).
Classmates.com Gaia Online Flixster deviantART Second Life Formspring Yelp MyLife Foursquare Other ____________________
Q8 For what purposes do you use the sites you indicated above?
Communicating with acquaintances
Updating others on your personal life
Learning about brands
Learning about news/current events
Looking for things to buy
Looking for services (dry cleaning, doctor/dentist, lawn-care, etc.)
Looking for entertainment (concerts, restaurants, movies, etc.)
Other ____________________
Q3 Please indicate how often you log in to or use any social media service on average.
Every 5 minutes or more often (during the day)
Every half hour (during the day)
Every hour (during the day)
Every few hours (during the day)
Once a day
Once every few days
Once a week
Less than once a week
Never
Q9 About how much time on average do you spend on the Internet (both social media and non-social media websites) every day? Please do not include usage time for which you are paid to use the Internet (such as at a job).
More than 5 hours per day
About 5 hours per day
About 4 hours per day
About 3 hours per day
About 2 hours per day
About 1 hour per day
Less than one hour per day
Q10 About how much time on average do you spend on social media websites every day? Please do not include usage time for which you are paid to use the Internet (such as at a job).
More than 5 hours per day
About 5 hours per day
About 4 hours per day
About 3 hours per day
About 2 hours per day
About 1 hour per day
Less than one hour per day
I do not use social media daily
Q11 About how often in general do you interact with others on social media websites (i.e. posting a status, favorit-ing a post, messaging another user, etc.)?
More than 50 times per day
Between 25-50 times per day
10-25 times per day
5-10 times per day
1- 5 times per day
Less than once per day
Never
Q12 About how many unique acquaintances do you have on all of the social media sites you have accounts with combined?
Less than 50 50-100 100-250 250-500 500-1000 1000-2500 2500 +
Q13 Do you or have you ever purchased anything online?
Yes
No
Q14 Where do you find information about products you are looking at purchasing online? (please list all ways you find information)
Q15 What types of items do you or have you shopped for online?
Automobiles
Electronic devices (cell phones, laptops, etc.)
Groceries or food
Clothing
Furniture
Books
Music
Other (please specify below) ____________________
Q16 How often do you look for items to buy online?
About once per day
About once every few days
About once per week
About once every few weeks
About once per month
About once every few months
Less often than once every few months
Q17 When shopping for items online, how often do you actually purchase one or multiple items?
About once per day
About once every few days
About once per week
About once every few weeks
About once per month
About once every few months
Q18 The following scenarios are hypothetical and are designed to see how you would react when searching for a new product online. Please think about your online shopping habits when
answering the following questions.
Q19 Imagine you are in need of a new laptop computer, and you have decided to purchase a new one online. You think you want to buy model X from Company B, but you do not know very much about the performance of the product. To find out more about the product, you go online to learn about the computer model. Please keep this information in mind as you answer the
following questions.
Q20 You consult Company B's website to look at information about the model of laptop computer. You find out that it has enough storage for your needs, is fast compared to other computers on the market, and seems to be a good value. How much does this information alone affect your intent to purchase model X?
Very much more likely to purchase
Much more likely to purchase
Somewhat more likely to purchase
No effect on purchase decision
Somewhat less likely to purchase
Much less likely to purchase
Very much less likely to purchase
Q21 You know many of your friends online have the same model of computer you are interested in, so you decide to log onto social media and create a post asking for opinions on the computer model. One of your friends leaves a comment that says "I have the same one and I really like it! Works great!" How much does this information alone affect your intent to purchase model X?
Very much more likely to purchase
Much more likely to purchase
Somewhat more likely to purchase
No effect on purchase decision
Somewhat less likely to purchase
Much less likely to purchase
Very much less likely to purchase
Q22 You decide to consult online reviews for the product to learn about others' experiences with that model of computer. You come across a trustworthy website with a list of reviews from consumers of model X. The most recent review on the page says "I have model X and it has
worked great for me!" How much does this information alone affect your intent to purchase model X?
Very much more likely to purchase
Much more likely to purchase
Somewhat more likely to purchase
No effect on purchase decision
Somewhat less likely to purchase
Much less likely to purchase
Very much less likely to purchase
Q23 Now imagine you are in need of a new shirt, and you have decided to purchase a new one online. You think you want to buy a particular blue shirt you saw your friend wearing, but you do not know very much about the quality of the product. To find out more about the product, you go online to learn about the shirt. Please keep this information in mind as you answer the
following questions.
Q24 You consult the shirt company's website to look at information about the blue shirt. You find out that it is made by hand out of strong material, and seems to be a good value. How much does this information alone affect your intent to purchase the blue shirt?
Very much more likely to purchase
Much more likely to purchase
Somewhat more likely to purchase
No effect on purchase decision
Somewhat less likely to purchase
Much less likely to purchase
Very much less likely to purchase
Q25 You know one of your friends has the same shirt you are interested in, so you decide to log onto social media to look at a picture of them in it. You notice that 20 friends have liked the
picture of your friend in the shirt. How much does this information alone affect your intent to purchase the blue shirt?
Very much more likely to purchase
Much more likely to purchase
Somewhat more likely to purchase
No effect on purchase decisions
Somewhat less likely to purchase
Much less likely to purchase
Very much less likely to purchase
Q26 You decide to consult online reviews for the product to learn about others' experiences with that particular shirt. You come across a trustworthy website with a list of reviews from
consumers of the brands' clothing products. The most recent review on the page says "I love this shirt!" How much does this information alone affect your intent to purchase the shirt?
Very much more likely to purchase
Much more likely to purchase
Somewhat more likely to purchase
No effect on purchase decision
Somewhat less likely to purchase
Much less likely to purchase
Very much less likely to purchase
Q27 Now imagine you are in need of a new car, and you have decided to purchase a new one online. You think you want to buy model Z from manufacturer A, but you do not know very much about the car yet. To find out more about the product, you go online to learn about the car. Please keep this information in mind as you answer the following questions.
Q28 You consult the manufacturer's website to look at information about model Z. You find out that it is a high performance vehicle, has no history of malfunction, and seems to be a good value. How much does this information alone affect your intent to purchase model Z?
Very much more likely to purchase
Much more likely to purchase
Somewhat more likely to purchase
No effect on purchase decision
Somewhat less likely to purchase
Much less likely to purchase
Q29 You want to see what your friends think about the car, so you post on social media asking for their opinions on model Z. One of your friends replies saying: "I think model Z is an awesome choice!" How much does this information alone affect your intent to purchase model Z?
Very much more likely to purchase
Much more likely to purchase
Somewhat more likely to purchase
No effect on purchase decision
Somewhat less likely to purchase
Much less likely to purchase
Very much less likely to purchase
Q30 You decide to consult online reviews for the product to learn about others' experiences with model Z. You come across a trustworthy website with a list of reviews from owners of the car. The most recent review on the page says "This car is awesome!" How much does this
information alone affect your intent to purchase model Z?
Very much more likely to purchase
Much more likely to purchase
Somewhat more likely to purchase
No effect on purchase decision
Somewhat less likely to purchase
Much less likely to purchase
Very much less likely to purchase
Q31 What is your gender?
Male
Female
Q32 What is your age?
18-24 24-34 35-44 45-54 55-64 65+