FRAME: SKILLS FOR
THE FUTURE
SUPPORTING A STRATEGIC VISION FOR
HUMAN RESOURCES DEVELOPMENT
MONITORING TOOL
A SET OF GUIDELINES FOR
ASSESSING PROGRESS TOWARDS
THE SKILLS VISION 2020
The contents of this paper are the sole responsibility of the ETF and do not necessarily reflect the views of the EU institutions.
@ European Training Foundation, 2014. Reproduction is authorised provided the source is acknowledged.
MONITORING TOOL
A SET OF GUIDELINES FOR
ASSESSING PROGRESS TOWARDS
THE SKILLS VISION 2020
PRE-NOTE
This tool was developed between Q4/2013 and Q2/2014 by the ETF, after discussions and debates involving the countries' National Technical Teams on monitoring issues. Thanks go to the ETF country managers for their valuable comments and to Manuela Prina, Simona Rinaldi and Lucia Vergano for their contributions, and last but not least, to Anastasia Fetsi for her advice and guidance.
The tool provides a set of guidelines on how to assess the progress towards the countries' Visions for Skills 2020. Practical implementation must be tailored to specific national conditions.
Initial lessons learnt from road-test of the monitoring tool in Montenegro and contributions from national experts and stakeholders during the bilateral country work and FRAME technical regional meetings have been taken into account in drafting this document. It should guide and inspire the roll-out of the Skills 2020 progress monitoring in Sroll-outh Eastern Europe and Turkey.
Doriana Monteleone and Cristina Mereuta September 2014
Contents
Pre-note ... 2
Introduction ... 4
Section 1. Context ... 6
1.1 FRAME monitoring component ...6
1.2 Complementarity with other progress-monitoring processes ...7
Section 2. General concepts and conditions for a sound monitoring process ... 10
2.1 What is monitoring? ... 10
2.2 Indicators for monitoring ... 11
2.3 Data quality and data sources ... 12
2.4 Benchmarking ... 13
Section 3. FRAME monitoring tool ... 15
3.1 Structure of the indicators ... 15
3.2 Qualitative evidence-based monitoring ... 18
3.3. Monitoring process: main phases and contribution to policy development ... 21
Annexes ... 27
Annex 1. Reference indicators for EU and regional benchmarking... 27
Annex 2. Common indicators – Definitions ... 30
List of abbreviations ... 31
Glossary ... 32
INTRODUCTION
Promoting sustainable economic growth and creating a more cohesive society require the population to possess appropriate specific skills. Such skills need to be generated through strategic policies for human capital development. Policy making, if it is to be effective, must be based on evidence. This means that relevant stakeholders at various levels need to follow and control the progress of policies in terms of their content, development and results through a monitoring process, and to identify the corrective actions that will eventually be needed.
The European Commission has entrusted the ETF with the task of supporting enlargement countries1 in their human resource development (HRD) efforts. The overall objective is to promote sustainable economic development and social cohesion within a medium- to long-term perspective, with particular reference to the Europe 2020 Strategy and the South East Europe 2020 (SEE 2020) Strategy. The initiative is being implemented in 2013 and 2014, and is funded under the 2013 Instrument for Pre-Accession Assistance (IPA) multi-beneficiary envelope.
The FRAME project has four components, which are treated as a single intervention: ■ Foresight,
■ review of institutional arrangements, ■ monitoring,
■ regional cooperation.
This is designed to help the countries involved to:
1. define a vision and a roadmap for skills in a wider HRD context for 2014–2020 (based on the foresight methodology developed by the ETF, and taking into consideration the contributions to skills development in different learning contexts: formal, non-formal and informal learning); 2. identify capacity-development priorities for the implementation of the roadmap (based on a review
of institutional capacity using the methodology developed by the ETF);
3. develop the monitoring tool to support policy makers in assessing the progress towards the Skills Vision 2020;
4. enhance regional cooperation for comprehensive long-term and forward-looking policy planning and implementation, taking into account country specificities.
The present paper aims to provide guidelines for monitoring the process of skills development and assessing the progress towards Skills Vision 2020.
The first section provides an overview of the FRAME monitoring component and the process within countries and at regional level. It presents the monitoring and assessment processes that are carried out in the EU and South Eastern Europe, and by the ETF. It also describes the complementarity of the FRAME monitoring tool with all these processes.
1
Albania, Bosnia and Herzegovina, the former Yugoslav Republic of Macedonia, Kosovo (this designation is without prejudice to position on status, and is in line with UNSCR 1244 and the ICJ Opinion on the Kosovo Declaration of Independence), Montenegro, Serbia and Turkey.
The second section focuses on the general principles and definitions that facilitate a sound monitoring process and on the most relevant data sources for the HRD area.
The third section describes the structure of indicators and their EU and regional relevance, and explains how national specificities are reflected in the FRAME indicators. It also provides a recommended framework for the monitoring process at national level (milestones; timing; how the monitoring results should feed into policy making and budget allocation) and a set of tools to allow visualisation of the progress made.
The reference indicators for EU and regional benchmarking and the common indicators chosen for the FRAME monitoring tool are presented in the annexes.
SECTION 1. CONTEXT
1.1 FRAME monitoring component
Through the monitoring component of the FRAME Initiative, the ETF has assisted the enlargement countries to develop and follow an evidence-based tool to monitor progress towards achieving the Skills Vision 2020, roadmap and capacity-development plan. Building on the results from the foresight and review of institutional arrangements components, and taking into account national, regional and EU strategic objectives, the monitoring component focuses on which indicators are needed to monitor progress towards the Skills Vision 2020.
The ETF has worked with national authorities and stakeholders to define and agree on the monitoring tool. A special focus was placed on the challenges faced by enlargement countries in relation to their capacity to define and roll out a monitoring process based on an integrated approach of priorities, targets and indicators:
■ issues of data availability at national level and comparability at the regional and EU levels – most SEET (South Eastern Europe and Turkey) countries face human and financial resource
constraints, time lags in data collection, inconsistencies between methodologies over time, etc.; ■ the need to use the available data more efficiently for policy making and to further develop sound
mechanisms for monitoring progress.
The aim was to create a monitoring tool to support policy makers in assessing the progress towards the Skills Vision 2020 in the wider context of EU and regional cooperation processes.
The work on the development of the monitoring tool was structured so as to be flexible and adapted to countries’ specific needs. A participatory approach ensured that national stakeholders were committed to and in agreement with the monitoring tool. The core elements of this participatory approach were the national technical teams (NTTs) that gathered representatives from relevant ministries (labour, education, economy, development, research, youth, etc.) and implementing agencies, statistical offices and other stakeholders.
With the support of the ETF, NTTs were responsible for identifying a list of indicators to be used for monitoring progress in skills development at national level and in referencing the progress of countries against regional (SEE 2020) and EU (Europe 2020 and Education and Training 2020) goals. This allowed a thorough check to be made of proposed monitoring methods and indicators against each country’s specificities in terms of priorities in the field of skills generation and capacity development. NTTs gave advice on the relevance and feasibility of indicators and the identification of gaps in current capability to gather, process and disseminate key indicators for the HRD field. The main purpose was to find a ‘common denominator’ set of indicators that are fully in line with international and EU
statistical standards and available in all or most of the enlargement (SEET) countries.
A local transversal expert also supported the NTTs to provide inputs for regional technical meetings and foster agreement on the indicators and methodological approach.
Phased approach used for the monitoring tool’s development
1.2 Complementarity with other progress-monitoring processes
The ETF has used the main strategic frameworks adopted at EU and regional level as reference sources for indicator proposals. These are highly relevant for the enlargement countries given their engagement on the EU accession path. The intention was to support countries’ efforts in achieving full compatibility with the EU and regional benchmarking processes. To this end, the tool takes into consideration two dimensions: (i) the national process for skills development (as a result of the foresight and review of institutional arrangements components); and (ii) the country’s performance at EU and regional levels (Europe 2020 and SEE 2020 strategies).
Conceptualisation phase October 2013
Monitoring tool outline (draft). Draft set of common indicators; preliminary check of feasibility and relevance for HRD.
Setting up NTTs October 2013
Identification of NTTs’ members (relevant ministries and authorities, statistical offices, other stakeholders).
Roadtesting of the monitoring tool in Montenegro 12 November 2013 Discussion with the Montenegro NTT of the relevance and applicability of the
proposed tool and related indicators (common list).
First technical regional meeting in Sarajevo (Bosnia and Herzegovina) 26 November 2013 Objectives: (i) present the monitoring tool; and (ii) receive country’s feedback
on the relevance and applicability of the proposed tool and related indicators.
Bilateral work with the NTTs December 2013–
June 2014 Objectives: (i) finalise the list of indicators, taking into consideration the
indicators proposed during the foresight and review of institutional arrangements exercises (vision and roadmap; institutional capacity); and (ii) gather information on data availability.
Follow-up activities in the countries (in the time between the two regional technical meetings) to further support them in selecting country-specific indicators, checking the availability of common indicators and identifying the main gaps and capacity-improvement needs in relation to HRD evidence.
Second technical regional meeting in Turin (Italy) 25 June 2014 Objectives: (i) present the final version of the monitoring tool, taking into
account the country feedback gained during the bilateral work; and (ii) agree on the applicability of the tool (i.e. methodological approach, indicators, ensuring regional and EU comparability).
Finalisation phase June–July 2014
Monitoring tool to be finalised, according to all the input from the national stakeholders, and shared with the participating countries.
The FRAME monitoring tool connects national progress monitoring with follow-up processes that are in place at EU and regional levels (see Annex 1 for a complete list of indicators and definitions), as follows.
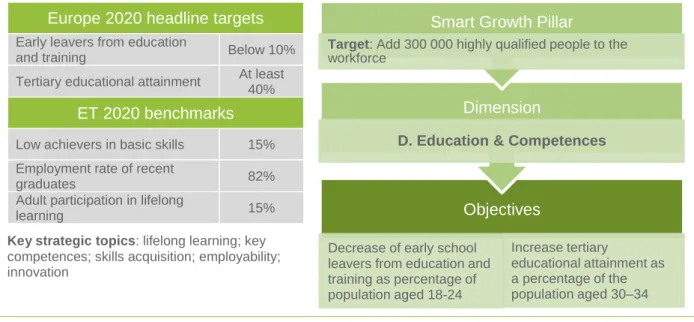
■ Europe 2020 – the EU’s growth and jobs strategy. The tool makes reference to HRD-related goals, namely the headline targets covering education and employment (early leavers from education and training, tertiary educational attainment, employment rate). It also adapts the methodological principles of the Joint Assessment Framework (the monitoring tool of the Europe 2020 Strategy) to the context of countries involved in the FRAME Initiative.
■ SEE 2020 – a regional strategy for jobs and prosperity from an EU perspective. The tool takes into consideration the HRD goals for human capital development and their impact on labour market performance, namely from the targets and objectives set under the Smart Growth Pillar – Dimension D. Education and Competences, and the Inclusive Growth Pillar – Dimension L. Employment.
■ Strategic Framework for European Cooperation in Education and Training 2020 (ET 2020) – a common set of objectives adopted at EU level to address the education and training challenges. The focus is on promoting lifelong learning and learning mobility; improving quality and efficiency; ensuring social cohesion and active citizenship; and enhancing creativity and innovation, including entrepreneurship, at all levels of education and training. Benchmarks that are relevant for the skills-development process were selected, namely achievements in reading, maths and science, and adults’ participation in lifelong learning2.
■ European Quality Assurance Reference Framework for Vocational Education and Training (EQARF) – a framework comprising quality criteria, indicative descriptors and reference indicators to further improve and develop VET systems, and support lifelong learning strategies and
European Qualification Framework implementation.
Figure 1.1 Reference EU and SEE targets and benchmarks
EU level Europe 2020, ET 2020
Regional level SEE 2020 Strategy
Europe 2020 headline targets
Early leavers from education
and training Below 10% Tertiary educational attainment At least
40%
ET 2020 benchmarks
Low achievers in basic skills 15% Employment rate of recentgraduates 82%
Adult participation in lifelong
learning 15%
Key strategic topics: lifelong learning; key
competences; skills acquisition; employability; innovation
2
Although other ET 2020 benchmarks and indicators are extremely relevant for skills development (e.g. employment rate of recent graduates, acquisition of foreign languages and digital skills, etc.), the extremely low level of feasibility/availability in all or most of the countries precluded their selection as common indicators.
Objectives
Decrease of early schoolleavers from education and training as percentage of population aged 18-24 Increase tertiary educational attainment as a percentage of the population aged 30–34
Dimension
D. Education & Competences
Smart Growth Pillar
Target: Add 300 000 highly qualified people to the
In addition, the tool builds on the methodological inputs and practical experience gained while running monitoring, stocktaking and review processes relating to VET in the enlargement countries:
■ Torino Process – a biennial assessment process leading to an evidence-based analysis of VET policies in all ETF partner countries, through which the overall VET system capacity is evaluated; ■ Bruges Process – a stocktaking exercise carried out every two years in the EU Member States
and candidate countries based on the Bruges Communiqué (a package of objectives and actions to increase the quality of vocational training by making it more accessible and relevant to the needs of the labour market);
■ HRD reviews – carried out by ETF in the SEET countries with a focus on education and training from a lifelong learning perspective and on their contribution to employment and social inclusion. Throughout the FRAME Initiative implementation process, on-going consultations and exchanges of information with the European Commission, the Regional Cooperation Council, the Organisation for Economic Cooperation and Development (OECD) and the World Bank were carried out with the aim of ensuring a complementary approach on monitoring and evaluation in the region. Although the contexts and final aims differ slightly (e.g. defining the monitoring framework for the SEE 2020 Strategy,
selecting indicators and developing the capacity for IPA II monitoring3), the work on the FRAME monitoring tool incorporates reference principles and indicators that are in line with EU and SEE strategic planning and follow-up processes.
3
The FRAME monitoring tool is in line with the IPA II monitoring approach. It employs a similar taxonomy of indicators (i.e. input, output, result, impact) and matches some of the IPA progress and performance indicators at sectoral level (such as educational attainments, early school leavers, employment rate and investments in active labour market policies).
SECTION 2. GENERAL CONCEPTS AND
CONDITIONS FOR A SOUND MONITORING
PROCESS
2.1 What is monitoring?
Monitoring can be defined as a continuing process that aims primarily to provide the management and main stakeholders of an on-going intervention with early indications of progress, or lack thereof, in the achievement of results.
Effective monitoring and evaluation are key components of the policy cycle, informing policy makers by means of feedback, which is essential for adjusting on-going policies and building an evidence-based institutional memory.
An effective and efficient policy cycle must address a number of questions: ■ Where are we? (accurate situation appraisal);
■ Where do we want to go? (clear formulation of objectives);
■ What are the steps needed to get there? (clear formulation of policies, strategies, and tasks; understanding of the linkages and priorities);
■ Do we have the capacity to follow the steps? (sound implementation procedures, with effective management, resource mobilisation and accounting);
■ Where do we stand in relation to the planned progress? (effective, honest and unbiased monitoring and evaluation).
The main objective of the monitoring process is to identify progress towards results. At the same time, monitoring ensures that evidence is produced to inform decision making and to support its
accountability.
Thus, a monitoring process aims to achieve the following.
Monitoring is a reiterative process, based on indicators, and is made up of the following elements: ■ identification of relevant indicators;
■ collection of baseline data to describe the situation;
■ identification of key indicators that capture the achievement of the results; ■ data collection (according to a defined time schedule);
■ analysis of the indicators to capture information on success or failure. Tracking changes from baseline conditions
to desired results, through analysis and comparison of indicators over time
Signalling problems in performance, providing input for corrective actions
In order to inform evidence-based policies in an effective way, monitoring should: ■ be continuous;
■ involve partners;
■ be focused on progress;
■ be based on the right mix of tools and expertise; ■ be based on clear criteria and indicators.
2.2 Indicators for monitoring
Strategies always refer to one or more goals that must be reached through policy interventions.
Indicators (OECD, 2002) are defined as quantitative or qualitative factors or variables that provide a simple and reliable means of measuring achievements, to reflect changes connected to an
intervention or to help assess the performance of a development actor. Indicators are aggregations of raw or processed data that help to quantify a phenomenon under study and to grasp complex realities. ■ Quantitative indicators capture objective information about the real world and are numerical
(absolute values as well as percentages).
■ Qualitative indicators instead deal with non-numerical characteristics of the object of study and may include subjective information, opinions or judgments. Qualitative evidence is typically expressed as descriptive information, although it can also be quantified and numerically expressed.
Examples of quantitative and qualitative indicators are provided in Table 2.1.
Table 2.1 Examples of quantitative and qualitative indicators
Indicators
Quantitative indicators Expenditure on primary educationNumber of primary school teachers Enrolment and dropout rates Literacy level
Qualitative indicators Adequacy of the curriculum
Quality of teaching atmosphere in the classroom Satisfaction with teaching methods
Change in perception of empowerment and poverty status
Source: UNDG, 2005
Goals are objective expressions of what is to be achieved. They are usually
non-technical and often non-quantifiable statements. Targets are individual, observable achievements directly related to a goal. Indicators are variables used to measure progress towards a target.
With regard to the effectiveness of indicators in the monitoring context, the most important characteristics are that they should:
■ provide direct and unambiguous measures of progress over time; ■ be chosen at the appropriate level of disaggregation;
■ have a direct link to interventions; ■ be relevant for policy making.
The overriding requirement is that indicators should be consistent with the data available and with the data-collection capacity.
2.3 Data quality and data sources
Indicators that fulfil all quality criteria enhance the level of reliability of a monitoring process, as well as its capacity to be used over time by different stakeholders.
Eurostat (2003) defines the quality of statistics with reference to the following six criteria. 1. Relevance: an inquiry is relevant if it meets users’ needs.
2. Accuracy: accuracy is defined as the closeness between the estimated value and the (unknown) true value.
3. Timeliness and punctuality in disseminating results: most users want up-to-date figures that are published frequently and on time at pre-established dates.
4. Accessibility and clarity of the information: statistical data have most value when they are easily accessible by users, are available in the forms users’ desire and are adequately documented. 5. Comparability: statistics for a given characteristic have the greatest usefulness when they enable
reliable comparisons to be made of values taken by the characteristic across space and time. The comparability component stresses the comparison of the same statistics between countries. 6. Coherence: when originating from a single source, statistics are coherent in that elementary
concepts can be combined reliably in more complex ways. When originating from different
sources, and in particular from statistical surveys of different frequencies, statistics are coherent in so far as they are based on common definitions, classifications and methodological standards. In addition to these criteria for data quality, a crucial role is played by data sources, given the strong link between the degree of quality of data and the reliability of their source. A reliable data source should be comprehensive in coverage, unbiased and consistent over time (ETF, 2013).
The most frequently used data sources include the following.
Administrative databases include data collected and provided by public institutions. They are created in order to monitor individuals or singular entities for fiscal, legal or other reasons and they usually possess in-depth geographical detail (e.g. public employment service database of registered unemployed; schools’ registries of pupils).
Surveys are statistical tools for collecting information and providing a description summarising the characteristics of a certain phenomenon or group of people, as in the case of the Labour Force Survey, a standard household-based survey collecting work-related statistics.
Censuses are procedures through which information about the members of a given population are systematically collected and recorded. Typical examples are population and housing censuses, but agriculture, services and industry censuses are also common.
Table 2.2 Main characteristics of data sources
Characteristic
Administrative database
Survey
Census
Inclusion criteria All events registered All sampled units All unitsCost Low Medium High
Frequency On-going 1, 3 or 5 years 10 years
Data sources can also be categorised as primary or secondary.
■ Primary sources are original documents or data providing first-hand and direct evidence (e.g. interviews with country officials).
■ Secondary sources include the information from primary sources that has been processed and interpreted. This category includes international organisations (e.g. Eurostat, World Bank, International Labour Organisation, OECD, etc.) that provide data and indicators based on information collected by individual countries, and other primary data.
When the same data are available from different sources, it is appropriate to choose the one that is most reliable, thus guaranteeing that the data is of high quality.
2.4 Benchmarking
According to the Common Assessment Framework (2012), the common European quality
management instrument for the public sector, a benchmark is a performance level that is recognised as the reference or measurement standard against which a certain situation may be compared. It might correspond to the best value an indicator assumes with respect to a certain process under consideration. Alternatively, it could be the value an indicator assumes for a certain year (baseline), which is chosen as the reference against which values for the following years are compared in order to analyse their development through time.
One of the challenges in a benchmarking exercise is the lack of comparability (i.e. data comparability). This refers to a lack of adequate procedures for ensuring standard definitions and methodologies. Benchmarking is usually seen as a starting point for mutual learning, and it plays a key role within a process of continuous improvement. ‘The aim of every benchmarking procedure is to widen the horizon, to provide a better overview of own weaknesses and strengths, to improve internal and external processes, to learn from others, to prevent re-inventing the wheel and to lead to the
identification, exchange and application of Best Practices’ (European Commission, online resource). At EU level, based on relevant strategic documents (Europe 2020; ET 2020), the Education and Training Monitor and the Employment Performance Monitor make use of the Joint Assessment Framework and support EU Member States to strengthen their evidence base and analytical capacity. A set of benchmarks for 2020 has been identified with the aim of providing standards for comparison, encouraging the exchange of information and stimulating peer learning (European Commission, 2013).The annual monitoring reports (Education and Training; Employment Performance) set out progress on the Europe 2020 and ET 2020 benchmarks and core indicators, including Europe 2020 headline targets on education and training and employment, allowing comparison across countries, and with EU averages and EU highest and lowest performers.
EU joint monitoring actions (within the framework of Europe 2020) do not aim to rank countries according to their performances. The scope of this multi-country exercise is to provide an enabling working environment to allow countries to learn from each other, and to give appropriate consideration to various starting points, legacies of the past (e.g. the different pace of economic transition from centralised to market economy) and current challenges. The foremost function of this process is to guide EU joint action and support for policy areas that are lagging behind and that are preventing Europe from gaining global competitiveness in terms of economic and social development.
SECTION 3. FRAME MONITORING TOOL
Under the foresight and review of institutional arrangements components, a Skills Vision 2020, roadmap and capacity-development plans were drafted. The participating countries highlighted the following key priority areas:
■ increased investments in education, training and labour market policies;
■ improvement in the quality of skills-development systems, including their responsiveness to labour market demands;
■ in-built anticipatory capacities for the skills systems and a strengthening of the sectoral approach to skills development;
■ promotion of entrepreneurship, including entrepreneurial learning, and innovation;
■ ensuring skills-development opportunities for all from a lifelong learning perspective, and easing transition to quality jobs;
■ promotion of socially inclusive policies in education and employment;
■ ensuring effective governance (especially the capacities for coordinated sector policy development and implementation) and local capacity building.
Building on these common priorities for all countries, the FRAME monitoring tool captures the specificity of the skills-development process both from a taxonomy perspective (from input to impact and context indicators) and in terms of the main policy areas (education and training systems; skills supply; labour market participation).
3.1 Structure of the indicators
The FRAME monitoring tool is based on a single list of indicators (quantitative and qualitative) with two dimensions:
■ national dimension: country-specific indicators – a set of indicators to track the progress towards the Skills Vision 2020, roadmap and capacity-development plan;
■ EU and regional dimension: common indicators – a selection of indicators that link up the national level with EU and regional cooperation processes (EUROPE 2020 and SEE 2020 strategies) and reflect the most relevant targets and benchmarks for skills development. Thus, the country-specific indicators are connected to each country’s priorities and measures (resulting from the foresight and review of institutional arrangements components). The reference sources for the common set of indicators are the main strategic frameworks adopted at EU and regional level and the on-going work on setting relevant indicators for country strategic papers (under the IPA II programming process). The intention is to support countries’ efforts towards full compatibility with EU requirements.
The indicators can be grouped according to the following taxonomy, according to which phase of the skills-development process they refer to:
■ input indicators, measuring investments in education, teacher training and active labour market policies (ALMPs);
■ process indicators, capturing participation in education and training from a lifelong learning perspective and the level of forward-looking content in learning processes (e.g. digital skills, foreign learning);
■ output/outcome indicators, measuring achievements and failures of education and training processes (e.g. completion rate, early school leavers);
■ impact indicators, providing information on the returns from education and training and improved skills for a knowledge-intensive economy;
■ context indicators, providing information on employment levels and other relevant indicators on demographic and economic trends.
The indicators identified can be grouped into three main policy areas as defined in the Europe 2020 Strategy and its evidence-based approach (the Joint Assessment Framework):
■ Policy area 1: Improving education and training systems (raising skills levels, acquisition of key competences, preventing early school leaving, etc.);
■ Policy area 2: Improving skills supply, productivity and lifelong learning (adaptation of skills to labour demand; training measures, etc.);
■ Policy area 3: Increasing labour market participation (employment, unemployment, labour market participation of specific groups, investments and participation in ALMPs, etc.).
The structure allows monitoring of progress towards the country’s priorities within each policy area, by means of the key indicators (K) and a set of relevant sub-indicators. Where applicable, the indicators should be disaggregated by sex and age.
3.1.1 Common list of indicators for monitoring
The list of common indicators contains key evidence stemming from the Europe 2020 and SEE 2020 strategic frameworks that are relevant for the skills-development process. These indicators reflect the EU and regional dimension of the monitoring tool.
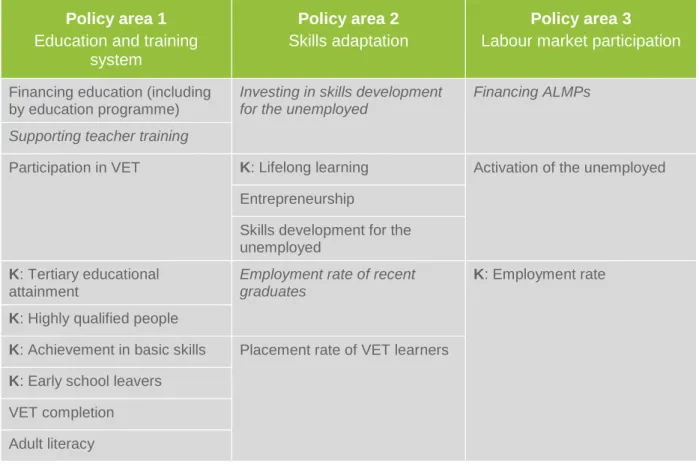
The indicators shown in italics in Table 3.1 were initially proposed as common set of indicators. They were removed following feasibility checks owing to their very low availability and comparability across SEET countries. Most of them come from national administrative registries (e.g. investments in education by programme and ALMPs; the participation of teachers and unemployed in further training; completion rates of VET learners, etc.). The indicator on the employment of recent graduates
(ET 2020 benchmark) requires methodological adaptations of Labour Force Surveys in the SEET countries (except the former Yugoslav Republic of Macedonia and Turkey).
Further work and support is needed in the region to exploit available evidence (e.g. to calculate additional indicators) and to adjust current methodological instruments (especially Labour Force Surveys). The administrative databases (national registers) should be interconnected and improved in terms of quality, transparency and availability. SEET countries (with EU support) should take decisive steps towards improved availability of evidence on key HRD indicators.
Table 3.1 Structure of the common list of indicators by policy area
Policy area 1
Education and training
system
Policy area 2
Skills adaptation
Policy area 3
Labour market participation
Financing education (including by education programme)
Investing in skills development for the unemployed
Financing ALMPs
Supporting teacher training
Participation in VET K: Lifelong learning Activation of the unemployed Entrepreneurship
Skills development for the unemployed
K: Tertiary educational attainment
Employment rate of recent graduates
K: Employment rate K: Highly qualified people
K: Achievement in basic skills Placement rate of VET learners K: Early school leavers
VET completion Adult literacy K – Key indicator
The social inclusion dimension of education and training can be summarised as the goal to achieve accessible, attractive and inclusive education and training systems and schools that provide
environments that allow individuals to acquire knowledge, skills and competences for employment and life. Social inclusiveness is reflected in the list of common indicators by the use of key evidence on achievement in basic skills, adult literacy, early school leaving and lifelong learning. Additional country-specific indicators reflect the countries’ efforts to make education and training systems more inclusive and improve the labour market participation of vulnerable groups through skills development (e.g. reducing gender and ethnic disparities in education and labour market participation; enabling individuals with a disability to take full advantage of skills development and job opportunities, etc.).
3.1.2 National list of indicators for monitoring
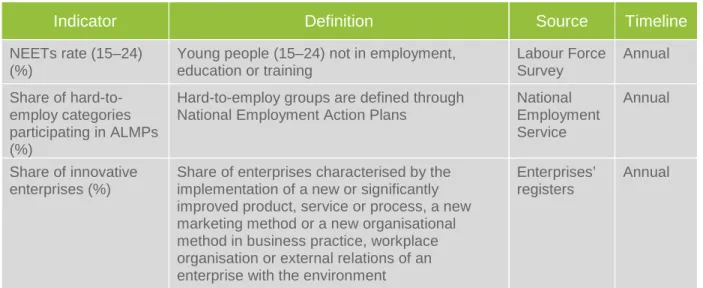
Given the diversity of countries’ priorities, as set out in the national Skills Vision 2020 and roadmaps, the country-specific group of indicators reflects particular policy priorities. Country-specific indicators focus on such areas as the development of education and training; active labour market measures; inclusive learning arrangements; education and training returns; and labour market performance. Table 3.2 describes a number of country-specific HRD indicators.
Table 3.2 Examples of national indicators
Indicator
Definition
Source
Timeline
NEETs rate (15–24) (%)
Young people (15–24) not in employment, education or training Labour Force Survey Annual Share of hard-to-employ categories participating in ALMPs (%)
Hard-to-employ groups are defined through National Employment Action Plans
National Employment Service Annual Share of innovative enterprises (%)
Share of enterprises characterised by the implementation of a new or significantly improved product, service or process, a new marketing method or a new organisational method in business practice, workplace organisation or external relations of an enterprise with the environment
Enterprises’ registers
Annual
3.2 Qualitative evidence-based monitoring
Under the review of institutional arrangements component, the FRAME Initiative addresses countries’ institutional capacities to pursue and deliver their commitments for Skills Vision 2020. Common issues in countries’ capacity-development plans include the quality of education and training, skills
anticipation and labour market responsiveness (e.g. work-based learning), further development of national qualification frameworks, effective governance (especially cooperation among stakeholders) at national level and capacity building at regional and local level .
This section complements the quantitative monitoring approach (captured in the previous sections and based on the set of indicators) and provides methodological guidance and concrete examples on how to monitor progress in policy and institutional development. It should be noted that a higher level of complexity and more resources are used for a qualitative monitoring process that is focused on capacities to design and deliver skills policies. However, a qualitative approach to tracking progress is appropriate as it offers a comprehensive view of the extent to which a sector/policy field is developed, the key bottlenecks, and the key steps required to improve policy making and to move forward. Qualitative information complements the purely quantitative data and offers insights on the policy fields under analysis.
At international and EU level, several initiatives are in place or under development for using qualitative information in tracking progress towards policy goals. The Europe 2020 Strategy, the Education and Training 2020 Strategic Framework and the SEE 2020 Strategy monitoring comprise qualitative components. Given the short time between the finalisation of capacity-development plans in the review of institutional arrangements and the current drafting of methodological guidelines, the issue of qualitative evidence needs further work at national and regional level. This could be addressed in a follow-up project to the FRAME Initiative.
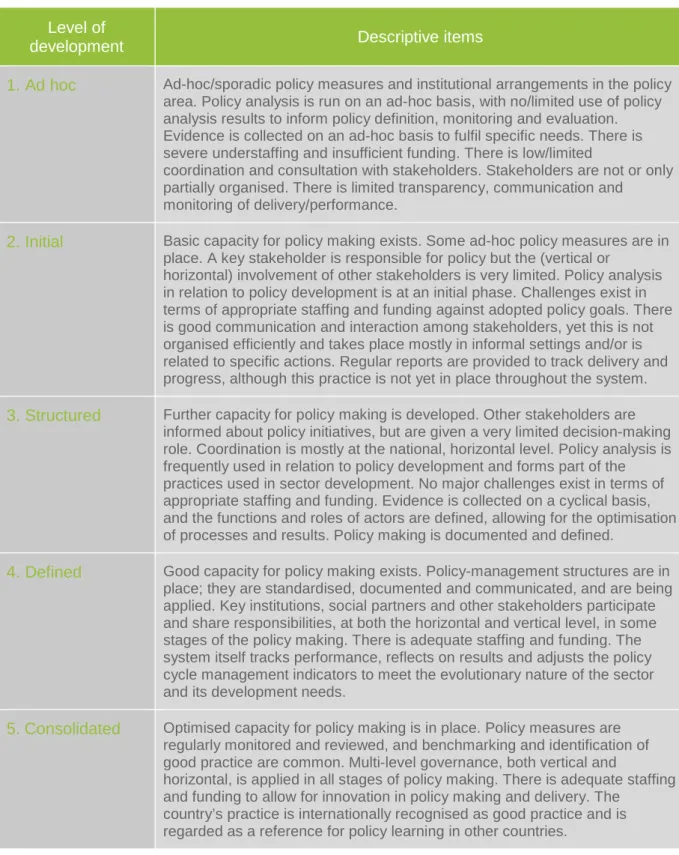
A methodological approach to tracking and monitoring progress in terms of capabilities for policy making is exemplified in Table 3.3. It builds on international and regional experience, the outcomes of the review of institutional arrangements, and ETF work. The core part of this methodology is a five-level assessment matrix that enables decision makers to track progress. The lowest five-level reflects the
need for sustained implementation of reform, while the highest level indicates consolidated policy making4.
Table 3.3 ETF assessment framework
Level of
development
Descriptive items
1. Ad hoc
Ad-hoc/sporadic policy measures and institutional arrangements in the policy area. Policy analysis is run on an ad-hoc basis, with no/limited use of policy analysis results to inform policy definition, monitoring and evaluation. Evidence is collected on an ad-hoc basis to fulfil specific needs. There is severe understaffing and insufficient funding. There is low/limitedcoordination and consultation with stakeholders. Stakeholders are not or only partially organised. There is limited transparency, communication and monitoring of delivery/performance.
2. Initial
Basic capacity for policy making exists. Some ad-hoc policy measures are in place. A key stakeholder is responsible for policy but the (vertical orhorizontal) involvement of other stakeholders is very limited. Policy analysis in relation to policy development is at an initial phase. Challenges exist in terms of appropriate staffing and funding against adopted policy goals. There is good communication and interaction among stakeholders, yet this is not organised efficiently and takes place mostly in informal settings and/or is related to specific actions. Regular reports are provided to track delivery and progress, although this practice is not yet in place throughout the system.
3. Structured
Further capacity for policy making is developed. Other stakeholders are informed about policy initiatives, but are given a very limited decision-making role. Coordination is mostly at the national, horizontal level. Policy analysis is frequently used in relation to policy development and forms part of the practices used in sector development. No major challenges exist in terms of appropriate staffing and funding. Evidence is collected on a cyclical basis, and the functions and roles of actors are defined, allowing for the optimisation of processes and results. Policy making is documented and defined.4. Defined
Good capacity for policy making exists. Policy-management structures are in place; they are standardised, documented and communicated, and are being applied. Key institutions, social partners and other stakeholders participate and share responsibilities, at both the horizontal and vertical level, in some stages of the policy making. There is adequate staffing and funding. The system itself tracks performance, reflects on results and adjusts the policy cycle management indicators to meet the evolutionary nature of the sector and its development needs.5.
Consolidated
Optimised capacity for policy making is in place. Policy measures are regularly monitored and reviewed, and benchmarking and identification of good practice are common. Multi-level governance, both vertical andhorizontal, is applied in all stages of policy making. There is adequate staffing and funding to allow for innovation in policy making and delivery. The
country’s practice is internationally recognised as good practice and is regarded as a reference for policy learning in other countries.
The descriptive items must be adapted and refined depending on the specific policy area selected for progress assessment.
4
Complete cycle: from agenda setting, policy formulation/planning and resource allocation, policy implementation/delivery to policy monitoring, evaluation and revision.
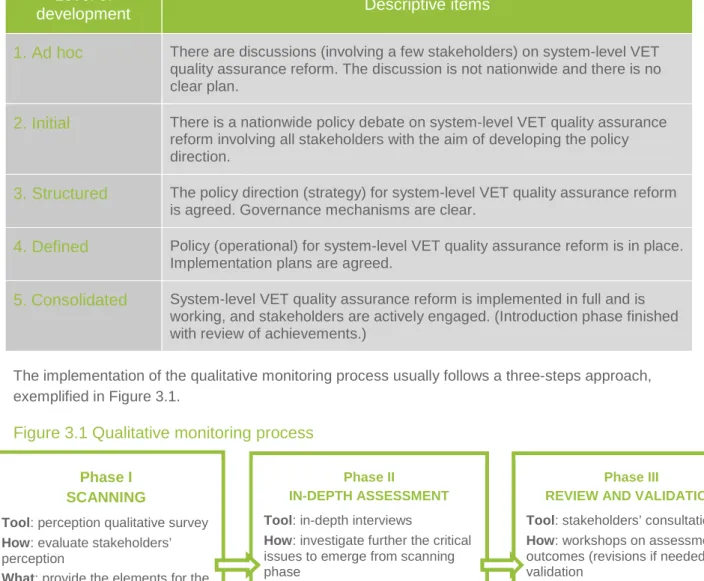
Table 3.4 provides an example of how the five-level matrix can be applied to the policy area of VET quality assurance, with a focus on the reforms in the field as a key item for assessing the progresses in VET development.
Table 3.4 Example of assessment matrix on VET quality assurance
Level of
development
Descriptive items
1. Ad hoc
There are discussions (involving a few stakeholders) on system-level VET quality assurance reform. The discussion is not nationwide and there is no clear plan.2. Initial
There is a nationwide policy debate on system-level VET quality assurance reform involving all stakeholders with the aim of developing the policy direction.3. Structured
The policy direction (strategy) for system-level VET quality assurance reform is agreed. Governance mechanisms are clear.4. Defined
Policy (operational) for system-level VET quality assurance reform is in place. Implementation plans are agreed.5.
Consolidated
System-level VET quality assurance reform is implemented in full and is working, and stakeholders are actively engaged. (Introduction phase finished with review of achievements.)The implementation of the qualitative monitoring process usually follows a three-steps approach, exemplified in Figure 3.1.
Figure 3.1 Qualitative monitoring process
Such a process of assessment should be properly steered during the implementation phase. Some of the most challenging aspects refer to the availability of resources to carry out the complex process of scanning, interviewing, making adjustments and validating the results. Numerous stakeholders should be consulted when the target area is the HRD sector. There is also a need to allow enough time for the implementation and consolidation of reforms. This enables the changes in a policy area to be properly captured and allows new ranking (in terms of development levels) to be carried out. The same methodology of qualitative monitoring should be employed to guarantee the collection of reliable evidence on progress over years.
Phase I SCANNING
Tool: perception qualitative survey How: evaluate stakeholders’
perception
What: provide the elements for the
first or general assessment
Phase II
IN-DEPTH ASSESSMENT
Tool: in-depth interviews
How: investigate further the critical
issues to emerge from scanning phase
What: provide information on
critical areas where improvements are needed
Phase III
REVIEW AND VALIDATION
Tool: stakeholders’ consultation How: workshops on assessment
outcomes (revisions if needed) and validation
What: results of scanning and
in-depth assessment are reviewed and validated; a level of development is selected
3.3. Monitoring process: main phases and contribution to policy
development
Once the full list of indicators and data sources has been identified, the different phases of the monitoring process should be planned, starting from data and information collection to the reporting and use of the resulting evidence to support policy cycles.
A monitoring plan should be defined and agreed by the institutions and stakeholders who took part in the development of the Skills Vision 2020. The plan should contain clear references to the indicators and other qualitative items (e.g. legislative actions) that are the subject of monitoring, as set out in countries’ roadmaps and capacity-development plans; the institution that is leading the monitoring and reporting process; the data and information sources; and the timing of the monitoring process.
Figure 3.2 Items to be specified in the monitoring plan
What needs to be monitored
(objective of the monitoring plan: expected outcome and indicators)
By whom and with whom
(roles and responsibilities)
When
(schedule of activities)
How
(means of verification/ source of information)
How monitoring data will be used
(use of results in the policy cycle)
Monitoring plan
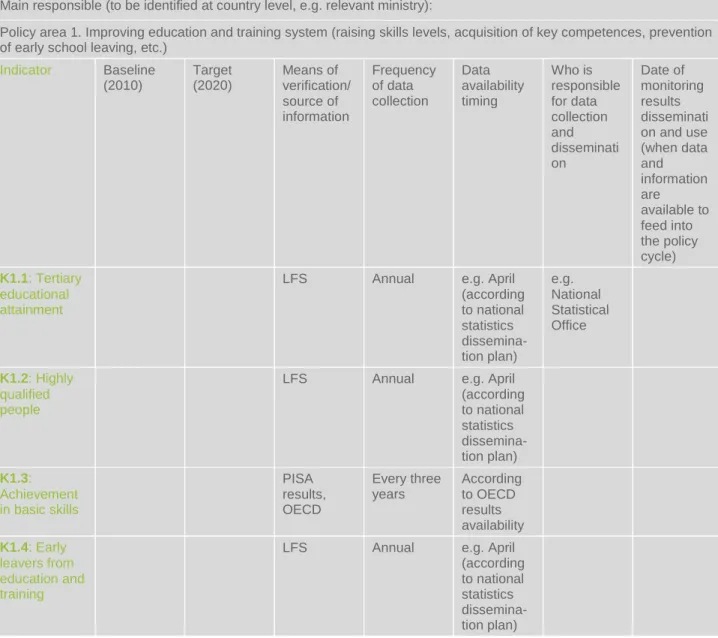
Table 3.5 Monitoring plan structure (example)
Policy area 1. Education and training systems
Main responsible (to be identified at country level, e.g. relevant ministry):Policy area 1. Improving education and training system (raising skills levels, acquisition of key competences, prevention of early school leaving, etc.)
Indicator Baseline (2010) Target (2020) Means of verification/ source of information Frequency of data collection Data availability timing Who is responsible for data collection and disseminati on Date of monitoring results disseminati on and use (when data and information are available to feed into the policy cycle) K1.1: Tertiary educational attainment
LFS Annual e.g. April (according to national statistics dissemina-tion plan) e.g. National Statistical Office K1.2: Highly qualified people
LFS Annual e.g. April (according to national statistics dissemina-tion plan) K1.3: Achievement in basic skills PISA results, OECD Every three years According to OECD results availability K1.4: Early leavers from education and training
LFS Annual e.g. April (according to national statistics dissemina-tion plan)
3.3.1 Visual tools for monitoring
Building on EU tools for progress monitoring, this section provides technical advice on how to use graphical tools to allow policy makers a swift visualisation of trends and progress towards targets from a national perspective, coupled with references to regional/EU targets or benchmarks.
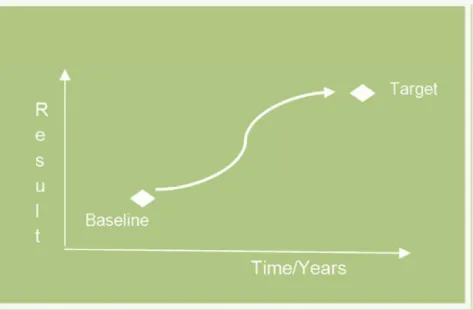
Figure 3.3 Progress towards results
Explanatory notes:
■ National, regional and average EU data refer to baseline year (2010) and provide information on the starting point/level.
■ The expected trajectory of the selected indicator towards the target (for 2020 or another
timeframe) should be set by using information on past trends and expected progress. Deviations from the expected trajectory signal the need to re-adjust policies (e.g. increase or make more efficient investments; eliminate eventual bottlenecks). Where major disruptions occur (e.g. economic shocks, changes/break in data from a methodological perspective), policy makers should revise the targets.
■ Use regional and EU trends and targets for comparing performance and trends over time. ■ The eventual gap between the real data and committed targets at the end of the implementation
period mirrors the effects of policies and other factors (e.g. demographic changes; economic dynamics, etc.)5.
An illustrative example for this approach is the EU Education and Training Monitor report and its online visualisation tool6. Its objective is to support the evaluation of the performance and progress of EU Member States in relation to the Europe 2020 and ET 2020 targets and benchmarks.
5
In order to distinguish between the different effects (e.g. policies and contextual factors), a more complex methodology should be applied (e.g. Principal Component Analysis/Discriminant Analysis of the different factors).
6
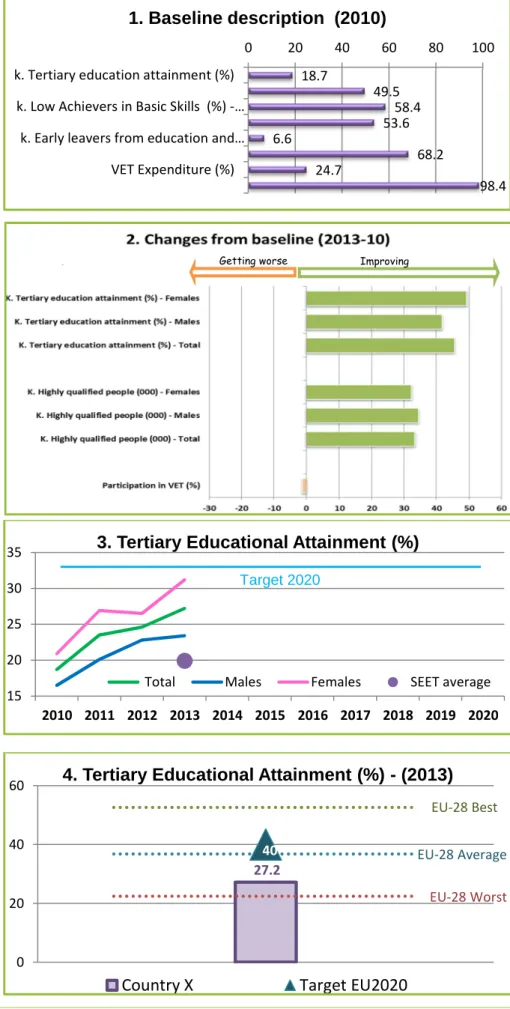
Figure 3.4 Graphical tools for progress analysis at national level, including regional and
EU benchmarking
1. Analyse the baseline situation
The starting point of the monitoring process is the description of the initial situation, displaying the current state of the indicators selected for a particular policy area.
2. Changes from baseline
This step can be
summarised by the following question: What happened in the meantime? By
calculating changes from baseline, this graph shows positive or negative trends. In addition, by focusing on unique information
visualisation items (i.e. the ‘change’), a comprehensive analysis of very detailed indicators and an in-depth look at country level are possible.
3. Trends and regional benchmarking
A time-series graph shows an indicator trend towards a national target, allowing at the same time benchmarking at regional level. It answers the following questions: Are we going in the right direction? How are we performing in comparison to the region as a whole?
4. EU benchmarking
When the indicators have an EU relevance (e.g. the key indicators in the FRAME common list), countries could check what is happening at EU level, in order to identify possible areas for improvement, but also to learn from EU Member States’ successes or failures and to prepare for future demands as EU Members. 18.7 49.5 58.4 53.6 6.6 68.2 24.7 98.4 0 20 40 60 80 100
k. Tertiary education attainment (%) k. Low Achievers in Basic Skills (%) -…
k. Early leavers from education and… VET Expenditure (%)
1. Baseline description (2010)
15 20 25 30 35 2010 2011 2012 2013 2014 2015 2016 2017 2018 2019 20203. Tertiary Educational Attainment (%)
Total Males Females SEET average
27.2 40 EU-28 Average EU-28 Best EU-28 Worst 0 20 40
60
4. Tertiary Educational Attainment (%) - (2013)
Country X
Target EU2020
Target 2020
3.3.2 Monitoring for policy development
Monitoring activities should take place on a regular basis (e.g. annually) and be designed in such way as to provide a solid contribution to policy development, including adjustments if needed. The
monitoring calendar should set out the main milestones of the monitoring activity as a continuous process that can be replicated over a number of years. It also should be compatible with (i) data availability; and (ii) the national policy and budget-planning schedule. Survey data for the previous year are usually released in May or June, while policy and budget planning for the following year are typically finalised by September.
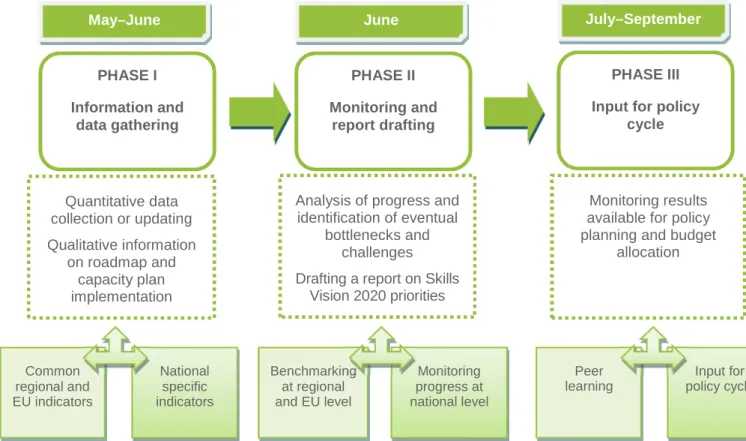
Figure 3.5 describes the timing and the content of each phase, featuring two dimensions, national and EU/regional.
Figure 3.5 Proposed outline of the monitoring activities and calendar
The first phase – the single set of national, regional and EU indicators (common and
country-specific) – represents a single step of gathering HRD data and information with national, regional and EU relevance. This facilitates the regional and EU referencing process on main indicators.
The second phase focuses on the progress report and analysis. The (administrative) stocktaking exercise on the implementation of roadmap measures should be complemented by a robust analysis of progress achieved in the key areas of the skills-development process: (i) education and training systems; (ii) skills supply and lifelong learning; and (iii) labour market participation. The visual monitoring tools should be used (as described in Section 3.3.1).
It should be possible to identify the policy areas that are showing slow or no progress (including those in which trends are worsening), and policy makers must take action. Corrective measures should be sought and adopted (see Figure 3.5, Phase III). The embedding of regional- and EU-relevant
indicators in the evidence gathering ensures that there is a natural linkage between national progress and benchmarking at regional and EU levels.
May–June PHASE I Information and data gathering Quantitative data collection or updating Qualitative information on roadmap and capacity plan implementation Common regional and EU indicators National specific indicators June PHASE II Monitoring and report drafting
Analysis of progress and identification of eventual
bottlenecks and challenges Drafting a report on Skills
Vision 2020 priorities Benchmarking at regional and EU level Monitoring progress at national level July–September PHASE III Input for policy
cycle
Monitoring results available for policy planning and budget
allocation
Peer learning
Input for policy cycle
The third phase is crucial. It reveals whether a monitoring process is managed as a purely
administrative/bureaucratic action or whether it is a solid component of the policy cycle. The outcomes of the progress analysis should be used in policy planning, including budget allocation. All priority areas for which there has been no progress, or where there are worsening trends, should be
addressed through resource allocation, improved implementation, the elimination of bottlenecks, etc. The two dimensions of the evidence-gathering and analysis processes (phases I and II) facilitate a more tailored approach to peer learning at regional level. Joint referencing (against regional and EU benchmarks) enables countries to identify common challenges and to pursue a dialogue on possible solutions, including joint actions.
In essence, monitoring is about the systematic collection of data to assess how well the policies are implemented. This allows corrective actions to be adopted and the implementation of committed priorities to be checked. It is not about ‘naming and shaming’ one or another. Carried out in a comprehensive and relevant manner (e.g. keep an eye on policy impact; inter-sectoral influences), a proper monitoring process supports continuous improvement and innovation in policy development and implementation.
Other key requirements include keeping the monitoring process fair and transparent. Achieving policy goals on human capital development is not an easy task. Education and training, coupled with employment and social inclusion, is one of the most challenging policy areas for all enlargement countries and for the world in general. Investments and reforms in education and training take years to yield results. Employment growth is heavily conditioned by economic dynamics and restructuring processes. However, precious opportunities for improvement are lost as a result of limited funding allocations (in spite of stated priorities), understaffing of delivery organisations, a lack of cooperation among key stakeholders, overcentralisation of policy making, and inefficient monitoring arrangements.
ANNEXES
Annex 1. Reference indicators for EU and regional benchmarking
Part I. Europe 2020 and Education and Training 2020 indicators
Indicator
Definition
Europe 2020 headline targets
Early leavers from education and training
Europe 2020 headline target: less than 10%
Proportion of the population aged 18–24 years with at most lower secondary education and who are not in further education or training
Tertiary educational attainment Europe 2020 headline target: at least 40%
Proportion of the population aged 30–34 years having successfully completed university or university-like education (ISCED 5 or 6)
Employment rate for 20–64 age group Europe 2020 headline target: at least 75%
The number of persons aged 20-64 in employment as a share of the total population of the same age group
ET 2020 benchmarks
Early childhood education and care ET 2020 target: 95%
Proportion of the population from the age of 4 to compulsory school age who are participating in early education
Low achievers in basic skills ET 2020 target: 15%
The share of 15-years-olds failing to reach level 2 in reading, mathematics and science
Learning mobility Leonardo da Vinci outbound (IVET) Erasmus inbound (higher education) Employment rate of recent graduates
ET 2020 target: 82%
The share of employed people aged 20–34 having successfully completed upper secondary or tertiary
education 1–3 years before the reference year of the survey and who are no longer in education or training
Adult participation in lifelong learning ET 2020 target: 15%
The share of the population aged 25–64 who stated that they received formal or non-formal education or training in the 4 weeks preceding the survey
Proposed ET 2020 benchmark
Foreign language skills ISCED 2 students at proficiency level B1 or higher in first foreign language
ISCED 2 students learning a second foreign language
Other ET 2020 indicators
Investment in education and training General government expenditure on education (% of GDP) Expenditure on educational institutions per student in EUR PPS (purchasing power standard)
Digital competences Pupils in grade 4 (ISCED 1) using computers at school Individuals aged 16–74 with high computer skills Entrepreneurial competences Individuals aged 18–64 who are believed to have the
required skills and knowledge to start a business Vocational education and training Share of vocational students at ISCED 3
Skills for future labour markets Projected change in employment 2010–20
Adult skills Low achievers in basic skills: literacy, numeracy, problem solving
Part II. SEE 2020 indicators
Smart Growth Pillar
Target: add 300 000 highly qualified people to the workforceEducation and competences dimension (K)
Objectives:
■ reduce the number of early leavers from education and training as a percentage of the population aged 18–24
■ increase the tertiary educational attainment as a percentage of the population aged 30–34 Measures:
■ introduce policies to increase equitable access to, and participation in, high-quality education at all levels
■ implement measures to prevent early school leaving and drop-out and improve completion rates at all levels
■ standardise qualifications and remove obstacles to their recognition ■ ensure education better meets economic and labour market needs
■ entrepreneurship key competence development at all levels of education and training
Inclusive Growth Pillar
Target: increase the overall employment rate, as a percentage of the 15+ population, from 39.5% to 44.4%
Part III. EQARF indicators
Indicator
Definition
1. Relevance of quality assurance systems for VET providers
Share of providers applying internal quality assurance systems defined by law/at own initiative
Percentage of VET providers showing evidence of applying the EQARF principles within a defined quality assurance system, where the number of registered VET providers=100% Share of accredited VET providers Percentage of VET providers who are accredited, where the
number of registered VET providers=100%
2. Investment in training of teachers and trainers
Share of teachers and trainers participating in further training
Percentage of teachers and trainers participating in accredited in-service training programmes, from the total number of registered teachers and trainers
Amount of funds invested Total amount of funds annually invested per teacher and trainer in teachers’ and trainers’ further education and training
3. Participation rate in VET programmes
Number of participants in VET programmes, according to the type of programme and the individual criteria
Percentage of annual cohort completing lower secondary school/compulsory education participating in IVET programmes at upper secondary level (which lead to a formal qualification) Percentage of active population (15–74 years old) entering continuing education and training (CVET) programmes (which lead to recognition)
4. Completion rate in VET programmes
Number of successfully completed/abandoned VET programmes, according to the type of programme and the individual criteria
Percentage of those completing (i.e. attaining a formal qualification) IVET programme(s) (which lead to a formal qualification), compared to those entering IVET programme(s) Percentage of those completing (i.e. attaining a formal
qualification) CVET programme(s) (which lead to recognition), compared to those entering CVET programme(s)
Indicator
Definition
5. Placement rate in VET programmesDestination of VET learners at designated point in time after completion of training, according to the type of programme and the individual criteria
Proportion of VET programme completers who are placed in the labour market, further education or training (including university) or other destination within 12–36 months after the end of programme
Share of employed learners at designated point in time after completion of training, according to the type of programme and the individual criteria
Percentage of VET programme completers who are employed one year after the end of training
6. Utilisation of acquired skills in the workplace
Information on occupation obtained by individuals after completion of training, according to type of training and individual criteria
Percentage of VET programme completers working in relevant occupations
Satisfaction rate of individuals and employers with acquired
skills/competences
Percentage of employees of a given sector who, within a period of 12–36 months of completing the VET programme, find that their training is relevant for their current occupation
Percentage of employers of a given sector who are satisfied to find VET programme completers with relevant qualifications and competences required for the work place
Percentage of employers of a given sector who are satisfied with programme completers
7. Unemployment rate according to individual criteria
Unemployment rate The number of people unemployed as a percentage of the labour force; the labour force is the total number of people employed plus unemployed
8. Prevalence of vulnerable groups
Percentage of participants in VET classified as disadvantaged groups (in a defined region or catchment area) according to age and gender
Percentage of participants and of programme completers from disadvantaged groups, defined at European and national level, from the total number of participants and VET programme completers
Success rate of disadvantaged groups according to age and gender
Percentage of programme completers from disadvantaged groups, defined at European and national level, compared to the number of those entering
9. Mechanisms to identify training needs in the labour market
Information on mechanisms set up to identify changing demands at different levels
Type of mechanisms used to update the VET offer to the future labour market needs
Evidence of their effectiveness Information on mechanisms used to provide stakeholders with the most recent information on the future needs of the labour market
10. Schemes used to promote better access to VET
Information on existing schemes at different levels
Type of schemes used to improve access to VET
Evidence of their effectiveness Information demonstrating the capacity of the VET system to increase access to VET
Annex 2. Common indicators – Definitions
Indicator
Definition
Policy area 1. Improving education and training systems
K: Tertiary educational attainment (LFS)
Proportion of population aged 30–34 years having successfully completed university or university-like education (ISCED 5 or 6) (EU 2020 headline target: 40%)
K: Highly qualified people (LFS) Number of highly qualified people in the workforce
(SEE 2020 headline regional target: +300 000 highly qualified persons)
K: Achievement in basic skills (PISA results, OECD)
The share of 15-years-olds failing to reach Level 2 in reading, mathematics and science as measured by OECD’s PISA (ET 2020 target: <15%)
K: Early leavers from education and training (LFS)
Proportion of the population aged 18–24 years with at most lower secondary education and who are not in further education or training
(EU 2020 headline target: <10%) Financing education (national
accounts)
Public expenditure on education as a percentage of GDP
Participation in VET (education statistics)
Number of students in VET as percentage of total enrolment in upper secondary education (ISCED 3)
Adult literacy (education statistics) Proportion of adult (10+) population able to read and write a simple text in the national language
Policy area 2. Improving skills supply and productivity and lifelong learning
K: Lifelong learning (LFS) The share of the population aged 25–64 who stated that they received formal or non-formal education or training in the 4 weeks preceding the survey
(ET 2020 target: 15%) Entrepreneurship (Small Business
Act, OECD)
Training needs analysis
University–enterprise cooperation Training for women’s entrepreneurship Access to training
Placement rate of VET learners (LFS)
Share of employed who attended a VET programme in total employment
Policy area 3. Increasing labour market participation
K: Employment rate (LFS) Employment rate (20–64): the number of persons aged 20-64 in employment as a share of the total population of the same age group
(EU 2020 headline target: 75%)
Overall employment rate (15+): the number of persons aged 15+ in employment as a share of the total population of the same age group
(SEE 2020 headline regional target: 44.4%) K – key indicator
LIST OF ABBREVIATIONS
ALMP active labour market policyCVET continuing vocational education and training
EQARF European Quality Assurance Reference Framework for Vocational Education and Training
ET 2020 European Cooperation in Education and Training Strategy ETF European Training Foundation
Europe 2020 EU Growth Strategy
HRD human resources development
IPA Instrument for Pre-Accession Assistance IVET initial vocational education and training
LFS Labour Force Survey
NES National Employment Service NTTs national technical teams
OECD Organisation for Economic Cooperation and Development PISA Programme for International Students Assessment (OECD) SEET South Eastern Europe and Turkey
GLOSSARY
Administrativedata
The set of units and data derived from an administrative source. (Eurostat).
Administrative source
The register of units and data associated with an administrative regulation (or group of regulations), viewed as a source of statistical data. (OECD)
Baseline data Data that describe the situation to be addressed by a programme or project and that serve as the starting point for measuring the performance of that
programme or project. A baseline study would be the analysis describing the situation prior to receiving assistance. This is used to determine the results and accomplishments of an activity and serves as an important reference for evaluation. (UNDP)
Benchmark The reference point or standard against which progress or achievements may be compared, e.g., what has been achieved in the past, what other comparable organisations such as development partners are achieving, what was targeted or budgeted for, what could reasonably have been achieved under the
circumstances. It also refers to an intermediate target to measure progress in a given period. (UNDP)
Benchmarking Comparing data, metadata or processes against a recognised standard. (SDMX – Statistical Data and Metadata eXchange)
Data Characteristics or information, usually numerical, that are collected through observation. Data are typically the results of measurements and can be visualised using graphs or images. (Eurostat)
Indicator A quantitative or qualitative factor or variable providing a simple and reliable means to measure achievements, to reflect changes connected to an intervention or to help assess the performance of a development actor. Indicators are aggregations of raw or processed data helping to quantify a phenomenon under study and to grasp complex realities. (OECD)
Monitoring A continuing function that aims primarily to provide managers and main stakeholders with regular feedback and early indications of progress or lack thereof in the achievement of intended results. Monitoring tracks the actual performance or situation against what was planned or expected according to pre-determined standards. Monitoring generally involves collecting and analysing data on implementation processes, strategies and results, and recommending corrective measures. (UNDP)
Figure

Outline
Related documents
Outcomes of laparoscopic radical nephrectomy in the setting of vena caval and renal vein thrombus: seven-year experience. Sundaram CP, Rehman J, Landman J, Oh J: Hand
Materials and Methods: The specificity of the assay was tested using reference strains of vancomycin-resistant and susceptible enterococci.. In total, 193
9) Insert the microcontroller into the socket, ensuring pin1 faces the resistors.. revolution © copyright 2002-10 - AXE105 Electronic Dice Project Notes Version 2.0 26.
3.5 Preference of Finishing Technique Used for Making Table Mats and Runners. Mats and runners finished with
90 Eglinton Avenue West, Toronto, Pilot Insurance – 6 Storey Office Building 8688 Woodbine Avenue, Trimark, Markham – Industrial. 1315 Bough Beeches Boulevard, Toronto – 20
Along with the oral tradition, Karnad assimilates the Western classical tradition of drama and modern forms and trends to exploit his resources.. Indian gods
Consequently, it will not be permissible for the Bank to execute the Murabahah transaction on the same item with the customer, who was actually agent of bank but due to
