Validation, comparison, and combination of algorithms for automatic detection
of pulmonary nodules in computed tomography images: the LUNA16 challenge
Arnaud Arindra Adiyoso Setioa,1, Alberto Traversoa,g,h,1, Thomas de Beln, Moira S.N. Berensm, Cas van den Bogaardn, Piergiorgio Cerelloh, Hao Chenl, Qi Doul, Maria Evelina Fantaccik,i, Bram Geurtsb,
Robbert van der Gugtenm, Pheng Ann Hengl, Bart Jansene,f, Michael M.J. de Kastem, Valentin Kotovn, Jack Yu-Hung Linj, Jeroen T.M.C. Mandersm, Alexander S´o˜nora Menganad,e,f, Juan Carlos Garc´ıa Naranjod,
Mathias Prokopa, Marco Salettah, Cornelia M Schaefer-Prokopa,c, Ernst T. Scholtena, Luuk Scholtenn, Miranda M. Snoerenb, Ernesto Lopez Torresh, Jef Vandemeulebrouckee,f, Nicole Walasekn, Guido C.A. Zuidhofm,
Bram van Ginnekena,o, Colin Jacobsa
aDiagnostic Image Analysis Group, Radboud University Medical Center, Nijmegen, The Netherlands bDepartment of Radiology and Nuclear Medicine, Radboud University Medical Center, Nijmegen, The Netherlands
cDepartment of Radiology, Meander Medisch Centrum, Amersfoort, The Netherlands dCentro de Biof´ısica M´edica, Universidad de Oriente, Santiago de Cuba, Cuba eDepartment of Electronics and Informatics, Vrije Universiteit Brussel, Brussel, Belgium
fiMinds, Zwijnaarde, Belgium
gDepartment of Applied Science and Technology, Polytechnic University of Turin, Turin, Italy hTurin Section of Istituto Nazionale di Fisica Nucleare, Turin, Italy
iPisa Section of Istituto Nazionale di Fisica Nucleare, Pisa, Italy jYan’an Xi Lu 129, 9th floor, Shanghai, China kDepartment of Physics, University of Pisa, Pisa, Italy
lDepartment of Computer Science and Engineering, The Chinese University of Hong Kong, China mRadboud University, Nijmegen, The Netherlands
nInstitute for Computing and Information Sciences, Radboud University Nijmegen, Nijmegen, The Netherlands oFraunhofer MEVIS, Bremen, Germany
Abstract
Automatic detection of pulmonary nodules in thoracic computed tomography (CT) scans has been an active area of research for the last two decades. However, there have only been few studies that provide a comparative performance evaluation of different systems on a common database. We have therefore set up the LUNA16 challenge, an objec-tive evaluation framework for automatic nodule detection algorithms using the largest publicly available reference database, the LIDC-IDRI database. In LUNA16, participants develop their algorithm and upload their predictions on 888 CT scans in one of the two tracks: 1) the complete nodule detection track where a complete CAD system should be developed, or 2) the false positive reduction track where a provided set of nodule candidates should be classified. This paper describes the setup of LUNA16 and presents the results of the challenge so far. The impact of combining individual systems on detection performance is investigated. It is observed that the leading solutions employ con-volutional networks and use the provided set of nodule candidates. The combination of these solutions achieves an excellent sensitivity of over 95% at fewer than 1.0 false positive per scan. Our observer study with four radiologists has shown that the best system detects nodules that have been missed by expert readers who originally annotated the LIDC-IDRI data. We release this set of additional nodules as an update to the LIDC-IDRI reference standard. Keywords: pulmonary nodules, computed tomography, computer-aided detection, deep learning, challenges
1. Introduction
Lung cancer is the deadliest cancer worldwide, accounting for approximately 27% of cancer-related
1These authors contributed equally to this work
deaths in the United States (American Cancer Soci-ety (2016)). The NLST trial showed that three annual screening rounds of high-risk subjects using low-dose computed tomography (CT) reduced lung cancer mor-tality after 7 years by 20% in comparison to
screen-ing with chest radiography (Aberle et al.(2011)). As a result of this trial and subsequent modeling studies, lung cancer screening programs using low-dose CT are currently being implemented in the U.S. and will likely be followed by other countries. One of the major chal-lenges arising from the implementation of these screen-ing programs is the enormous amount of CT images that must be analyzed by radiologists.
In the last two decades, researchers have been devel-oping Computer-Aided-Detection (CAD) systems for automatic detection of pulmonary nodules. CAD sys-tems are designed to make the interpretation of CT im-ages faster and more accurate, hereby improving the cost-effectiveness of the screening program. The typi-cal setup of a CAD system consists of: 1) preprocess-ing, 2) nodule candidate detection, and 3) false positive reduction. Preprocessing is typically used to standard-ize the data, restrict the search space for nodules to the lungs, and reduce noise and image artifacts. The can-didate detection stage aims to detect nodule cancan-didates at a very high sensitivity, which typically comes with many false positives. Subsequently, the false positive reduction stage reduces the number of false positives among the candidates and generates the final set of CAD marks.
Although a large number of CAD systems have been proposed (Bergtholdt et al.(2016);Torres et al.(2015);
van Ginneken et al.(2015);Brown et al.(2014);Jacobs et al.(2014);Choi and Choi(2013);Tan et al.(2013);
Teramoto and Fujita(2013);Cascio et al.(2012);Guo and Li (2012); Camarlinghi et al. (2011); Tan et al.
(2011); Riccardi et al. (2011); Messay et al. (2010);
Golosio et al.(2009);Murphy et al.(2009)), there have only been few studies providing an objective compar-ative evaluation framework using a common database. The reported performances of published CAD systems can vary substantially because different data sets were used for training and evaluation (Firmino et al.(2014);
Jacobs et al. (2016)). Moreover, substantial variabil-ity among radiologists on what constitutes a nodule has been reported (Armato et al.(2009)). Consequently, it is difficult to directly and objectively compare different CAD systems. The evaluation of different systems using the same framework provides unique information that can be leveraged to further improve the existing systems and develop novel solutions.
ANODE09 was the first comparative study aimed to-wards evaluating nodule detection algorithms (van Gin-neken et al.(2010)). This challenge has allowed groups to evaluate their algorithms on a shared set of scans ob-tained from a lung cancer screening trial. However, this study only included 50 scans from a single center, all
of which were acquired by using one type of scanner and scan protocol. In addition, the ANODE09 set con-tained a limited number of larger nodules, which gener-ally have a higher suspicion of malignancy. Evaluation on a larger and more diverse image database is therefore needed.
In this paper, we introduce a novel evaluation frame-work for automatic detection of nodules in CT images. A large data set, containing 888 CT scans with annota-tions from the publicly available LIDC-IDRI database (Armato et al.(2011)), is provided for both training and testing. A web framework has been developed to effi -ciently evaluate algorithms and compare the result with the other algorithms. The impact of combining multiple candidate detection approaches and false positive reduc-tion stages was also evaluated.
The key contributions of this paper are: (1) we de-scribe and provide an objective web framework for eval-uating nodule detection algorithms using the largest publicly available data set; (2) we report the perfor-mance of algorithms submitted to the framework, as well as their combinations. We show that the combina-tion of classical candidate detectors and a combinacombina-tion of deep learning architectures processing these candi-dates generates excellent results, better than any indi-vidual system; (3) we update the LIDC-IDRI reference standard by identifying nodules that were missed in the original LIDC-IDRI annotation process.
2. Data
The data set was collected from the largest pub-licly available reference database for lung nodules: the LIDC-IDRI database (Armato et al.(2011);Clark et al.
(2013); Armato III et al. (2015)). This database is available from NCI’s Cancer Imaging Archive2 under
a Creative Commons Attribution 3.0 Unported License. The LIDC-IDRI database contains a total of 1018 CT scans. CT images come with associated XML files with annotations from four experienced radiologists. The database is very heterogeneous: it consists of both clin-ical dose and low-dose CT scans, collected from seven different participating academic institutions, and a wide range of scanner models and acquisition parameters are included.
As recommended by Naidich et al. (2013); Manos et al. (2014) and the American College of Radiology (Kazerooni et al.(2014)), thin-slice CT scans should be
2https://wiki.cancerimagingarchive.net/display/
used for the management of pulmonary nodules. There-fore, we discarded scans with a slice thickness larger than 3 mm. Next to that, we excluded scans with in-consistent slice spacing or missing slices. This led to the final list of 888 scans. These scans were pro-vided as MetaImage (.mhd) images that can be accessed and downloaded from the website (http://luna16. grand-challenge.org/).
Each LIDC-IDRI scan was annotated by experienced thoracic radiologists in a two-phase reading process. In the initial blinded reading phase, four radiologists in-dependently annotated scans and marked all suspicious lesions as: nodule≥3 mm; nodule<3 mm; non-nodule (any other pulmonary abnormality). For lesions anno-tated as nodule≥3 mm, diameter measurements were provided. In a subsequent unblinded reading phase, the anonymized blinded results of all other radiologists were revealed to each radiologist, who then indepen-dently reviewed all marks. No consensus was forced.
In the 888 scans, a total of 36,378 annotations were made by the radiologists. We only considered anno-tations categorized as nodules≥3 mm as relevant le-sions, as nodules<3 mm and non-nodule lesions are not considered relevant for lung cancer screening pro-tocols (Aberle et al.(2011)). Nodules could be anno-tated by multiple radiologists, annotations from diff er-ent readers that were located closer than the sum of their radii were merged. In this case, position and diame-ters of these merged annotations were averaged. This resulted in a set of 2,290, 1,602, 1,186, and 777 nod-ules annotated by at least 1, 2, 3, or 4 radiologists, respectively. We considered the 1,186 nodules anno-tated by the majority of the radiologists (at least 3 out of 4 radiologists) as the positive examples in our refer-ence standard. These are the lesions the algorithms of teams participating in LUNA16 should detect. Other findings (1,104 nodules annotated by less than 3 out of 4 radiologists, 11,509 nodule<3 mm annotations, and 19,004 non-nodule annotations) are considered “ir-relevant findings” and marks on these locations are not counted as false positives nor as true positives in the final analysis. The same approach was used by (van Ginneken et al.(2010);Jacobs et al.(2016)). The moti-vation to exclude irrelevant findings in the evaluation is because they remain pulmonary abnormalities that could be important for different clinical diagnosis ( Ar-mato et al. (2011)) as a CAD mark on such a lesion is not a true false positive mark. It also alleviates the problem of disagreement on what constitutes a nodule (Armato et al.(2009);van Ginneken et al.(2010)).
3. LUNA16 challenge
The proposed evaluation framework is coined the LUng Nodule Analysis 2016 (LUNA16) challenge. LUNA16 invites participants to develop a CAD sys-tem that automatically detects pulmonary nodules in CT scans. The challenge provides the data set and the ref-erence annotations described in Section2. This data set can be used for training of the systems and the evalua-tion of the algorithms is performed on the same data set. This makes LUNA16 a completely open challenge. To prevent biased results as a result of training and testing on the same data set, participants are instructed to per-form cross-validation in a particular manner detailed be-low. The LUNA16 website allows participants to submit the results. Submitted results are automatically evalu-ated and presented on the website. The next paragraphs describe the challenge in more detail.
3.1. Challenge tracks
The challenge consists of two separate tracks: (1) complete nodule detection and (2) false positive reduc-tion.
The complete nodule detection track requires the par-ticipants to develop a complete CAD system and there-fore, the only input to a system in this track is a CT scan.
In the false positive reduction track, participants are only required to classify a number of locations in each scan as being on a nodule or not. This corresponds to the so-called false positive reduction step in many published nodule CAD systems. For this track, a list of candidates is supplied to the participants, which is computed using existing nodule candidates detection al-gorithms (see Section 4.1). Phrased in this way, this problem can be seen as a typical machine learning task, where a two class (nodule/not-nodule) classification has to be performed. We included this track in the challenge to lower the barrier for participation for teams with ex-perience in image classification tasks but no particular background on the analysis of chest CT scans. On the LUNA16 website, we included a tutorial how to extract cubes and patches around the nodule candidate loca-tions in CT scans.
3.2. Cross-validation
Participants are required to perform 10-fold cross-validation when they use the provided LIDC-IDRI data both as training and as test data. The data set has been randomly split into ten subsets of equal size. The sub-sets can be directly downloaded from the LUNA16 web-site. To perform 10-fold cross-validation, participants should follow these guidelines (for fold N):
• split the data set into a test set and a training set. Subset N is used as test set and the remaining folds are used as the training set.
• for the ’false positive reduction’ track, test and training candidates should be extracted on the cor-responding test and training set;
• train the algorithm on the training set;
• test the trained algorithm on the test set and gener-ate the result file;
• after iterating this process over all folds, merge the result files to get the result for all cases.
3.3. Evaluation
The results of the algorithms must be submitted on-line in the form of a comma separated value (csv) file. The csv file contains all marks produced by the CAD system. For each CAD mark, position (image identifier, x,y and z coordinate) and a score should be provided. The higher the score, the more likely the location is a true nodule.
A CAD mark is considered a true positive if it is lo-cated within a distancerfrom the center of any nodule included in the reference standard, whereris set to the radius of the reference nodule. When a nodule is de-tected by multiple CAD marks, the CAD mark with the highest score is selected. CAD marks that detect irrele-vant findings are discarded from the analysis and are not considered as either false positive or true positive. CAD marks not falling into previous categories are marked as false positives.
Results are evaluated using the Free-Response Re-ceiver Operating Characteristic (FROC) analysis ( Inter-national Commission on Radiation Units and Measure-ments(2008)). The sensitivity is defined as the frac-tion of detected true positives (TPs) divided by the num-ber of nodules in our reference standard. In the FROC curve, sensitivity is plotted as a function of the average number of false positives per scan (FPs/scan). For each scan, we took, at maximum, 100 CAD marks that were given the highest scores. The 95% confidence interval of the FROC curve are computed using bootstrapping with 1,000 bootstraps, as detailed in (Efron and Tibshi-rani(1994)). In order to evaluate and compare different systems easily, we defined one overall output score. The overall score is defined as the average of the sensitivity at seven predefined false positive rates: 1/8, 1/4, 1/2, 1, 2, 4, and 8 FPs per scan. The performance metric was introduced in the ANODE09 challenge and is re-ferred to as the Competition Performance Metric (CPM) inNiemeijer et al.(2011).
The evaluation script is publicly available on the LUNA16 website and can thus be viewed and used by participants.
4. Methods
In this section we provide a brief description of the algorithms applied in the LUNA16 challenge. As of 31stOctober 2016, seven systems have been applied to
the complete nodule detection track and five systems have been applied to the false positive reduction track. First, the candidate detection algorithms that were used to generate candidates for false positive reduction track are presented in Section 4.1. Thereafter, the systems submitted to the complete detection system track are de-scribed in Section4.2. Last, we described the systems submitted to the false positive reduction track in Sec-tion4.3.
4.1. Candidate detection
This section describes the candidate detection algo-rithms applied in the challenge. All candidate detection algorithms were developed as part of published CAD systems (Murphy et al.(2009);Jacobs et al.(2014); Se-tio et al.(2015);Tan et al.(2011);Torres et al.(2015)), some of which are included in the complete nodule de-tection track. As candidates from multiple algorithms are likely to be complementary, we merged all candi-dates using the procedure described in Section 4.1.6. The list of merged candidates can be downloaded from the LUNA16 website and can be used by teams that want to participate in the false positive reduction track.
4.1.1. ISICAD
This generic nodule candidate detection algorithm was developed byMurphy et al.(2009). First, the image is downsampled from 512×512 to 256×256 with the number of slices reduced to form isotropic resolution. Thereafter, Shape Index (SI) and curvedness (CV) are computed at every voxel in the lung volume as follows:
S I=2 πarctan( k1+k2 k1−k2 ) CV=q2k2 1+k 2 2
wherek1 andk2 are principal curvatures computed us-ing first and second order derivatives of the image with a Gaussian blur of scale σ = 1 voxel. After SI and CV are computed, thresholding on these values is ap-plied to obtain seed points for nodule candidates. These
seed points represent voxels which may lie on a nod-ule surface. Seeds are expanded using broader thresh-olds to form voxel clusters. To reduce the number of the clusters, clusters within 3 voxels are merged recursively. The center of the mass of the cluster is considered to be the point of interest.
4.1.2. SubsolidCAD
This candidate detection algorithm was built with the specific purpose to detect subsolid nodules, which are less common but more likely to be cancerous ( Hen-schke et al. (2002)). The candidate detection algo-rithm byJacobs et al.(2014) applies a double thresh-old density mask. The HU values commonly observed in subsolid nodules are used, ranging between -750 HU and -300 HU. Since partial volume effects may occur at the boundaries of the lungs, vessels and airways, a morphological opening using spherical structuring el-ement (3 voxels diameter) is applied to remove these structures. Next, connected component analysis is per-formed. Components with a volume smaller than 34 mm3 are discarded from the list of candidates as sub-solid nodules with a diameter smaller than 5 mm do not require follow-up CT. The centers of the candidate re-gions are used as nodule candidate locations.
4.1.3. LargeCAD
This candidate detection algorithm (Setio et al.
(2015)) was built with the specific purpose of detecting very large nodules. Large solid nodules (≥10 mm) have surface/shape index values or specific intensity range that is not captured by the two previously described nodule detection algorithms. An intensity threshold of -300 HU (usually corresponding to solid nodules) is ap-plied in combination with multiple morphological op-erations. Thereafter, all connected voxels are clustered using connected component analysis and clusters with an equivalent diameter outside the range [8,40] mm are discarded.
4.1.4. ETROCAD
The applied method uses the system proposed byTan et al.(2011). Isotropic re-sampling of the image to a voxel dimension of 1 mm3is applied in the preprocess-ing step. The nodule candidate algorithm consists of a nodule segmentation method based on nodule and ves-sel enhancement filters and a computed divergence fea-ture to locate the centers of the nodule clusters. Three different set of filters (Li et al.(2003,2004)) are applied to detect different types of nodules: isolated, juxtavas-cular, and juxtapleural nodules. To better estimate the location of the nodule centers and reduce the FP rate,
the maxima of the divergence of the normalized gradient (DNG) of the imagek=∇(→−w) is used, where→−w =
− →
∆L ||→−∆L||
and Lis the image intensity. The enhancement filters and DNG are calculated at different scales in order to detect the seed points for different sizes of nodules.
Thresholding on the filtered image and DNG are ap-plied to obtain the list of candidates. Different thresh-olds on the filtered image and the nodule-enhanced im-age are applied for isolated nodules, juxtavascular nod-ules, and juxtapleural nodules to get candidate loca-tions. Finally, to ensure that a single nodule is repre-sented by a single mark, cluster merging is performed.
4.1.5. M5L
The candidate detection algorithm proposed by Tor-res et al. (2015) consists of two different algorithms: lungCAM and Voxel-Based Neural Approach (VBNA). LungCAM is inspired based on the life-cycle of ants colonies (Cerello et al.(2010)). The lung internal struc-tures are segmented by iteratively deploy ant colonies in voxels with intensity above a predefined thresholds. The ant colony moves to a specific destination and re-leases pheromones based on a set of rules (Chialvo and Millonas(1995)). Voxels visited by ant colonies are re-moved and new ant colonies are deployed in unvisited voxels. Iterative thresholding of the pheromone maps is applied to obtain a list of candidates. The probability Pi jthat a candidate destination is chosen is defined as:
Pi j(vi→vj)=
W(σj)
P
n=1,26W(σn)
whereW(σj) depends on the amount of pheromone in
voxelvj. The algorithm ends when all the ants in the
colony have died.
VBNA uses two different procedures to detect nod-ules inside the lung parenchyma (Li et al.(2003);Retico et al.(2008)) and nodules attached to the pleura (Retico et al.(2009)). The nodules inside the lung parenchyma are detected using a dedicated dot-enhancement filter. Since nodules can manifest with a different size range, a multi-scale approach is followed (Li et al.(2003)). Nod-ule candidate locations are defined as the local maxima of the filtered image. The pleural nodules are detected by computing the surface normal at the lung wall. To build the normal, a marching cube algorithm is used. For each voxel inside the lung, the number of surface normals passing through are accumulated. Pleural can-didates are defined as the local maxima of the accumu-lated scores.
4.1.6. Combining candidate detection algorithms The combination of different CAD systems has been shown to improve the overall detection performance for nodule detection in chest CT (van Ginneken et al.
(2010); Niemeijer et al. (2011)). The previously de-scribed candidate detection algorithms use different ap-proaches to detect candidates and are likely to detect different set of nodules. In consequence, the combina-tion of multiple algorithms may improve the deteccombina-tion sensitivity of nodules, and therefore, is a better baseline for the false positive reduction systems.
To combine the results of multiple candidate detec-tion algorithms, each algorithm should provide the list of candidates. For each candidate, the position is given. First, we concatenated the list of candidates from all systems. Second, candidates located closer than 5 mm to each others are merged. Third, the position of the merged candidates are averaged. Candidates that are lo-cated outside the lung region are discarded, as they are not relevant for nodule detection. The lung region is determined based on the lung segmentation algorithm proposed byvan Rikxoort et al. (2009). As the algo-rithm may exclude nodules attached to the lung wall, a slack border of 10 mm was applied.
4.2. Complete nodule detection system
Seven methods that were submitted to the complete nodule detection track are described in this section.
4.2.1. ZNET
ZNET uses ConvNets for both candidate detection and false positive reduction. As a preprocessing step, CT images are resampled to isotropic resolution of 0.5 mm. Candidate detection is extracted based on the probability map given by U-Net (Ronneberger et al.
(2015)). U-net is applied on each axial slice. Before applying U-Net, the resampled input slice is resized to 512×512. The candidates are extracted based on the slice-based probability map output of the U-net. A threholding is applied to obtain candidate masks. The threshold was determined on the validation subset, max-imizing the number of detected nodules. Thereafter, a morphological erosion operation with a 4-neighborhood kernel is used to remove partial volume effects. The candidates are then grouped by performing connected component analysis. The center of mass of the the com-ponents represent the coordinates of the candidates. The false positive reduction is described in Section 4.3.4. Both candidate detection and false positive reduction stages were trained in a cross-validation using provided folds.
4.2.2. Aidence
Aidence is a company developing computer assisted diagnosis tools for radiologists based on deep learning (http://aidence.com/). The LUNAAidence algo-rithm uses end-to-end ConvNets trained on a subset of studies from the National Lung Screening Trial (NLST) with additional annotation provided by in-house radiol-ogists. The LUNA16 data set was used for validation purposes only, and was not used as training data. 4.2.3. JianPeiCAD
JianPeiCAD is a system developed by Hangzhou Jianpei Technology Co. Ltd., a company based on Hangzhou, China (http://www.jianpeicn.com). The algorithm follows the common two stage work-flow of nodule detection: candidate detection and false posi-tive reduction. A multi-scale rule-based screening is ap-plied to obtain nodule candidates. The false positive re-duction uses a wide CNNs, which are trained using data augmentation to alleviate bias learning problem. The system was developed using in-house resources (Chi-nese patient CT images and CT devices from local-vendors) and LUNA16 data set was used as a further validation for patients outside China.
4.2.4. MOT M5Lv1
The Multi Opening and Threshold CAD is a fully au-tomatic CAD developed to be included into the M5L system (Torres et al.(2015)). The lung volume is ob-tained using 3D region growing, with a trachea exclu-sion and lung separation procedures. The candidate detection algorithm is developed based on the method proposed byMessay et al.(2010). Multiple gray level-thresholding and morphological processing is used to detect and segment nodule candidates. Several modi-fications to the sequence of threshold and opening ra-dius, as well as to the merging procedure, were per-formed. Thereafter, a dedicated nodule segmentation method (Kuhnigk et al.(2006)) is applied to separate nodules from vascular structures during the segmenta-tion step. The false positive reducsegmenta-tion computes 15 fea-tures, ranging from geometrical features (e.g. radius, sphericity, skewness of distance from center) and inten-sity features (e.g. average, standard deviation, maxi-mum, entropy). Classification is performed using feed-forward neural networks that consists of 1 input layer with 15 input units, 1 hidden layer with 31 units, and 1 output layer with 1 output unit.
4.2.5. VISIACTLung
This submission contains the results of the commer-cially available VisiaTMCT Lung CAD system, version
5.3 (MeVis Medical Solutions AG, Bremen, Germany). This is an FDA approved CAD system designed to assist radiologists in the detection of solid pulmonary nodules during review of multidetector CT scans of the chest. It is intended to be used as an adjunct, alerting the ra-diologist after his or her initial reading of the scan to regions of interest (ROIs) that may have been initially overlooked.
4.2.6. ETROCAD
ETROCAD is a CAD system developed byTan et al.
(2011). The candidate detection algorithm is described in Section4.1.4. The false positive reduction stage uses a dedicated feature extraction and classification algo-rithm. For each candidate, a set of features is computed: invariant features defined on a 3D gauge coordinates system, shape features, and regional features. The clas-sification is performed using a feature-selective classi-fier based on artificial neural networks (ANNs) and ge-netic algorithms, called FD-NEAT.
4.2.7. M5LCAD
M5LCAD is a CAD system developed byTorres et al.
(2015), which consists of two algorithms: lungCAM and VBNA. This CAD system uses the candidate de-tector algorithms described in section4.1.5. The false positive reduction stage of LungCAM computes a set of 13 features for nodule candidate analysis, including spatial, intensity, and shape features. The set of features is used to classify the candidates using a feed-forward artificial neural network (FFNN). The FFNN architec-ture consists of 13 input neurons, 1 hidden layer with 25 neurons, and 1 neuron as output layer. The false pos-itive reduction of VBNA performs the classification us-ing a standard three-layered FFNN usus-ing the raw voxels as the feature vector (Retico et al.(2008,2009)).
4.3. False positive reduction systems
Five methods that were applied to the false positive reduction track are described in this section.
4.3.1. CUMedVis
CUMedVis uses multi-scale 3D ConvNets developed by Dou et al. (2016). To tackle challenges coming from variations of nodule sizes, types, and geometry characteristics, a system that consists of three different 3D ConvNets architectures (Archi-a,Archi-b, Archi-c) is presented. Each subsystem uses an input image with different receptive field so that multiple levels of con-textual information surrounding the suspicious location could be incorporated.
Archi-ahas a receptive field of 20×20×6. Three con-volutional layers are used with 64 kernels of 5×5×3, 5×5×3, 5×5×1, respectively. Thereafter, a fully-connected layer with 150 output units and a softmax layer are applied. Archi-b has a receptive field of 30×30×10. After the first convolutional layer with 64 kernels of 5×5×3, a max-pooling layer with kernel 2×2×1 is used. Thereafter, two convolutional layers each with 64 kernels of 5×5×3 are added. Finally, a fully-connected layer with 250 output units and a soft-max layer are established.Archi-chas the largest recep-tive field of 40×40×26. After the first convolutional layer with 64 kernels of 5×5×3, a max-pooling layer with kernel 2×2×2 is used. Thereafter, two convo-lutional layers each with 64 kernels of 5×5×3 are added. Finally, a fully-connected layer with 250 output units and a softmax layer are established. The predic-tion probabilities from three ConvNets architectures are finally fused with weighted linear combination to pro-duce the final prediction for a given candidate.
For pre-processing, voxel intensities are clipped into the interval from -1000 to 400 HU and normalized into the range from 0 to 1. To deal with the class imbalance between the false positives and nodules, translation (one voxel along each axis) and rotation (900, 1800, 2700 within the transverse plane) augmentations were per-formed on the nodules. The weights are initialized us-ing a Gaussian distribution and are optimized usus-ing the standard back-propagation with momentum (Sutskever et al. (2013)). Dropout (Hinton et al.(2012)) strategy was applied during training. The system was imple-mented using Theano (Bastien et al.(2012)) and a GPU of NVIDIA TITAN Z was used for acceleration. 4.3.2. JackFPR
The proposed method uses similar multi-scale 3D ConvNets presented by (Dou et al. (2016)). It uses three 3D ConvNets architectures (Archi-a, Archi-b, Archi-c) described in Section 4.3.1. Several modi-fications were performed. Exponential activation units are used as the activation functions. Instead of com-bining the predictions of three ConvNets using linear combination, the fully-connected layers from three ar-chitectures were concatenated and were connected to a fully-connected layer with 128 output units. The last fully-connected layer is followed by a softmax layer to obtain the prediction.
The training was performed for 240 epochs with 1,024 iterations per epoch. Xavier initialization (Glorot and Bengio (2010)) was used as the weight initializa-tion and Nesterov accelerated Stochastic Gradient De-scent (SGD) was used. Cross-entropy loss, L2
regular-ization loss, and center loss were used as the cost func-tion. Center loss penalizes the difference between a run-ning average of learned features for each class and sam-ple class features seen during the particular batch (Wen et al.(2016)). The learning rate was set to 0.005 for the first 5 epochs as a warming up, Thereafter, the learning rate was set to 0.01 and was reduced by 1/10 every 80 epochs. The model was trained on the provided sub-set. Data augmentation was performed and dropout was applied to combat over-fitting.
4.3.3. DIAG CONVNET
This method uses multi-view ConvNets proposed by
Setio et al.(2016). For each candidate, nine 65×65 patches of 50×50 mm from different views are ex-tracted. Each view corresponds to a different plane of symmetry in a cube and is processed using a stream of 2D ConvNets. The ConvNets stream consists of 3 con-secutive convolutional layers and max-pooling layers. First convolutional layer is formed by 24 kernels of 5×5; second convolutional layer by 32 kernels of 3×3; third convolutional layer by 48 kernels of 3×3. Weights are initialized randomly and updated during training. The max-pooling layer is used to reduce size of patches by half. The last layer is a fully connected layer with 16 output units. Rectified linear units (ReLU) are used as the activation functions. The fusion of the diff er-ent ConvNets is performed using the late fusion method (Prasoon et al.(2013);Karpathy et al.(2014)). Fully-connected layers from all streams are concatenated and are connected directly to a softmax layer. This approach allows the network to learn 3D characteristics by com-paring outputs from multiple ConvNets streams. In this approach, all the parameters of the convolutional layers from different streams are shared.
Data augmentation is applied on candidates in the training set to increase the variance of presentable can-didates. For each candidate, random zooming [0.9,1.1] and random rotation [−200,+200] were performed. To prevent over-fitting during training, random positive and negative candidates with equal distribution were sam-pled in a batch of 64 samples. Validation was performed every 1,024 batches. Training was stopped when the area under the curve of receiver operating character-istic on the validation dataset does not improve af-ter 3 epochs. Xavier initialization (Glorot and Ben-gio(2010)) was used as the weight initialization. The weights were optimized using RMSProp (Tieleman and Hinton(2012)). Evaluation was performed in 10-fold cross validation. Compared to the original work ( Se-tio et al.(2016)), the submitted system uses an ensem-ble of three multi-view ConvNets trained using different
random seed-points, averaging out biases from training using random samples. The system was implemented using Theano (Bastien et al. (2012)) and a GPU of NVIDIA TITAN X was used for acceleration.
4.3.4. ZNET
ZNET uses the recently published wide residual net-works (Zagoruyko and Komodakis (2016)). For each candidate axial, 64×64 patches from the sagittal and coronal views are extracted. Each slice is processed separately by the wide residual networks. The predicted output values of the network for these three different slices were averaged to obtain the final prediction. The architecture uses 4 sets of consecutive convolutional layers. The first set consists of 1 convolutional layer with 16 kernels of 3×3. The second set consists of 10 convolutional layers with 96 kernels of 3×3. The third set consists of 10 convolutional layers with 192 kernels of 3×3. The forth set consists of 10 convolutional lay-ers with 384 kernels of 3×3. The second to the forth sets are followed by max-pooling layer of 2×2. The last layer is a connected to a convolutional layer with 1 kernel of 8×8, resulting in a 1×1 output image.
Xavier initialization (Glorot and Bengio(2010)) was used for weight initialization and ADAM was used as the optimization method (Xu et al.(2015)). Leaky Rec-tified Linear Units were used as nonlinearities through-out the network. Data augmentation (flipping, rotation, zooming and translation) was applied not only on the training data set, but also on the test data set in order to improve the test set scores. The learning rate was reduced over time: learning rate is decreased by 90% after epoch 80 and epoch 125. All convolutional net-works were implemented using Lasagne and Theano li-braries (Dieleman et al.(2015);Bastien et al. (2012)). The training was performed on a computer cluster using large range of CUDA enabled graphics cards including the Tesla K40M, Titan X, GTX 980, GTX 970, GTX 760 and the GTX 950M.
4.3.5. CADIMI
This method uses multi-slice ConvNets. For each ax-ial, sagittal and coronal view, three patches are extracted at three locations: the plane in the exact candidate loca-tion, as well as the planes from 2 mm of both directions on the remaining free axis (in x, y, z direction). The patches are concatenated as three-dimensional arrays. This results in patches of 52×52×3 mm, centered around the candidate location. The network consists of 2D ConvNets with consecutive convolutional layers and max-pooling. The first convolutional layer uses 24 channels of 5×5. The second convolutional layer uses
32 kernels of 3×3. The third convolutional layer uses 48 kernels of 3×3. The output of the last max-pooling is connected to fully-connected layer of 512 output units. ReLU was used as the activation function. The last fully-connected layer is connected to a softmax layer.
Training was performed one time using patches from all three views for 80 epochs. For each epoch, all pos-itive patches and 20,000 random negative patches were used. In order to tackle the problem of data imbalance, data augmentation (vertical/horizontal flip and random cropping) was applied. During testing, 5 patches (1 cen-ter patch and 4 patches with [−4,+4] translation in two axes) are extracted from each view. These patches are processed using a single trained network and the pre-dictions are averaged. Batch normalization was applied after each max-pooling layer to reduce overfitting. The weights were initialized using He uniform initialization (He et al.(2015b)). Nesterov accelerated SGD with a learning rate of 0.01, a decay of 0.001 and a momentum of 0.9 was used. The system was implemented using Lasagne and Theano libraries (Dieleman et al. (2015);
Bastien et al.(2012)).
4.4. Combining false positive reduction systems The combination of multiple classification methods, known as well as an ensemble method, has been used in many machine-learning problems to improve the pre-diction performance (Dietterich (2000)). As systems applied in the false positive reduction track use the same set of candidates, the impact of combining multiple methods could be evaluated. In this study, we combined CAD results from the systems in the false positive re-duction track. The combination is performed by simply averaging the probabilities given by the systems. Such an ensemble approach is a common approach in opti-mizing the performance of deep learning architectures (Szegedy et al.(2014);He et al.(2015a)).
5. Results
In this section, we present the results achieved by all individual systems described in Section4. The results of combining multiple algorithms are provided. 5.1. Candidate detection
Table 1 summarizes the performance of individual candidate detection algorithms and their top perform-ing combinations. The sensitivities of the individual al-gorithms vary from 31.8% to 92.9%. When multiple candidate detection algorithms are combined, the sensi-tivity substantially improves up to 98.3% (1,162/1,186
nodules), higher than the sensitivity of any individual system. This illustrates the potential of combination of multiple candidate detection algorithms to improve the sensitivity of CAD systems.
5.2. Complete nodule detection track
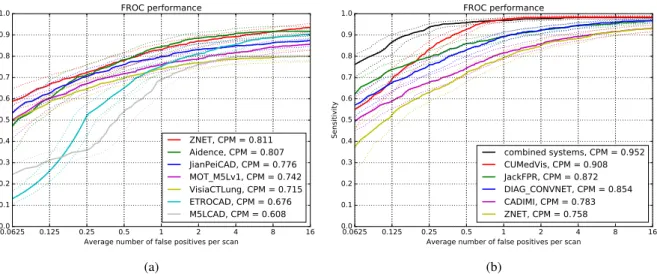
The FROC curves of the systems on the complete nodule detection track are shown in Figure1a. In this track, the best score is achieved by ZNET with a CPM of 0.811. Other systems show comparable performance. It is observed that the relatively large differences in terms of sensitivity at low FPs/scan substantially influence the overall scores of the systems.
5.3. False positive reduction track
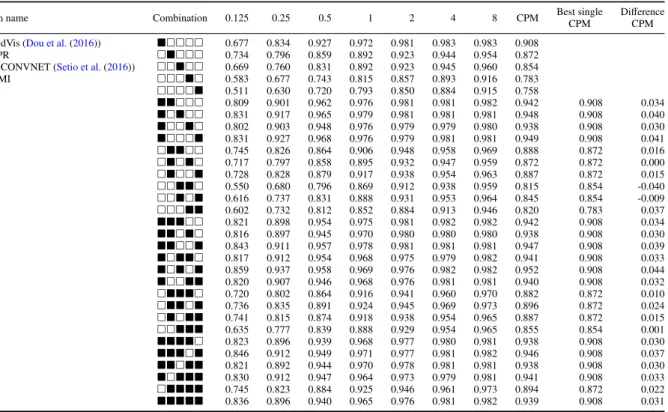
The FROC curves of the systems on the false posi-tive reduction track are shown in Figure1b. The best average score is achieved by CuMedVis, with a CPM of 0.908. Table2 shows all possible combinations of the systems. The sensitivity of the combined systems are higher than the sensitivity achieved by the best system. Although all false positive reduction systems are based on ConvNets, it is evident that combining ConvNets with different configurations still further improves the overall sensitivity as shown in Table2.
5.4. Analysis of false positives: observer study
To evaluate the potential of CAD systems to detect nodules missed by human readers, and to elucidate the nature of the false positives of the CAD systems, an ob-server study was performed. In the obob-server study, CAD marks from the combination of false positive reduction systems were assessed to identify if there are additional nodules detected. The reading process was performed by four radiologists independently.
We extracted all CAD marks at 0.25 FPs/scan that were categorized as false positives. To reduce the work-load of the radiologists, we eliminated CAD marks that were obviously false positives after a reading by re-search scientists. Thereafter, CAD marks on lesions that have been annotated in LIDC-IDRI, but were consid-ered as false positives, were discarded. Most of these lesions were non-nodular and therefore, they are not well-captured by the defined hit criteria (radius of the corresponding lesion). This operation leads to a set of 127 marks that are potentially nodules. As a similar ob-server study was performed in our previous study ( Ja-cobs et al. (2016)), marks which were already evalu-ated on this CT data were not read again and the scores of the four radiologists from the previous study were used. Last, we asked four radiologists to review and
System name Combination Sensitivity Best singlesensitivity Disensitivityfference Total numberof candidates Average number ofcandidates /scan
ISICAD (Murphy et al.(2009)) 0.856 298 256 335.9
SubsolidCAD (Jacobs et al.(2014)) 0.361 258 075 290.6
LargeCAD (Setio et al.(2015)) 0.318 42 281 47.6
M5L (Torres et al.(2015)) 0.768 19 687 22.2
ETROCAD (Tan et al.(2011)) 0.929 295 686 333.0
0.918 0.857 0.062 520 319 585.9 0.898 0.857 0.041 328 742 370.2 0.917 0.857 0.061 308 047 346.9 0.959 0.929 0.030 524 108 590.2 0.523 0.361 0.162 295 476 332.7 0.869 0.768 0.101 274 900 309.6 0.954 0.929 0.024 518 058 583.4 0.834 0.768 0.066 59 359 66.8 0.945 0.929 0.016 319 405 359.7 0.942 0.929 0.013 297 030 334.5 0.944 0.857 0.088 550 105 619.5 0.954 0.857 0.098 530 942 597.9 0.977 0.929 0.048 728 162 820.0 0.934 0.857 0.078 339 229 382.0 0.964 0.929 0.035 548 523 617.7 0.967 0.929 0.038 529 404 596.2 0.900 0.768 0.132 310 323 349.5 0.964 0.929 0.035 545 204 614.0 0.965 0.929 0.035 524 726 590.9 0.954 0.929 0.024 326 274 367.4 0.980 0.929 0.051 750 838 845.5 0.983 0.929 0.054 732 901 825.3 0.970 0.929 0.040 553 327 623.1 0.965 0.857 0.108 559 543 630.1 0.970 0.929 0.040 551 227 620.8 0.983 0.929 0.054 754 975 850.2
Table 1: Results of five candidate detection systems and all possible combinations are shown. The filled squares indicate which systems have been included in the combination. The (combined) detection sensitivity and the number of candidates are listed.
System name Combination 0.125 0.25 0.5 1 2 4 8 CPM Best single
CPM
Difference CPM CUMedVis (Dou et al.(2016)) 0.677 0.834 0.927 0.972 0.981 0.983 0.983 0.908
JackFPR 0.734 0.796 0.859 0.892 0.923 0.944 0.954 0.872
DIAG CONVNET (Setio et al.(2016)) 0.669 0.760 0.831 0.892 0.923 0.945 0.960 0.854
CADIMI 0.583 0.677 0.743 0.815 0.857 0.893 0.916 0.783 ZNET 0.511 0.630 0.720 0.793 0.850 0.884 0.915 0.758 0.809 0.901 0.962 0.976 0.981 0.981 0.982 0.942 0.908 0.034 0.831 0.917 0.965 0.979 0.981 0.981 0.981 0.948 0.908 0.040 0.802 0.903 0.948 0.976 0.979 0.979 0.980 0.938 0.908 0.030 0.831 0.927 0.968 0.976 0.979 0.981 0.981 0.949 0.908 0.041 0.745 0.826 0.864 0.906 0.948 0.958 0.969 0.888 0.872 0.016 0.717 0.797 0.858 0.895 0.932 0.947 0.959 0.872 0.872 0.000 0.728 0.828 0.879 0.917 0.938 0.954 0.963 0.887 0.872 0.015 0.550 0.680 0.796 0.869 0.912 0.938 0.959 0.815 0.854 -0.040 0.616 0.737 0.831 0.888 0.931 0.953 0.964 0.845 0.854 -0.009 0.602 0.732 0.812 0.852 0.884 0.913 0.946 0.820 0.783 0.037 0.821 0.898 0.954 0.975 0.981 0.982 0.982 0.942 0.908 0.034 0.816 0.897 0.945 0.970 0.980 0.980 0.980 0.938 0.908 0.030 0.843 0.911 0.957 0.978 0.981 0.981 0.981 0.947 0.908 0.039 0.817 0.912 0.954 0.968 0.975 0.979 0.982 0.941 0.908 0.033 0.859 0.937 0.958 0.969 0.976 0.982 0.982 0.952 0.908 0.044 0.820 0.907 0.946 0.968 0.976 0.981 0.981 0.940 0.908 0.032 0.720 0.802 0.864 0.916 0.941 0.960 0.970 0.882 0.872 0.010 0.736 0.835 0.891 0.924 0.945 0.969 0.973 0.896 0.872 0.024 0.741 0.815 0.874 0.918 0.938 0.954 0.965 0.887 0.872 0.015 0.635 0.777 0.839 0.888 0.929 0.954 0.965 0.855 0.854 0.001 0.823 0.896 0.939 0.968 0.977 0.980 0.981 0.938 0.908 0.030 0.846 0.912 0.949 0.971 0.977 0.981 0.982 0.946 0.908 0.037 0.821 0.892 0.944 0.970 0.978 0.981 0.981 0.938 0.908 0.030 0.830 0.912 0.947 0.964 0.973 0.979 0.981 0.941 0.908 0.033 0.745 0.823 0.884 0.925 0.946 0.961 0.973 0.894 0.872 0.022 0.836 0.896 0.940 0.965 0.976 0.981 0.982 0.939 0.908 0.031
Table 2: Results of five false positive reduction systems and all possible combinations are shown. The filled squares indicate which systems have been included in the combination. The average sensitivity (CPM) and the difference compared to the best single CPM are shown.
0.0625 0.125 0.25 0.5 1 2 4 8 16 Average number of false positives per scan
0.0 0.1 0.2 0.3 0.4 0.5 0.6 0.7 0.8 0.9 1.0 Se nsi tiv ity FROC performance ZNET, CPM = 0.811 Aidence, CPM = 0.807 JianPeiCAD, CPM = 0.776 MOT_M5Lv1, CPM = 0.742 VisiaCTLung, CPM = 0.715 ETROCAD, CPM = 0.676 M5LCAD, CPM = 0.608 (a) 0.0625 0.125 0.25 0.5 1 2 4 8 16
Average number of false positives per scan 0.0 0.1 0.2 0.3 0.4 0.5 0.6 0.7 0.8 0.9 1.0 Se nsi tiv ity FROC performance combined systems, CPM = 0.952 CUMedVis, CPM = 0.908 JackFPR, CPM = 0.872 DIAG_CONVNET, CPM = 0.854 CADIMI, CPM = 0.783 ZNET, CPM = 0.758 (b)
Figure 1: FROC curves of the systems in (a) nodule detection track and (b) false positive reduction track. Dashed curves show the 95% confidence interval estimated using bootstrapping.
Table 3: Overview of the observer study on 222 false positives at 0.25 FPs/scan. The table shows the number of false positives that are accepted by the radiologists as nodules≥3 mm at different agreement levels. The number of false positives that are not accepted as nod-ules≥3 mm, but are accepted as nodules<3 mm, are also included.
Category Number
nodule≥3 mm - at least 1 N0
nodule≥3 mm - at least 2 N1
nodule≥3 mm - at least 3 N2
nodule≥3 mm - at least 4 N3
not nodule≥3 mm - nodule<3 mm N4
annotate the remaining marks as: nodule≥3 mm, nod-ule<3 mm, or false positives. Measurement tools were available to radiologists during the process in order to allow size evaluation.
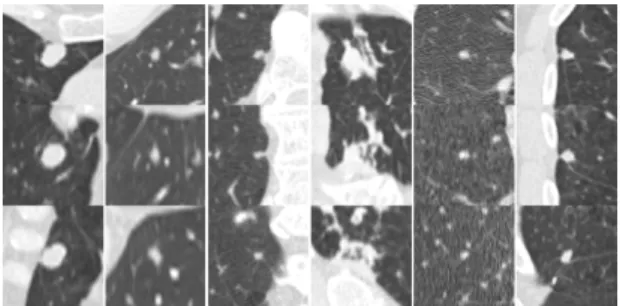
A summary of the observer study is shown in Ta-ble 3. Among 127 CAD marks, N0, N1, N2, and N3 CAD marks are accepted as nodules≥3 mm by at least 1, 2, 3, or 4 radiologists, respectively;N4out ofN5 re-maining CAD marks are considered as nodule<3 mm. Examples of nodules found in this observer study are shown in Figure 2c. We shared the set of additional nodules in the LUNA16 website (LINK) to be used for further development of CAD systems.
6. Discussion
In this study, we presented a novel evaluation frame-work for automatic nodule detection algorithms, which is coined as LUNA16. The aim of the study is to sup-ply the research community a framework to test and compare algorithms on a common large database with a
standardized evaluation protocol. This allows the com-munity to objectively evaluate different CAD systems and push forward the development of state of the art nodule detection algorithms. The submitted systems are described and the performance is evaluated. We showed that the combination of multiple false positive reduction algorithms applied on a combined set of candidates ob-tain an excellent performance, outperforming any indi-vidual system.
Candidate detection plays an important role, as it de-termines the maximum detection sensitivity of a CAD system. The algorithms should ideally detect all nod-ules with an acceptable amount of false positives. Ta-ble 1 shows that individual candidate detection algo-rithms achieve a detection sensitivity between 31.8% to 92.9%. The detection of nodules with a wide range of morphological characteristics is still a challenging task for any single algorithm. Combining different candi-date detection algorithms improves the sensitivity up to 98.3%. This confirms the importance of combining candidate detection algorithms to improve the detection performance of CAD systems.
In the complete nodule detection track, a total of seven systems were evaluated. Diverse methods were applied and different set of data were used for training. When evaluated using the same data set, the detection sensitivity ranges between 69.1% and 91.5% at 1 and 8 FPs/scan, as shown in Figure1a. Top three systems make use of ConvNets for their detection algorithms. While the variability of the performance is determined by the underlying methods, it is also affected by the training data that is used to develop the system (see also
Table4). This suggests the need of a standardized train-ing data set for appropriate comparison of algorithms.
In the false positive reduction track, different systems for false positive reduction are evaluated, given a com-mon set of candidates and training data. A total of five systems were evaluated. ConvNets are used as the pre-diction model for all systems, which is aligned with the recent trend in adapting deep learning in the medical im-age analysis domain. As shown in Figure1b, all systems achieve detection sensitivity between 79.3% and 98.3% at 1 and 8 FPs/scan. As the underlying method is sim-ilar, one could hypothesize that there could be little to no benefit when these systems are combined. However, the results show that combining multiple ConvNets sys-tems substantially improves the detection performance (black curve on Figure1b). The detection sensitivity of over 95.0% is achieved at fewer than 1 FP/scan. Al-though all the methods are based on ConvNets, the dif-ferences in network parameters, such as the selected ar-chitectures and the input patches, makes these systems complementary in terms of the prediction.
The observer study shows that some false positives detected by the CAD systems are nodules that were missed during the manual annotations of LIDC-IDRI. The majority of these nodules are small nodules that were overlooked, nodules that were missed because there were multiple nodules in the corresponding scans, or nodules that were part of a more complex abnormal-ity, for example an area of consolidation. While these nodules may be found during follow-up, detecting them early provides more information that may be clinically important (e.g. determine whether a nodule is growing or not).
Examples of lesions detected or missed by the com-bined CAD system are shown in Figure2. Nodules with a wide range of morphological characteristics are de-tected at 1 FP/scan, showing that ConvNets are capa-ble to capture morphological variation of nodules in the network. Most nodules detected with a high probability are large nodules. These nodules are likely to be malig-nant and should not be missed by CAD. Beside false positives that have been accepted as true nodules by the radiologists in our observer study, most of the false positives are large vessels, mediastinal structures, scar-ring, and spinal abnormalities. Other false positives are caused by motion artifacts and extremely noisy scans. The remaining nodules that were missed by the CAD system at 1 FP/scan consist of small nodules or nodules with irregular shapes. Most of the small nodules were missed by the candidate detection algorithms. Improv-ing the robustness of the candidate detection algorithms may improve the performance even further.
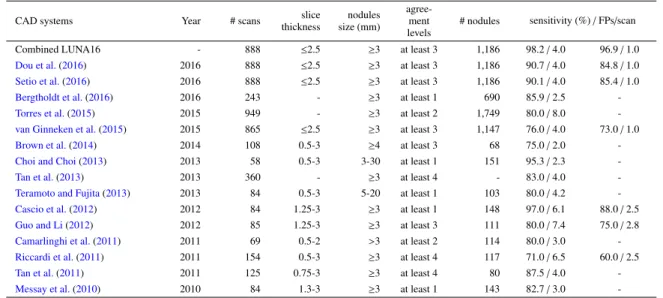
For completeness, the performance of other CAD systems that use LIDC-IDRI data are summarized in Ta-ble4. For each CAD system, we listed the number of scans used in validation data set, nodule inclusion crite-ria (e.g. nodule type, nodule size, agreement levels), number of nodules, and reported CAD performance. While the CAD performance is difficult to be straight-forwardly compared as different data set was used, the table shows a broader context of the reported CAD per-formance in the literature. The CAD systems presented in (Jacobs et al.(2016)) are not listed in this table as these CAD systems also participated in the LUNA16 challenge and hence are already described in this paper. This study has limitations. As the LIDC-IDRI is a web-accessible database for development and evalua-tion of CAD systems, all nodule annotaevalua-tions are pub-licly available. This is not a common setup for chal-lenges. Typically, an independent test set is provided and predictions on this test set are evaluated, but the reference annotations for the test set are not made pub-lic. The setup of LUNA16 introduces the risk of biased results. Teams could tune the parameters of their algo-rithm to show good performance on this particular data set, although the fact that we use such a large set of scans from many different sources somewhat mitigates this risk. We instructed participants that did not have their own training data, to train their system in a par-ticular cross-validation approach. This introduces some risks of making errors, as it is easy to make a mistake in carrying out a cross-validation experiment that goes un-noticed. In fact one team that originally participated in the challenge and reported excellent results had to with-draw because of a bug in the reinitialization of the net-work weights when starting training for the next fold in cross-validation. Unintended mistakes aside, allowing a cross-validation training procedure means that the pre-sented systems are evaluated on test data while having been trained with data from the same source (institution, scanner, protocol). This may introduce a positive bias in the reported results. This bias is however also present in most systems from the literature.
A future challenge on this topic could incorporate a larger data set and split the data set into training data set with annotations and a dedicated test set for evaluation for which the reference standard is kept secret. This still introduces a risk that teams can visually inspect the test data and the output of their system, notice false positives and false negatives and use that information to improve their performance. This could be circumvented by let-ting teams upload their algorithms, e.g. as machine ex-ecutables or software containers.
ax ial co ro n al sag it tal
(a) true positives with highest probability (b) random true positives at 1 FP/scan
ax ial co ro n al sag it tal
(c) false positives accepted as nodules by radiologists (d) random false positives at 1 FP/scan
ax ial co ro n al sag it tal
(e) false negatives from the candidate detectors (f) random false negatives at 1 FP/scan
Figure 2: Examples of true positives, false positives, and false negatives from the combined system. Each lesion is located at the center of the 50×50 mm patch in axial, coronal, and sagittal views.
7. Conclusions
We have presented a web-based framework for a fair and automated evaluation of nodule detection al-gorithms, using the largest publicly available data set of chest CT scans in which nodule have been anno-tated by multiple exert human readers. We have shown that combining classical candidate detection algorithms, and analysis of these candidates with convolutional net-works yields excellent results. Finally, we have pro-vided an update to the LIDC-IDRI reference standard that includes additional nodules found by CAD. The LUNA16 challenge will remain open for new submis-sions and can therefore be used as a benchmarking framework for future CT nodule CAD development.
Acknowledgements
The authors acknowledge the National Cancer In-stitute and the Foundation for the National InIn-stitutes of Health, and their critical role in the creation of the free publicly available LIDC-IDRI Database used in this study. This project was funded by a research grant from the Netherlands Organization for Scientific Research, Project No. 639.023.207. ETROCAD team would like to acknowledge the funding agency of Alexan-der A. S´o˜nora, the Belgian Development Cooperation, through the VLIR-UOS program with Universidad de Oriente in Santiago de Cuba.
Table 4: Performance summary of published CAD systems evaluated using LIDC-IDRI data set. Different subsets of scans from LIDC-IDRI data set were used by different research groups. For completeness, number of scans, reference standard criteria, and resulting number of nodules used for evaluation are included in the table. The reported performance at one or two operating points is provided.
CAD systems Year # scans slice
thickness nodules size (mm) agree-ment levels
# nodules sensitivity (%)/FPs/scan
Combined LUNA16 - 888 ≤2.5 ≥3 at least 3 1,186 98.2/4.0 96.9/1.0
Dou et al.(2016) 2016 888 ≤2.5 ≥3 at least 3 1,186 90.7/4.0 84.8/1.0
Setio et al.(2016) 2016 888 ≤2.5 ≥3 at least 3 1,186 90.1/4.0 85.4/1.0
Bergtholdt et al.(2016) 2016 243 - ≥3 at least 1 690 85.9/2.5
-Torres et al.(2015) 2015 949 - ≥3 at least 2 1,749 80.0/8.0
-van Ginneken et al.(2015) 2015 865 ≤2.5 ≥3 at least 3 1,147 76.0/4.0 73.0/1.0
Brown et al.(2014) 2014 108 0.5-3 ≥4 at least 3 68 75.0/2.0
-Choi and -Choi(2013) 2013 58 0.5-3 3-30 at least 1 151 95.3/2.3
-Tan et al.(2013) 2013 360 - ≥3 at least 4 - 83.0/4.0
-Teramoto and Fujita(2013) 2013 84 0.5-3 5-20 at least 1 103 80.0/4.2
-Cascio et al.(2012) 2012 84 1.25-3 ≥3 at least 1 148 97.0/6.1 88.0/2.5
Guo and Li(2012) 2012 85 1.25-3 ≥3 at least 3 111 80.0/7.4 75.0/2.8
Camarlinghi et al.(2011) 2011 69 0.5-2 >3 at least 2 114 80.0/3.0
-Riccardi et al.(2011) 2011 154 0.5-3 ≥3 at least 4 117 71.0/6.5 60.0/2.5
Tan et al.(2011) 2011 125 0.75-3 ≥3 at least 4 80 87.5/4.0
-Messay et al.(2010) 2010 84 1.3-3 ≥3 at least 1 143 82.7/3.0
-References
Aberle, D.R., Adams, A.M., Berg, C.D., Black, W.C., Clapp, J.D., Fagerstrom, R.M., Gareen, I.F., Gatsonis, C., Marcus, P.M., Sicks, J.D., 2011. Reduced lung-cancer mortality with low-dose com-puted tomographic screening. New England Journal of Medicine 365, 395–409.
American Cancer Society, 2016. Cancer facts and figures 2016. Armato, S.G., McLennan, G., Bidaut, L., McNitt-Gray, M.F., Meyer,
C.R., Reeves, A.P., Zhao, B., Aberle, D.R., Henschke, C.I., Hoff -man, E.A., Kazerooni, E.A., MacMahon, H., Beek, E.J.R.V., Yankelevitz, D., Biancardi, A.M., Bland, P.H., Brown, M.S., En-gelmann, R.M., Laderach, G.E., Max, D., Pais, R.C., Qing, D.P.Y., Roberts, R.Y., Smith, A.R., Starkey, A., Batrah, P., Caligiuri, P., Farooqi, A., Gladish, G.W., Jude, C.M., Munden, R.F., Petkovska, I., Quint, L.E., Schwartz, L.H., Sundaram, B., Dodd, L.E., Fen-imore, C., Gur, D., Petrick, N., Freymann, J., Kirby, J., Hughes, B., Casteele, A.V., Gupte, S., Sallamm, M., Heath, M.D., Kuhn, M.H., Dharaiya, E., Burns, R., Fryd, D.S., Salganicoff, M., Anand, V., Shreter, U., Vastagh, S., Croft, B.Y., 2011. The lung image database consortium (LIDC) and image database resource initia-tive (IDRI): a completed reference database of lung nodules on CT scans. Medical Physics 38, 915–931.
Armato, S.G., Roberts, R.Y., Kocherginsky, M., Aberle, D.R., Kaze-rooni, E.A., Macmahon, H., van Beek, E.J.R., Yankelevitz, D., McLennan, G., McNitt-Gray, M.F., Meyer, C.R., Reeves, A.P., P.Caligiuri, Quint, L.E., Sundaram, B., Croft, B.Y., Clarke, L.P., 2009. Assessment of radiologist performance in the detection of lung nodules: dependence on the definition of “truth”. Academic Radiology 16, 28–38.
Armato III, S.G., McLennan, G., Bidaut, L., McNitt-Gray, M.F., Meyer, C.R., Reeves, A.P., Zhao, B., Aberle, D.R., Henschke, C.I., Hoffman, E.A., Kazerooni, E.A., MacMahon, H., van Beek, E.J., Yankelevitz, D., Biancardi, A.M., Bland, P.H., Brown, M.S., En-gelmann, R.M., Laderach, G.E., Max, D., Pais, R.C., Qing, D.P., Roberts, R.Y., Smith, A.R., Starkey, A., Batra, P., Caligiuri, P., Fa-rooqi, A., Gladish, G.W., Jude, C.M., Munden, R.F., Petkovska, I., Quint, L.E., Schwartz, L.H., Sundaram, B., Dodd, L.E.,
Feni-more, C., Gur, D., Petrick, N., Freymann, J., Kirby, J., Hughes, B., Casteele, A.V., Gupte, S., Sallam, M., Heath, M.D., Kuhn, M.H., Dharaiya, E., Burns, R., Fryd, D.S., Salganicoff, M., Anand, V., Shreter, U., Vastagh, S., Croft, B.Y., Clarke, L.P., 2015. Data from LIDC-IDRI.
Bastien, F., Lamblin, P., Pascanu, R., Bergstra, J., Goodfellow, I., Bergeron, A., Bouchard, N., Warde-Farley, D., Bengio, Y., 2012. Theano: new features and speed improvements. arXiv preprint . Bergtholdt, M., Wiemker, R., Klinder, T., 2016. Pulmonary nodule
de-tection using a cascaded SVM classifier, in: Medical Imaging, In-ternational Society for Optics and Photonics. pp. 978513–978513. Brown, M.S., Lo, P., Goldin, J.G., Barnoy, E., Kim, G.H.J., McNitt-Gray, M.F., Aberle, D.R., 2014. Toward clinically usable CAD for lung cancer screening with computed tomography. European Radiology .
Camarlinghi, N., Gori, I., Retico, A., Bellotti, R., Bosco, P., Cerello, P., Gargano, G., Torres, E.L., Megna, R., Peccarisi, M., Fantacci, M.E., 2011. Combination of computer-aided detection algorithms for automatic lung nodule identification. International Journal of Computer Assisted Radiology and Surgery .
Cascio, D., Magro, R., Fauci, F., Iacomi, M., Raso, G., 2012. Auto-matic detection of lung nodules in CT datasets based on stable 3D mass-spring models. Computers in Biology and Medicine . Cerello, P., Cheran, S.C., Bagnasco, S., Bellotti, R., Bolanos, L.,
Catanzariti, E., De Nunzio, G., Fantacci, M.E., Fiorina, E., Gargano, G., et al., 2010. 3-d object segmentation using ant colonies. Pattern Recognition 43, 1476–1490.
Chialvo, D.R., Millonas, M.M., 1995. How swarms build cognitive maps, in: The biology and technology of intelligent autonomous agents. Springer, pp. 439–450.
Choi, W.J., Choi, T.S., 2013. Automated pulmonary nodule detec-tion system in computed tomography images: A hierarchical block classification approach. Entropy 15, 507–523.
Clark, K., Vendt, B., Smith, K., Freymann, J., Kirby, J., Koppel, P., Moore, S., Phillips, S., Maffitt, D., Pringle, M., Tarbox, L., Prior, F., 2013. The cancer imaging archive (TCIA): Maintaining and op-erating a public information repository. Journal of Digital Imaging 26, 1045–1057.
Dieleman, S., Schl¨uter, J., Raffel, C., Olson, E., Sønderby, S.K., Nouri, D., Maturana, D., Thoma, M., Battenberg, E., Kelly, J., et al., 2015. Lasagne: First release. Zenodo: Geneva, Switzerland .
Dietterich, T.G., 2000. Ensemble methods in machine learning, in: Multiple Classifier Systems. Springer Science Heidelberg, pp. 1– 15.
Dou, Q., Chen, H., Yu, L., Qin, J., Heng, P.A., 2016. Multi-level con-textual 3D CNNs for false positive reduction in pulmonary nodule detection. IEEE Transactions on Biomedical Engineering , 1–1. Efron, B., Tibshirani, R.J., 1994. An introduction to the bootstrap.
volume 57. CRC press.
Firmino, M., Morais, A.H., Mendona, R.M., Dantas, M.R., Hekis, H.R., Valentim, R.A., 2014. Computer-aided detection system for lung cancer in computed tomography scans: Review and future prospects. Biomedical Engineering Online 13, 41.
van Ginneken, B., Armato, S.G., de Hoop, B., van de Vorst, S., Duin-dam, T., Niemeijer, M., Murphy, K., Schilham, A.M.R., Retico, A., Fantacci, M.E., Camarlinghi, N., Bagagli, F., Gori, I., Hara, T., Fu-jita, H., Gargano, G., Belloti, R., Carlo, F.D., Megna, R., Tangaro, S., Bolanos, L., Cerello, P., Cheran, S.C., Torres, E.L., Prokop, M., 2010. Comparing and combining algorithms for computer-aided detection of pulmonary nodules in computed tomography scans: the ANODE09 study. Medical Image Analysis 14, 707–722. van Ginneken, B., Setio, A.A.A., Jacobs, C., Ciompi, F., 2015.
Off-the-shelf convolutional neural network features for pulmonary nodule detection in computed tomography scans, in: IEEE Inter-national Symposium on Biomedical Imaging, pp. 286–289. Glorot, X., Bengio, Y., 2010. Understanding the difficulty of training
deep feedforward neural networks., in: Aistats, pp. 249–256. Golosio, B., Masala, G.L., Piccioli, A., Oliva, P., Carpinelli, M.,
Cataldo, R., Cerello, P., De Carlo, F., Falaschi, F., Fantacci, M.E., Gargano, G., Kasae, P., Torsello, M., 2009. A novel multithresh-old method for nodule detection in lung CT. Medical Physics 36, 3607–3618.
Guo, W., Li, Q., 2012. High performance lung nodule detection schemes in CT using local and global information. Medical Physics 39, 5157–5168.
He, K., Zhang, X., Ren, S., Sun, J., 2015a. Deep residual learning for image recognition. arXiv:1512.03385 .
He, K., Zhang, X., Ren, S., Sun, J., 2015b. Delving deep into rec-tifiers: Surpassing human-level performance on imagenet classifi-cation, in: Proceedings of the IEEE International Conference on Computer Vision, pp. 1026–1034.
Henschke, C.I., Yankelevitz, D.F., Mirtcheva, R., McGuinness, G., McCauley, D., Miettinen, O.S., 2002. CT screening for lung can-cer: Frequency and significance of part-solid and nonsolid nodules. American Journal of Roentgenology 178, 1053–1057.
Hinton, G.E., Srivastava, N., Krizhevsky, A., Sutskever, I., Salakhut-dinov, R.R., 2012. Improving neural networks by preventing co-adaptation of feature detectors. arXiv preprint .
International Commission on Radiation Units and Measurements, 2008. Receiver operating characteristic analysis in medical imag-ing. Journal of the ICRU 8, 1–62.
Jacobs, C., van Rikxoort, E.M., Twellmann, T., Scholten, E.T., de Jong, P.A., Kuhnigk, J.M., Oudkerk, M., de Koning, H.J., Prokop, M., Schaefer-Prokop, C., van Ginneken, B., 2014. Au-tomatic detection of subsolid pulmonary nodules in thoracic com-puted tomography images. Medical Image Analysis 18, 374–384. Jacobs, C., van Rikxoort, E.M., Murphy, K., Prokop, M.,
Schaefer-Prokop, C.M., van Ginneken, B., 2016. Computer-aided detec-tion of pulmonary nodules: a comparative study using the public LIDC/IDRI database. European Radiology .
Karpathy, A., Toderici, G., Shetty, S., Leung, T., Sukthankar, R., Fei-Fei, L., 2014. Large-scale video classification with convolutional
neural networks, in: Computer Vision and Pattern Recognition (CVPR), 2014 IEEE Conference on, IEEE. pp. 1725–1732. Kazerooni, E.A., Austin, J.H., Black, W.C., Dyer, D.S., Hazelton,
T.R., Leung, A.N., McNitt-Gray, M.F., Munden, R.F., Pipavath, S., 2014. ACR–STR practice parameter for the performance and reporting of lung cancer screening thoracic computed tomography (CT). Journal of Thoracic Imaging 29, 310–316.
Kuhnigk, J.M., Dicken, V., Bornemann, L., Bakai, A., Wormanns, D., Krass, S., Peitgen, H.O., 2006. Morphological segmentation and partial volume analysis for volumetry of solid pulmonary lesions in thoracic CT scans. IEEE Transactions on Medical Imaging 25, 417–434.
Li, Q., Arimura, H., Doi, K., 2004. Selective enhancement filters for lung nodules, intracranial aneurysms, and breast microcalcifi-cations, in: International Congress Series, Elsevier. pp. 929–934. Li, Q., Sone, S., Doi, K., 2003. Selective enhancement filters for
nodules, vessels, and airway walls in two- and three-dimensional CT scans. Medical Physics 30, 2040–2051.
Manos, D., Seely, J.M., Taylor, J., Borgaonkar, J., Roberts, H.C., Mayo, J.R., 2014. The lung reporting and data system (lu-rads): a proposal for computed tomography screening. Canadian Associ-ation of Radiologists Journal 65, 121–134.
Messay, T., Hardie, R.C., Rogers, S.K., 2010. A new computation-ally efficient CAD system for pulmonary nodule detection in CT imagery. Medical Image Analysis 14, 390–406.
Murphy, K., van Ginneken, B., Schilham, A.M.R., de Hoop, B.J., Gi-etema, H.A., Prokop, M., 2009. A large scale evaluation of au-tomatic pulmonary nodule detection in chest CT using local im-age features and k-nearest-neighbour classification. Medical Im-age Analysis 13, 757–770.
Naidich, D.P., Bankier, A.A., MacMahon, H., Schaefer-Prokop, C.M., Pistolesi, M., Goo, J.M., Macchiarini, P., Crapo, J.D., Herold, C.J., Austin, J.H., Travis, W.D., 2013. Recommendations for the man-agement of subsolid pulmonary nodules detected at CT: a state-ment from the fleischner society. Radiology 266, 304–317. Niemeijer, M., Loog, M., Abr`amoff, M.D., Viergever, M.A., Prokop,
M., van Ginneken, B., 2011. On combining computer-aided detec-tion systems. IEEE Transacdetec-tions on Medical Imaging 30, 215–223. Prasoon, A., Petersen, K., Igel, C., Lauze, F., Dam, E., Nielsen, M., 2013. Deep feature learning for knee cartilage segmentation us-ing a triplanar convolutional neural network, in: Medical Image Computing and Computer-Assisted Intervention–MICCAI 2013, Springer. pp. 246–253.
Retico, A., Delogu, P., Fantacci, M.E., Gori, I., Martinez, A.P., 2008. Lung nodule detection in low-dose and thin-slice computed tomog-raphy. Computers in Biology and Medicine 38, 525–534. Retico, A., Fantacci, M.E., Gori, I., Kasae, P., Golosio, B., Piccioli,
A., Cerello, P., De Nunzio, G., Tangaro, S., 2009. Pleural nodule identification in low-dose and thin-slice lung computed tomogra-phy. Computers in Biology and Medicine 39, 1137–1144. Riccardi, A., Petkov, T.S., Ferri, G., Masotti, M., Campanini, R.,
2011. Computer-aided detection of lung nodules via 3D fast radial transform, scale space representation, and Zernike MIP classifica-tion. Medical Physics 38, 1962–1971.
van Rikxoort, E.M., de Hoop, B., Viergever, M.A., Prokop, M., van Ginneken, B., 2009. Automatic lung segmentation from thoracic computed tomography scans using a hybrid approach with error detection. Medical Physics 36, 2934–2947.
Ronneberger, O., Fischer, P., Brox, T., 2015. U-net: Convolutional networks for biomedical image segmentation. arXiv:150504597 . Setio, A.A.A., Ciompi, F., Litjens, G., Gerke, P., Jacobs, C., van Riel,
S., Wille, M.W., Naqibullah, M., Sanchez, C., van Ginneken, B., 2016. Pulmonary nodule detection in CT images: false positive reduction using multi-view convolutional networks. IEEE Trans-actions on Medical Imaging .
Setio, A.A.A., Jacobs, C., Gelderblom, J., van Ginneken, B., 2015. Automatic detection of large pulmonary solid nodules in thoracic CT images. Medical Physics 42, 5642–5653.
Sutskever, I., Martens, J., Dahl, G., Hinton, G., 2013. On the im-portance of initialization and momentum in deep learning, in: Pro-ceedings of the 30th international conference on machine learning (ICML-13), pp. 1139–1147.
Szegedy, C., Liu, W., Jia, Y., Sermanet, P., Reed, S., Anguelov, D., Erhan, D., Vanhoucke, V., Rabinovich, A., 2014. Going deeper with convolutions. arXiv:14094842v1 .
Tan, M., Deklerck, R., Cornelis, J., Jansen, B., 2013. Phased search-ing with neat in a time-scaled framework: Experiments on a computer-aided detection system for lung nodules. Artificial In-telligence in Medicine .
Tan, M., Deklerck, R., Jansen, B., Bister, M., Cornelis, J., 2011. A novel computer-aided lung nodule detection system for CT images. Medical Physics 38, 5630–5645.
Teramoto, A., Fujita, H., 2013. Fast lung nodule detection in chest CT images using cylindrical nodule-enhancement filter. International Journal of Computer Assisted Radiology and Surgery , 1–13. Tieleman, T., Hinton, G., 2012. Lecture 6.5-rmsprop: Divide the
gra-dient by a running average of its recent magnitude. COURSERA: Neural Networks for Machine Learning 4.
Torres, E.L., Fiorina, E., Pennazio, F., Peroni, C., Saletta, M., Camar-linghi, N., Fantacci, M.E., Cerello, P., 2015. Large scale validation of the M5L lung CAD on heterogeneous CT datasets. Medical Physics 42, 1477–1489.
Wen, Y., Zhang, K., Li, Z., Qiao, Y., 2016. A discriminative feature learning approach for deep face recognition, in: European Confer-ence on Computer Vision, Springer. pp. 499–515.
Xu, K., Ba, J., Kiros, R., Cho, K., Courville, A., Salakhutdinov, R., Zemel, R.S., Bengio, Y., 2015. Show, attend and tell: Neural image caption generation with visual attention. arXiv preprint 2, 5. Zagoruyko, S., Komodakis, N., 2016. Wide residual networks. arXiv