Original Article
Logistic regression analysis of
texture features of thyroid calcification
based on computed tomography images
Kexin Chen1, Jiaxing Chen1, Yijia Qian1, Meng Ye1, Lu Xu1, Shanshan Chen1, Chenbin Liu2, Yihong Chen3,
Wenxian Peng1
1College of Medical Imaging, Shanghai University of Medicine and Health Sciences, Shanghai 201318, China; 2Chinese Academy of Medical Science (CAMS) Shenzhen Cancer Hospital, Radiation Oncology, Shenzhen 518116, China; 3College of Medical Imaging, Hangzhou Medical College, Hangzhou 310013, Zhejiang, China Received July 29, 2019; Accepted December 3, 2019; Epub January 15, 2020; Published January 30, 2020
Abstract: Objective: To explore the value of computed tomography (CT) texture features in differentiating benign and malignant thyroid calcified nodules by using a logistic regression model. Methods: The non-contrast CT images of 60 patients pathologically diagnosed with thyroid calcification were selected. The size of the reconstruction field of view is 70 millimeters. One rectangle region of interest (ROI) covering thyroid calcifications was manually delineated for each CT image by a radiologist. The texture features, including mean pixel intensity, standard deviation (SD), maximum intensity, minimum intensity, skewness, kurtosis, were measured in the ROI. The diagnostic value of CT texture features were analyzed statistically and the logistic model was established. Results: There was no signifi -cant difference in maximum intensity between benign and malignant calcified nodules using Student’s t test (P > 0.05). The mean pixel intensity, SD, minimum intensity, skewness and kurtosis were significantly different between benign and malignant calcified nodules (P < 0.05). According to the results of logistic regression analysis, the ac-curacy, sensitivity, specificity and area under receiver operating curve (AUC) are 0.833, 0.875, 0.893 and 0.951, respectively. Conclusions: Logistic regression model created in this study can be implied well in differentiating the malignancy of thyroid calcified nodule based on CT texture features.
Keywords: Computed tomography, thyroid, calcification, texture feature
Introduction
Thyroid nodule calcification is a common sign of thyroid disease, and calcification is signifi -cantly correlated with malignant tumors [1],
accounting for 49.6-78.8% of malignant nod
-ules, and 15.7-38.7% of benign nodules [2].
The reference standard for the clinical
diagno-sis of thyroid nodules is fine-needle aspiration biopsy. However, fine-needle aspiration biopsy
is invasive, resulting in physical and psychologi-cal harm to the patients [3]. Imaging examina-tion methods such as scintigraphy,
ultrasonog-raphy (US), CT, and magnetic resonance (MRI)
are currently used to evaluate thyroid nodules but they cannot reliably differentiate benign from malignant lesions [4, 5]. CT is one of the common imaging examination methods to
diag-nose the nature of thyroid calcification nodules,
and the image characteristics of thyroid calcifi -cations are closely related to the pathological results [6]. Naturally, CT images contain sub-stantial objective information, with clinical val-ues which the naked eyes may be unable to identify.
In previous studies, mathematical methods were used to intuitively describe the distribu-tion and change rules of image pixels, and quantitative parameters are used to evaluate the image [7]. With the gradual maturity of machine learning algorithm systems, texture analysis technology is an important part of computer-aided diagnosis system, and has ex-
tensive research value [8]. Some researchers
texture parameters in the diagnosis of thyroid cancer [9]. These studies used CT images re-
constructed using a conventional field of view
(FOV) (22~25 cm). It is not clear that if CT ima- ges with small FOV have high diagnostic value
in identifying thyroid calcification. In addition,
there are no reports discussing the relationship
between the texture characteristics of calcified
nodules and the differentiation between benign and malignant, or combining the texture
char-acteristics parameters of multiple calcified
no-dules for analysis.
The purpose of this study was to investigate the
value of CT calcified texture features in differ
-entiating benign and malignant thyroid calcifi -cation nodules by logistic regression analysis. Materials and methods
Clinical data
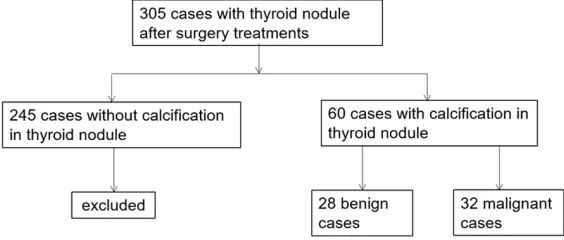
A retrospective review was performed on all 305 patients who underwent small imaging
FOV plain scanning in the First People’s Hospi-tal in Hangzhou from January 2016 and June 2018. We excluded 245 cases without thyroid calcification, we identified 60 cases with calcifi -cation in the study group (Figure 1), including
28 cases with benign nodules and 32 cases
with malignant ones (39 women and 21 men). The age ranged from 24 to 72 years, with a mean age of 50 (standard deviation, ±14
years). A typical calcified nodule was selected
from CT images for each patient. Inclusion cri-teria are as follows: 1) incidental thyroid nod-ules; 2) without surgery or puncture biopsy; 3) no severe image artifact affecting observation
and measurement; 4) definite pathological
dia-gnosis. The study was approved by the
institu-tional review board of the Hangzhou First
Peo-lie in supine position with the neck extended as long as possible, and the scan range was from the oropharynx to the upper clavicle. The cross-sectional image of plain CT was selected,
with the field of view (FOV) size of 70 millime -ters and the image format was Digital Imaging and Communications in Medicine (DICOM). The scan parameters were: tube voltage 120 kV; tube current automatic regulation; 2~3 millime-ter cross-sectional thickness; 2~3 millimemillime-ter
cross-sectional distance; scan pitch 0.875; and
16×0.625 millimeter collimation.
Image analysis and data processing
The images were independently assessed by two radiologists. If the radiologists disagreed with each other, a senior radiologist would be invited to review the thyroid CT images and
make final examination. Software of ImageJ 18.0 was used to extract the rectangle ROI cov
-ering thyroid calcification. If more than one cal
-cification nodule was found in one patient, the most characteristic calcification nodules in CT
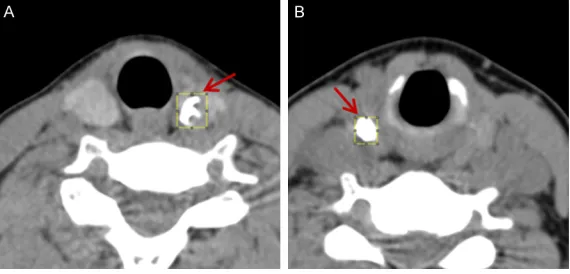
images were selected (Figure 2). The following texture features of CT images were evaluated: mean pixel value, maximum intensity, minimum intensity, skewness, kurtosis, and standard deviation (SD) of pixel distribution.
Statistical analysis
[image:2.612.91.373.75.195.2]Statistical analysis of the results was per-formed with SPSS 17.0. The Independent t test was used to determine the value of the mea-sured data of six CT texture features in differen-tiating benign and malignant thyroid nodules. Binary logistic regression analysis was used to assess the association between the pathologic diagnosis and CT texture parameters. A logistic regression model was established according to
Figure 1. Flowchart of study population.
ple’s Hospital, and informed
consent was waived since this research was a retrospective study and the patient infor- mation was removed before processing.
Equipment and methods
the results of logistic regression analysis. The accuracy of the model can be obtained by test-ing the data of sixty ROIs. The ROC curve was obtained according to the results of binary logistic regression analysis. The accuracy, the
sensitivity, specificity and AUC of benign and malignant thyroid diagnosis were analyzed.
Results
Comparison of benign and malignant thyroid nodules
The six image features were compared between benign and malignant thyroid nodules by inde-pendent t test (Table 1). The maximum
intensi-ty has no significant difference between two
groups (P = 0.280). The mean intensity, stan -dard deviation, minimum intensity, skewness
and kurtosis have significant differences (P < 0.05). Skewness, Kurtosis and SD in the benign group are greater than the ones in the malig-nant group. Nevertheless, mean and minimum intensity are less than the malignant group.
Logistic regression analysis
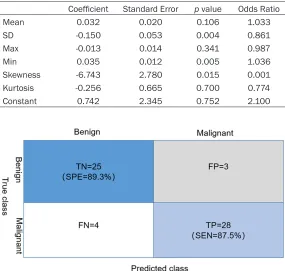
The pathology results of benign and malignant thyroid nodules were used as dependent vari-ables, and the six CT characteristic features were used as covariate variables. During logis-tic regression analysis, variable selection strat-egies including enter, forward, backward and stepwise were used and the strategy of enter was chosen for this method outperforming other strategies after comparing results. Based on the enter strategy, all the features were
forced into the model. A satisfied fit model was
achieved (Nagelkerke R Square = 0.764, -2Log
parameters are, the greater the possibility of
malignancy is, and the odds ratio is 0.861,
1.036 and 0.001, respectively; indicating that
the three data sizes, the probability of malig
-nancy is 0.861, 1.036 and 0.001 times of the
probability of benign nodules.
From the Table 2, we set up a logistic regres-sion equation (equation 1). The cut value is 0.5. If y is greater than 0.5, it was considered as malignant nodule. Otherwise, it was considered as benign. We presented the confusion matrix (Figure 3) to show the performance of the logistic regression model. The sensitivity and
specificity and accuracy were 0.875, 0.89.3 and 0.833, respectively. The model performed
effectively to discriminate benign nodules from malignant ones.
logit(y) = 0.742-0.15x1+0.035x2-6.743x3 (1) Here, x1, x2 and x3 indicate SD, minimum inten-sity and skewness respectively. Here, y is the predicted probability of the logistic regression model.
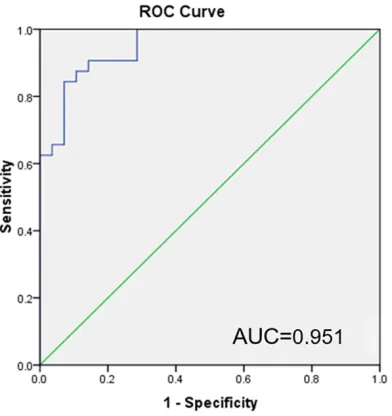
To evaluate the performance of logistic re- gression model, we applied the ROC curve to calculate the area of under the ROC curve. We achieved the predicted value by choosing prob-ability option on the save panel of SPSS. The label and probability were applied to make the
ROC curve, and the AUC was calculated (Figure 4).
Discussion
[image:3.612.91.376.72.209.2]Thyroid nodule calcification refers to the calci -um deposition in thyroid nodules. Calcification
Figure 2. Typical calcified thyroid nodules. A. The goiter nodules of the left thyroid gland are associated with gross calcification. B. Papillary thyroid car -cinoma with interstitial fibrosis and gross calcification at the right. Red arrow indicates the regions of interest.
likelihood = 31.956), and va- riables in the equation were shown in Table 2. Wald chi-square test for the corre-sponding p value, indicates
that there is no significant dif -ference in mean intensity, maximum intensity and kur-tosis (P > 0.05), but there is
significant difference in stan -dard deviation, minimum and skewness (P < 0.05). The
regression coefficients of
is rare in benign thyroid diseases, usually due
to nodular wall calcification or fibrous septal calcification after the absorption of inflamma -tion and hematoma. In tradi-tional clinical prac-tice, ultrasound is often used to examine the thyroid gland. In the aspect of ultrasound, there
have been studies on automatic identification of thyroid nodules and automatic identification of vascularization within the boundary [10-12].
However, such studies using CT are still imma-ture [13, 14].
CT can also distinguish benign from malignant
thyroid nodules [4, 15]. In terms of calcification,
the current study by Liu W et al. shows that
cal-cification has a high detection rate in malignant
analyze the texture of calcification. Texture
analysis refers to the process of extracting tex-ture featex-ture parameters through certain image processing technology so as to obtain quantita-tive or qualitaquantita-tive description of texture. At present, studies have shown that dynamic en-
hanced liver texture analysis is of significance
in the preliminary evaluation of colorectal
can-cer [18, 19]. In our study, texture analysis was used for thyroid calcification, where pixel value
represents the number of pixels contained in the image. The higher the value is, the greater
intensity the calcification will be, which is asso -ciated to the pathologic type of thyroid nodule. Skewness, kurtosis and standard deviation can
[image:4.612.91.521.83.152.2]reflect the distribution of pixel value. In this Table 1. Statistical comparison of benign and malignant thyroid nodules characteristics
Mean (HU) SD (HU) Min (HU) Max (HU) Skewness Kurtosis
Benign 120.9±156.2 203.0±142.6 -152.6±370.9 703.6±411.9 1.0±1.1 1.3±2.4 Malignant 214.2±105.7 134.5±108.6 17.5±73.8 587.8±409.1 0.6±0.7 0.1±2.0
t value -2.736 2.107 -2.385 1.090 2.010 2.031
p value 0.008 0.039 0.024 0.280 0.049 0.047
[image:4.612.87.375.191.470.2]HU: Hounsfield unit.
Table 2. Variables in the equation on logistic regression analysis Coefficient Standard Error p value Odds Ratio
Mean 0.032 0.020 0.106 1.033
SD -0.150 0.053 0.004 0.861
Max -0.013 0.014 0.341 0.987
Min 0.035 0.012 0.005 1.036
Skewness -6.743 2.780 0.015 0.001
Kurtosis -0.256 0.665 0.700 0.774
Constant 0.742 2.345 0.752 2.100
Figure 3. Confusion matrix of logistic model performance. FP indicates false positive; TP true positive; FN false negative; TN true negative; SEN sensitivity; SPE specificity.
nodules. Han Z et al.
previous-ly used calcification signs in the identification of nodular
goiter in the accuracy of
79.5%. In this experiment, the
accuracy rate of identifying benign and malignant thyroid gland tissue was increased to
87.5% [16]. By establishing a
Logistic model to compare with benign nodules, malig-nant thyroid nodules have a
higher rate of calcification, and calcification mostly
occ-urs in the interior of nodules. In addition, in the study on the
types of thyroid calcification, a study showed that fine-gr-ained calcification in thyroid
nodules is an important sign of CT diagnosis of thyroid ma- lignant nodules, and
coarse-grained calcification in thyroid
nodules is an important sign of CT diagnosis of benign thy-roid nodules [17]. Most
[image:4.612.90.375.195.466.2]study, it was found by independent sample t
test that skewness, kurtosis, minimum value, average pixel value and standard deviation of pixel distribution were of certain value in beni- gn and malignant thyroid, while the maximum
value of CT showed no significant difference
in benign and malignant thyroid nodules (P > 0.05).
Logistic regression, also known as logistic
regression analysis, is a generalized linear
regression analysis model, commonly used in data mining, automatic diagnosis of diseases,
economic forecasting and other fields. For
example, to discuss the risk factors of causing diseases and predict the probability of occur-rence of diseases based on the risk factors [20-23]. Therefore, in this experiment, logistic regression analysis was carried out on the parameters obtained from texture analysis, and Logistic model (equation 1) was obtained. The maximum approximation index was ob-
tained through the obtained specificity and
sensitivity. When Y is greater than this value, the probability of thyroid nodule being malig-nant is high. When Y is less than this value, thy-roid nodules are more likely to be benign. Due
to the difficulty in data collection, the sample size in this study is small. The thyroid calcifica
-tion was not classified, and the size of thyroid calcification was different, leading to the incon
-sistent size of the selected area, which may have some impact on the classification results,
which is the deficiency of this study. Finally, in
the validation part of the model, this experi-ment only used the internal validation, and the obtained validation data is not comprehensive and rigorous enough. In the next step, we will
collect new data, continue external verification
of the established Logistic model, evaluate the model more comprehensively, and further im- prove the experiment.
Based on logistic regression model, this
experi-ment carried out texture analysis of calcified
nodules in CT images under small FOV scan of thyroid gland to provide reference opinions for the diagnosis of benign and malignant thyroid nodules, which has certain value in thyroid nod-ule diagnosis.
Acknowledgements
We would like to thank the National Major
Scientific Instruments Development Project
(2013YQ170463) for their funding. Disclosure of conflict of interest
None.
Address correspondence to: Wenxian Peng,College of Medical Imaging, Shanghai University of Medicine and Health Sciences, Shanghai 201318, China. Tel: +86-18805712978; E-mail: [email protected]
References
[1] Kim BK, Choi YS, Kwon HJ, Lee JS, Heo JJ, Han YJ, Park YH and Kim JH. Relationship between patterns of calcification in thyroid nodules and histopathologic findings. Endocr J 2013; 60: 155-60.
[2] Peng W, Liu C, Xia S, Shao D, Chen Y, Liu R and Zhang Z. Thyroid nodule recognition in com-puted tomography using first order statistics. Biomed Eng Online 2017; 16: 67.
[3] Baloch ZW, Fleisher S, LiVolsi VA and Gupta PK. Diagnosis of “follicular neoplasm”: a gray zone in thyroid fine-needle aspiration cytology. Diagn Cytopathol 2002; 26: 41-4.
[4] Nakadate M, Yoshida K, Ishii A, Koizumi M, Tochigi N, Suzuki Y, Ryu Y, Nakagawa T, Ume -hara I and Shibuya H. Is 18F-FDG PET/CT use -ful for distinguishing between primary thyroid lymphoma and chronic thyroiditis. Clin Nucl Med 2013; 38: 709-14.
[5] Lassau N, Estienne T, de Vomecourt P, Azoulay M, Cagnol J, Garcia G, Majer M, Jehanno E, Renard-Penna R, Balleyguier C, Bidault F,
[image:5.612.92.288.72.280.2]mella C, Jacques T, Dubrulle F, Behr J, Pous-sange N, Bocquet J, Montagne S, Cornelis F, Faruch M, Bresson B, Brunelle S, Jalaguier-Coudray A, Amoretti N, Blum A, Paisant A, Her-reros V, Rouviere O, Si-Mohamed S, Di Marco L, Hauger O, Garetier M, Pigneur F, Bergère A, Cyteval C, Fournier L, Malhaire C, Drape JL, Poncelet E, Bordonne C, Cauliez H, Budzik JF, Boisserie M, Willaume T, Molière S, Peyron Faure N, Caius Giurca S, Juhan V, Caramella T, Perrey A, Desmots F, Faivre-Pierre M, Abitbol M, Lotte R, Istrati D, Guenoun D, Luciani A, Zins M, Meder JF and Cotten A. Five simultane-ous artificial intelligence data challenges on ultrasound, CT, and MRI. Diagn Interv Imaging 2019; 100: 199-209.
[6] Liu W, Dong X, Zhu C, Yang J, Yang J, Shao K, Yuan L, Chen H, Lu W and Zhu Y. Association between computed tomography-detected cal-cification and thyroid carcinoma. Neoplasma 2015; 62: 641-5.
[7] Liu C, Chen S, Yang Y, Shao D, Peng W, Wang Y, Chen Y and Wang Y. The value of the computer-aided diagnosis system for thyroid lesions based on computed tomography images. Quant Imaging Med Surg 2019; 9: 642-653. [8] Song G, Xue F and Zhang C. A model using
tex-ture featex-tures to differentiate the natex-ture of thy-roid nodules on sonography. J Ultrasound Med 2015; 34: 1753-60.
[9] Schob S, Meyer HJ, Dieckow J, Pervinder B, Pazaitis N, Höhn AK, Garnov N, Horvath-Rizea D, Hoffmann KT and Surov A. Histogram analy-sis of diffusion weighted imaging at 3T is use-ful for prediction of lymphatic metastatic spread, proliferative activity, and cellularity in thyroid cancer. Int J Mol Sci 2017; 18.
[10] Bibicu D, Moraru L and Biswas A. Thyroid nod-ule recognition based on feature selection and pixel classification methods. J Digit Imaging 2013; 26: 119-28.
[11] Acharya UR, Faust O, Sree SV, Molinari F and Suri JS. ThyroScreen system: high resolution ultrasound thyroid image characterization into benign and malignant classes using novel combination of texture and discrete wavelet transform. Comput Methods Programs Biomed 2012; 107: 233-41.
[12] Keramidas EG, Maroulis D and Iakovidis DK. ΤND: a thyroid nodule detection system for analysis of ultrasound images and videos. J Med Syst 2012; 36: 1271-81.
[13] Baek HJ, Kim DW, Lee YJ, Choo HJ, Ahn HS, Lim HK and Ryu JH. Diagnostic accuracy of computed tomography for differentiating dif-fuse thyroid disease from normal thyroid pa-renchyma: a multicenter study. PLoS One 2018; 13: e0205507.
[14] Lee KH, Kim DW, Baek JW, Lee YJ, Choo HJ, Cho YJ, Lee SJ, Park YM, Jung SJ and Baek HJ. Comparison of computed tomography features between follicular neoplasm and nodular hy-perplasia. Cancer Imaging 2016; 16: 31. [15] Gao SY, Zhang XY, Wei W, Li XT, Li YL, Xu M, Sun
YS and Zhang XP. Identification of benign and malignant thyroid nodules by in vivo iodine concentration measurement using single-so- urce dual energy CT: a retrospective diagnostic accuracy study. Medicine (Baltimore) 2016; 95: e4816.
[16] Zhu D, Chen W, Xiang J and Han Z. Diagnostic value of CT artifacts for solitary coarse calcifi -cations in thyroid nodules. Int J Clin Exp Med 2015; 8: 5800-5805.
[17] Zhang LX, Xiang JJ, Wei PY, Ding JW, Luo DC, Peng ZY and Han ZJ. Diagnostic value of com-puted tomography (CT) histogram analysis in thyroid benign solitary coarse calcification nod -ules. J Zhejiang Univ Sci B 2018; 19: 211-217. [18] Ganeshan B, Burnand K, Young R, Chatwin C
and Miles K. Dynamic contrast-enhanced tex-ture analysis of the liver: initial assessment in colorectal cancer. Invest Radiol 2011; 46: 160-168.
[19] Ng F, Ganeshan B, Kozarski R, Miles KA and Goh V. Assessment of primary colorectal can-cer heterogeneity by using whole-tumor texture analysis: contrast-enhanced CT texture as a biomarker of 5-year survival. Radiology 2013; 266: 177-184.
[20] Norton EC, Dowd BE and Maciejewski ML. Mar-ginal effects-quantifying the effect of changes in risk factors in logistic regression models. JAMA 2019; 321: 1304-1305.
[21] Hughes G, Choudhury RA and McRoberts N. Summary measures of predictive power asso-ciated with logistic regression models of dis-ease risk. Phytopathology 2019; 109: 712-715.
[22] Hsieh MH, Sun LM, Lin CL, Hsieh MJ, Hsu CY and Kao CH. Development of a prediction mod-el for pancreatic cancer in patients with type 2 diabetes using logistic regression and artificial neural network models. Cancer Manag Res 2018; 10: 6317-6324.