Developing Process Mining Tools
An Implementation of Sequence Clustering for ProM
Gabriel Martins Veiga
Dissertation for the degree of
Master of Science in Information Systems and
Computer Engineering
Jury
President: Prof. Jos´e Tribolet
Supervisor: Prof. Diogo R. Ferreira
Committee: Prof. Andreas Wichert
Acknowledgments
To my family, especially my parents and my brother who always supported me and made my academic path possible.
To Prof. Diogo Ferreira for his excellent orientation and availability to help. His suggestions and guidance given throughout this year greatly improved the value of this dissertation.
To the other members of our research group, namely Pedro Martins and Gil Aires for the support given and for the exchange of ideas that occurred during this past year.
Abstract
The goal of process mining is to extract useful information from event logs that record the activities an organization performs. There are many process mining techniques to discover a process model, based on some event log. These techniques perform well on structured processes, but have problems with less structured ones. In this case the logs are very confusing and have high quantities of noise, making it difficult to extract useful information. The models generated for such logs tend to be difficult to read and contain unrelated behavior.
In this work we present an approach that aims at overcoming these difficulties by extracting only the useful data and presenting it in an understandable manner. For this purpose sequence clustering algorithms are used to cluster the log into smaller logs (clusters) that correspond to a set of related cases. For each cluster, a model in the form of a Markov chain is presented. A preprocessing stage was also developed, to clean the log of certain irrelevant elements that complicate the models generated.
The approach was fully implemented in the ProM framework and all the experiments were per-formed in that environment. Taking into account the results achieved for a real-world case study and the results of several experiments, we conclude that the approach is capable of dealing with complex logs, eliminating unnecessary behavior and partitioning different types of behavior into more understandable models. We also conclude that the sequence clustering algorithm provides good results when compared to other clustering methods to divide sequences in a process mining context.
Keywords
Process Mining, Preprocessing, Sequence Clustering, ProM, Markov Chains, Event Logs, Hierar-chical Clustering, Process Models
Resumo
O objectivo da extrac¸c˜ao de processos ´e obter informa¸c˜ao relevante a partir dos logs de eventos que registam as actividades executadas numa organiza¸c˜ao. Existem v´arias t´ecnicas nesta ´area que a partir desses logs geram modelos de processos. Estas t´ecnicas apresentam bons resultados em processos bem estruturados, mas tˆem problemas quando aplicadas a processos pouco estruturados. Nestes casos os logs s˜ao muito confusos e tˆem uma grande quantidade de ru´ıdo, dificultando a
extrac¸c˜ao de informa¸c˜ao ´util. Para estes logs, o modelo gerado ´e dif´ıcil de compreender e poder´a
incluir comportamento de casos bastante distintos.
Neste trabalho apresentamos uma abordagem que visa ultrapassar estas dificuldades, extraindo apenas a informa¸c˜ao relevante e apresentando-a de forma leg´ıvel. Para isso algoritmos de clustering de sequˆencias s˜ao utilizados para dividir o log em logs mais pequenos (clusters) que correspondem a um conjunto de casos relacionados. Para cada cluster, um modelo em forma de cadeia de Markov ´e apresentado. Tamb´em se desenvolveu uma fase de pr´e-processamento, para limpar o log de elementos que poder˜ao complicar desnecessariamente os modelos obtidos.
A abordagem foi implementada na ferramenta ProM e todas as experiˆencias foram executadas nesse ambiente. Tendo em conta os resultados obtidos num caso de estudo real e os resultados de diversas experiˆencias, conclui-se que a abordagem ´e capaz de lidar com logs complexos, eliminando comportamento desnecess´ario e dividindo diferentes tipos de comportamento em modelos mais compreens´ıveis. Tamb´em se conclui que o algoritmo de clustering de sequˆencias apresenta bons resultados quando comparado a outros algoritmos de clustering ao dividir sequˆencias no contexto da extrac¸c˜ao de processos.
Palavras Chave
Extrac¸c˜ao de Processos, Pr´e-processamento, Clustering de Sequˆencias, ProM, Cadeias de Markov, Logs de Eventos, Clustering Hier´arquico, Modelos de Processos
Contents
1 Introduction 1
1.1 Process Mining . . . 1
1.2 Motivation . . . 2
1.3 Organization . . . 2
2 Process Mining Tools 5 2.1 ProM . . . 5
2.2 Mining Tools . . . 7
2.3 Analysis Tools . . . 9
2.4 Process Mining with Clustering . . . 10
2.5 Trace Clustering Approach for Process Mining . . . 10
2.6 Conclusion . . . 13
3 Sequence Clustering for ProM 15 3.1 Sequence Clustering . . . 15
3.2 Applications of Sequence Clustering . . . 18
3.3 Preprocessing . . . 18
3.4 Implementation within ProM . . . 20
3.4.1 Preprocessing Stage . . . 21
3.5 Hierarchical Clustering . . . 24
3.6 Conclusion . . . 24
4 Experiments and Evaluation 27 4.1 Issue Handling Process . . . 27
4.2 Patient Treatment Process . . . 31
4.3 Telephone Repair Process: Comparing Clustering Methods . . . 36
5 Case Study: Application Server Logs 39 5.1 Case study description . . . 39
5.2 Log Structure . . . 41
5.3 Preprocessing stage . . . 42
5.4 Sequence Clustering results . . . 42
6 Conclusion 47 6.1 Main contributions . . . 47
6.2 Future work . . . 48
List of Figures
2.1 Overview of the ProM Framework (adapted from [1]) . . . 6
2.2 MXML Snapshot . . . 7
2.3 Process Model of the example log . . . 9
2.4 DWS mining result . . . 11
2.5 Trace Clustering result . . . 12
2.6 Process Model for cluster (1,1) . . . 13
3.1 Example of a cluster model (Markov Chain) displayed in the sequence clustering plug-in . . . 16
3.2 Markov chain – Matrix representation . . . 16
3.3 Sequence Clustering plug-in in the ProM framework . . . 20
3.4 Preprocessing stage for the Sequence Clustering plug-in . . . 22
3.5 Cluster Inspection in the Sequence Clustering plug-in . . . 23
3.6 Cluster model with no threshold . . . 23
3.7 Cluster model with an edge threshold of 0.06 . . . 24
4.1 Model for the initial log of the issue handling process . . . 28
4.2 Sequences present in the log of the Issue Handling Process . . . 29
4.3 Cluster 1: Issue Handling Process . . . 29
4.4 Cluster 2: Issue Handling Process . . . 29
4.6 Cluster 4: Issue Handling Process . . . 30
4.7 Cluster 3.1: Issue Handling Process . . . 30
4.8 Cluster 3.2: Issue Handling Process . . . 31
4.9 Model for the initial log of the Patient Treatment Process . . . 32
4.10 Events present in the log of the Patient Treatment Process . . . 34
4.11 Sequences present in the log of the Patient Treatment Process . . . 34
4.12 Cluster 1: Patient Treatment Process . . . 35
4.13 Cluster 2: Patient Treatment Process . . . 35
4.14 Cluster 3: Patient Treatment Process . . . 35
5.1 System infrastructure of a public institution . . . 40
5.2 Application Server Logs Snapshot . . . 41
5.3 Spaghetti model obtained from the application server logs using the heuristics miner. 43 5.4 Events related with exceptions in the application server logs . . . 44
5.5 Some of the behavioral patterns discovered from the application server logs using the sequence clustering plug-in. . . 46
List of Tables
2.1 Example of an event log with 70 process instances, for the process of patient care in a hospital (A: Register patient, B: Contact family doctor, C: Treat patient, D:
Give prescription to the patient, E: Discharge patient) . . . 8
4.1 Correspondence between letters and events . . . 33
4.2 Complexity metrics of the process models from the clusters generated by the three
CHAPTER
1
Introduction
The growing demand for faster and more structured procedures in organizations has resulted in the proliferation of information systems. However, the existence of an information system to accomplish a given task does not ensure the most efficient way to execute that task, especially when several systems are required to execute it. Performance issues are a common problem that organizations face and therefore optimization is frequently a priority. Optimizing the way an orga-nization performs its processes leads to an increase of efficiency, adding value to the orgaorga-nization. To optimize a process the organizations must understand how a process is being executed, usually this involved a long period of analysis, including interviews with all the persons responsible for a given part of the process.
The appearance and proliferation of Process-Aware Information Systems [2] (such as ERP, WFM, CRM and SCM systems) has opened the door for a more efficient type of method to study the execution of processes, called process mining [3]. These systems typically record events executed during a business process execution and analyzing these logs can yield important knowledge to improve the execution of processes and improve the quality of the organization’s services. This is where process mining comes in.
1.1
Process Mining
The process mining area is concerned with the discovery, the monitoring and the improvement of real processes (not assumed processes) by extracting information from event logs. Process mining techniques can generally be grouped into three types: (1) discovery of process knowledge like process models [4, 5, 6], (2) conformance checking, i.e. measure the conformance between modeled
behavior (defined process models) and observed behavior (process execution present in logs) [7, 8] and (3) extension of a process model with information extracted from event logs (like identifying bottlenecks in a process model).
The main application of process mining is the discovery of process models. Therefore, much investigation has been performed in order to improve the models produced. However there are still issues that complicate the discovery of comprehensible models and that need to be addressed. For processes with a lot of different cases and high diversity of behavior, the models generated
tend to be very confusing and difficult to understand. These models are usually called spaghetti
models[9]. Clustering techniques have been investigated as the means to deal with this complexity
by dividing cases into clusters, leading to less confusing models. However, results still suffer from the presence of certain unusual cases that include noise and ad-hoc behavior, which are common in real-world environments. This type of behavior can have different origins, like human error in executing a given process, incomplete executions of a process or errors produced by the systems. Known types of noise are for example the inversion in the order of activities, existence of unrelated activities or lack of needed activities. Usually this type of behavior is not relevant to understand a process and it unnecessarily complicates the discovered models.
1.2
Motivation
In this dissertation we present an approach that is able to deal with these problems by means of sequence clustering techniques. This is a kind of model-based clustering that partitions the cases according to the order in which events occurred. For the purpose of this work the model used to represent each cluster is a first-order Markov Chain. The fact that this clustering is probabilistic makes it suitable to deal with logs containing many different types of behavior, possibly non-recurrent behavior as well. When sequence clustering is applied, the log is divided into a number of clusters and the correspondent Markov Chains are generated.
Additionally, the approach also comprises a preprocessing stage, where the goal is to clean the log of certain events that will only complicate the clustering method and its results. If after both techniques are applied the models are still confusing, sequence clustering can be re-applied hierarchically within each cluster until understandable results are obtained. The approach has been implemented in ProM [1], an extensible framework for process mining that already includes many techniques to address challenges in this area.
1.3
Organization
This document is organized as follows: Chapter 2 provides an overview of existing work involving clustering and process mining. The framework in which the work was developed is presented, along with some of the most important techniques implemented in that framework.
Chapter 3 presents the proposed approach, including the preprocessing stage and the sequence clustering algorithm. The implementation of these techniques in ProM is discussed, including the
inputs needed and the outputs produced.
Chapter 4 presents three experiments using the techniques implemented that demonstrate the use of the techniques and compare the results with other clustering methods.
Chapter 5 demonstrates the approach in a real-world case study where the goal was to understand the typical behavior of faults in an application server.
CHAPTER
2
Process Mining Tools
Process mining techniques aim at the analysis of business processes by extracting information from event logs and are especially useful when little information is available about a given process and obtaining that information is complicated. Most of these techniques are available in the ProM framework.
In this chapter we present some work related to concepts approached in this dissertation, focusing on process mining techniques available in the ProM framework. First we present the framework, then we show an overall view of the different types of process mining tools available in ProM and finally we explore in greater detail two of those tools that focus on applying clustering methods to process mining.
2.1
ProM
The environment in which this dissertation is based is the ProM Framework1 [1, 10]. ProM is
an extensible framework aimed at process mining, that is issued under an open source license, therefore the development of plug-ins is possible and encouraged. Many plug-ins resulting from investigation work have been developed in three major categories: mining, analysis and conver-sion. Figure 2.1 presents an overview of the ProM Framework architecture, it shows the relations between the framework, the plug-ins and the event log.
The event log that usually serves as input to the plug-ins has a specific format based on XML and defined for this framework, it is called MXML [11]. This format follows a specified schema definition, which means the log does not consist of random and disorganized information, rather
Figure 2.1: Overview of the ProM Framework (adapted from [1])
it contains all the elements needed by the plug-ins at a known location. In Figure 2.2 a snapshot
of a MXML log is presented. Each Process Instance corresponds to one execution of a given
process and has a set ofAudit Trial Entries associated. These entries correspond to the events
that occurred during the execution of the process instance and are composed by several attributes
like the WorkflowModelElement that represents the name of the event and the EventType that
classifies the event according to its state (Start or Complete). There are also other attributes that identify the originator of a given event and the timestamp in which the event was executed. As shown in Figure 2.1, these event logs are generated by Process-aware Information Systems (PAIS) [2] and are read by the ProM framework using the Log Filter, that can also perform some filtering to those logs before any other task is performed. The Import plug-ins are used to load many different kinds of models like Aris graphs and the Mining plug-ins perform some kind of mining, storing the results as Frames. These Frames can be used to visualize a Petri Net [12] or a Social Network [13] for example. Analysis plug-ins can perform further analysis like checking the conformance of a process model and a log for example. Finally Conversion plug-ins can transform a mining result into another format and the Export plug-ins can store the results outside the framework in different kinds of format.
Next we further explore the mining and analysis plug-ins available in ProM, in particular the ones relating to our work.
<ProcessInstance id="0" description=""> <AuditTrailEntry> <WorkflowModelElement>A</WorkflowModelElement> <EventType>complete</EventType> </AuditTrailEntry> <AuditTrailEntry> <WorkflowModelElement>C</WorkflowModelElement> <EventType>complete</EventType> </AuditTrailEntry> <AuditTrailEntry> <WorkflowModelElement>E</WorkflowModelElement> <EventType>complete</EventType> </AuditTrailEntry> </ProcessInstance>
<ProcessInstance id="1" description=""> <AuditTrailEntry> <WorkflowModelElement>C</WorkflowModelElement> <EventType>complete</EventType> </AuditTrailEntry> <AuditTrailEntry> <WorkflowModelElement>A</WorkflowModelElement> <EventType>complete</EventType> </AuditTrailEntry> <AuditTrailEntry> <WorkflowModelElement>B</WorkflowModelElement> <EventType>complete</EventType> </AuditTrailEntry> <AuditTrailEntry> <WorkflowModelElement>D</WorkflowModelElement> <EventType>complete</EventType> </AuditTrailEntry> </ProcessInstance> Figure 2.2: MXML Snapshot
2.2
Mining Tools
Mining tools are an implementation of a mining algorithm in ProM. They can be divided into three major types: (1) Control-flow discovery, (2) Organizational perspective and (3) Data perspective. Some of the control-flow discovery tools include:
• α-algorithm plug-in– it implements theα-algorithm [4], constructing a Petri net that models
the workflow of the process. It establishes a set of relations between tasks and assumes that a log is complete (all possible behavior is present). This algorithm presents some shortcomings, namely it is not robust to noise and it cannot mine processes with short-loops or duplicate tasks. Some work has been done to extend this algorithm, for instance to be able to mine short-loops [14] and to detect implicit dependencies [15].
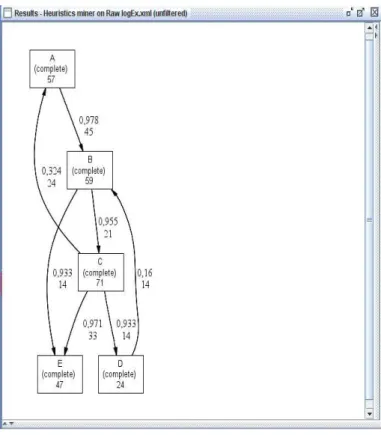
• Heuristics miner plug-in [5] – it implements a heuristics driven algorithm, that is especially
useful for dealing with noise, by only expressing the main behavior present in a log. This means that not all details are shown to the user and exceptions are ignored. To illustrate
what kind of graph is presented by this tool, we created a simple example log2 shown in
2Real life logs generate much more complex and confusing models, this example is only used to present some
Id Process Instance Frequency 1 ABCE 20 2 ACE 12 3 CABD 10 4 CAB 14 5 CDBE 14
Table 2.1: Example of an event log with 70 process instances, for the process of patient care in a hospital (A: Register patient, B: Contact family doctor, C: Treat patient, D: Give prescription to the patient, E: Discharge patient)
Table 2.1 and used the ProM implementation of this algorithm to come to the result shown in Figure 2.3. This tool can also be used when searching for long distance dependency relations.
• Genetic algorithm plug-in [6] – it uses genetic algorithms to calculate the best possible
process model for a log. Every individual is assigned a fitness measure that evaluates how well the individual can reproduce the behavior present in the input log. In this context, individuals are possible process models. Candidate individuals are generated using genetic operators like crossover and mutation and then the fittest are selected. This algorithm was proposed to deal with some issues involving the logs, like noise and incompleteness.
Organizational perspective aims at understanding the different types of business relations
estab-lished within an organization, some of the mining tools available in ProM that approach this subject are:
• Social network miner plug-in [16] – it takes a log file and determines a social network of
people. By using this tool we can identify roles and interactions in an organization, for example who usually works together or who hands over work to whom.
• Organizational miner plug-in – from an event log containing originator information, it
presents to the user a graph associating activities and originators.
Tools that deal with thedata perspective make use of additional data attributes present in logs,
here is an example:
• Decision miner [17] – this tool analyzes how data attributes of process instances or activities
(such as timestamps or performance indicators) influence the routing of a process instance. To accomplish this, every decision point in the process model is analyzed and if possible linked to properties of individual cases (process instances) or activities.
There are also some plug-ins that deal with less structured processes:
• Fuzzy miner [18] – the process models of less structured processes, tend to be very confusing
Figure 2.3: Process Model of the example log
graphically the most relevant behavior, by calculating the relevance of activities and their
relations. To achieve this two metrics are used: (1) significance that measures the level of
interest we have in events (for example by calculating their frequency on the log) and (2)
correlationthat determines how closely related two events that follow each other are, so that
events highly related can be aggregated.
2.3
Analysis Tools
Analysis plug-ins have a variety of purposes, like implementing some property analysis on a previ-ously achieved mining result or comparing a process log and a predefined model of how a process should be executed. Next we present only a few of those that we consider more relevant:
• Conformance checker – one important question that organizations would like to have
an-swered is: Are our processes being executed as we planned? Answering this question has
been an active field of investigation [7, 8]. This tool was implemented in ProM to address this problem. It analyzes the gap between a model and the real world, detecting violations (bad executions of a process) and ensuring transparency (the model might be outdated). To
measure the conformance this tool uses two concepts: (1)fitnessthat checks if the event log
complies with the control flow specified by the process model and (2) appropriateness that
• Basic performance analysis – the objective of this tool is to calculate performance measures such as the execution time of a process or the waiting time. The tool then presents the results with several different kinds of graphs.
• LTL checker [19] – this plug-in checks whether a log satisfies some Linear Temporal Logic
(LTL) formula. For example it can check if a given activity is executed by the person that should be executing it or check whether an activity A that has to be executed after B is indeed always executed at the correct moment.
2.4
Process Mining with Clustering
When generating process models like the one on Figure 2.3, conventional control-flow techniques tend to over-generalize. In the attempt to represent all the different behavior present in the log these techniques create models that allow for more behavior than the one actually observed. When a log has very different process instances the models generated are even more complex and confusing. Clustering was approached as a way to overcome this problem [20].
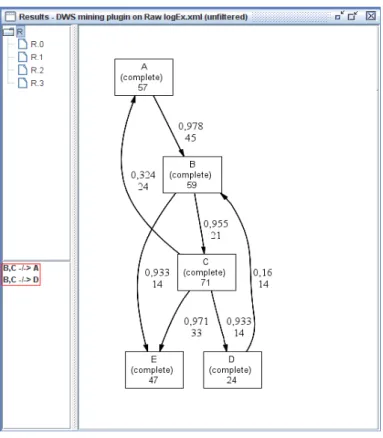
The approach was implemented in ProM as theDisjunctive Workflow Schema (DWS) mining
plug-in. In the methodology developed, first the complete log is examined and a model is generated using
theHeuristics Miner [5]. Then the log is compared to the model to measure the model’s quality. If
the model generated is optimal and no over-generalization is detected the approach stops, otherwise
the log is divided into clusters using theK-means clustering method and their models are tested.
If the cluster models still allow for too much behavior the clusters are repartitioned and so on until optimal models are achieved. The result of this methodology is the set of all the models created and the over-generalization points.
Let’s apply this methodology to our example log described in Table 2.1. By analyzing the model shown in Figure 2.3, we can conclude that it allows for behavior not present in the log, for example the sequence BCA. By running the DWS plug-in available in ProM we come to the result shown in Figure 2.4. The model is presented (right), the navigational tree of models generated where we can choose the one to view (top-left) and the over-generalization points detected, where the first one refers to the sequence we had identified, stating that A was never executed after BC (bottom-left marked in red). Other clustering methods investigated in the process mining area are presented in the next section.
2.5
Trace Clustering Approach for Process Mining
Trace Clustering [21] is another approach investigated in the process mining area as a way to partition the log, grouping similar sequences together. The motivation behind this work was the existence of flexible environments, where the execution of processes does not follow a rigid set of rules; although the notion of process is present, the actors are able to execute it differently according to each case. An example of such environments is the healthcare, where strictly following a process is not a priority compared to providing the best care for patients.
Figure 2.4: DWS mining result
In these environments and particularly when a large number of cases (process instances) is recorded in the log, the main problem is the diversity; i.e. single process instances differ significantly from one another, therefore there are several different types of sequences and the models generated by conventional techniques are very confusing (spaghetti-like models).
This approach addresses the issue using distance-based clustering along with profiles, with the
purpose of reducing the diversity by lowering the number of cases analyzed at once. Each profile is formed by a set of items that describe a case from a particular perspective. Every item is a metric that assigns a numeric value to each case and therefore a profile can be viewed as a vector containing the values of all the different items (profiles can be combined resulting in aggregate vectors). These vectors are then used to calculate the distance between two cases, using distance metrics (like the Euclidean distance or the Hamming distance). Examples of such profiles are:
• Transition – The items in this profile are direct following relations of the sequence (that
forms a process instance). For any two events (A, B) there is an item measuring how often B as directly followed A.
• Case Attributes – The items in this profile are the data attributes of the process instance.
When process instances are annotated with meta-information, comparing that information can be an efficient way to compare the instances.
Figure 2.5: Trace Clustering result cases in the same cluster:
• K-means Clustering – It is one of the most used clustering methods and constructskclusters
by dividing the data intokgroups.
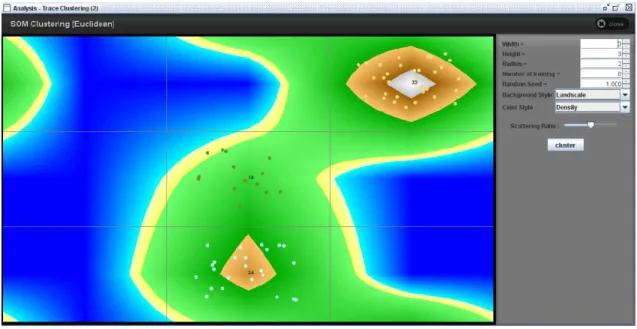
• Self-Organizing Map (SOM) – It is a neural network technique, which is used to map high
dimensional data onto low dimensional spaces. Similar cases are mapped close to each other in the SOM. In Figure 2.5 we can see the resulting output of this method (in ProM) when applied to our example log. Three clusters were generated and in the map we can analyze the similarity between different cases and different clusters. If the cases are close together in the map and the color separating them is light then those cases are very similar.
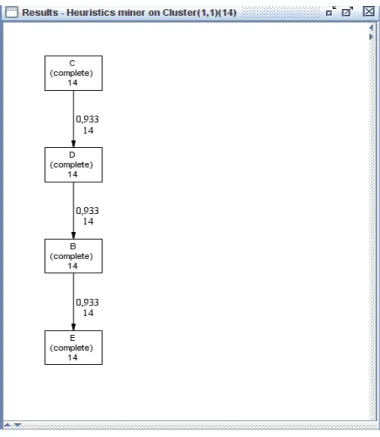
These algorithms are available in the ProM framework via thetrace clustering plug-in. Figure 2.6
shows the process model (generated by theHeuristics Miner) for one of the clusters created when
applying the SOM method. We can now clearly identify a type of sequence (no diversity present in that subset of the original log), it refers to a case (CDBE) where the patient was not registered; i.e. when analyzing the clusters we can discover different types of behavior, including types of sequences that are not being executed as they should.
Recent work has been done to improve the results produced by trace clustering. A context aware approach based on generic edit distance was presented in [22]. In this work a method was defined to automatically derive a cost function to calculate the costs of edit operations, which takes into account the context of an event within a sequence. Considering the context can be valuable given that the events present in the sequences and the order in which they occur have a semantic relevance.
Figure 2.6: Process Model for cluster (1,1)
trace clustering methods [22]. Comparing the results produced by one trace clustering approach to another is not trivial, due to the difficulty in understanding if one cluster is better formed than another. A better formed cluster is one in which the sequences have a higher degree of similarity and consequently the models for those clusters are easier to understand. Therefore a process mining perspective was proposed to evaluate the goodness of clusters by analyzing the models of those clusters. Fitness and comprehensibility metrics were used to evaluate the complexity of the models. By comparing these metrics the approach proved to generate less complex cluster models, indicating that better formed clusters were achieved.
2.6
Conclusion
In this chapter we have introduced some important concepts relating to our work. The framework used throughout this dissertation was presented and also the types of tools available in that framework. The continuous growth of ProM is due to the importance that process mining has gained in recent years, resulting in numerous research performed by people around the world. We presented in greater detail two solutions involving the application of clustering techniques to process mining. The Trace Clustering approach is particularly relevant to our work, being that they share the common goal of sub-dividing the initial log in smaller logs, as to facilitate the detection of patterns.
The difference between the two approaches are the techniques used to achieve that goal. The emphasis of our solution is to approach the problem of noise and ad-hoc behavior that complicate the identification of patterns in logs originated by real-world information systems and the results produced by the clustering methods presented. To accomplish this we combine different techniques that are presented in the next chapter.
CHAPTER
3
Sequence Clustering for ProM
Like the clustering techniques described in the previous chapter, sequence clustering can take a set of sequences and group them into clusters, so that similar types of sequence are placed in the same cluster. However, this type of clustering is performed directly on the sequences, as opposed to being performed on features extracted from those sequences. Sequence clustering has been extensively used in the field of bioinformatics, for example to classify large protein datasets into different families [23]. Process mining also deals with sequences, but instead of aminoacids the sequences contain events that have occurred during the execution of a given process. Sequence clustering techniques are therefore a natural candidate to perform clustering on workflow logs. In this chapter the techniques that form our solution are explored and the way these techniques were implemented is presented, including the outputs produced.
3.1
Sequence Clustering
The sequence clustering algorithm used here is based on first-order Markov chains [24, 25]. Each cluster is represented by the corresponding Markov chain and by all the sequences assigned to it. A Markov chain is composed by a set of states and by the transition probabilities between them. In first-order Markov chains the probability of a given transition to a future state depends only on the current state. For the purpose of process mining it becomes useful to augment the simple Markov chain model with two dummy states: the input and the output state. This is necessary in order to represent the probability of a given event being the first or the last event of the chain, which may become useful to distinguish between some types of sequences.
Figure 3.1: Example of a cluster model (Markov Chain) displayed in the sequence clustering plug-in ◦ a b c d e • ◦ 0.0 1.0 0.0 0.0 0.0 0.0 0.0 a 0.0 0.0 0.892 0.108 0.0 0.0 0.0 b 0.0 0.0 0.0 0.0 1.0 0.0 0.0 c 0.0 0.0 0.0 0.0 1.0 0.0 0.0 d 0.0 0.0 0.0 0.0 0.0 0.368 0.632 e 0.0 0.0 0.0 0.0 0.0 0.0 1.0 • 0.0 0.0 0.0 0.0 0.0 0.0 0.0
Figure 3.2: Markov chain – Matrix representation
plug-in developed in this work. In this model, darker elements (both states and transitions) are more recurrent than lighter ones. By analyzing the color of the elements and the probability associated with each transition it is possible to decide which elements should be kept for analysis, and which elements can be discarded. For example, one may choose to remove transitions that have very low probabilities, so that only the most typical behavior can be analyzed.
Figure 3.2 corresponds to the matrix representation of the Markov chain shown in Figure 3.1, where each column and each line correspond to an event and the matrix is ordered alphabetically
from a to e (considering that the first and the last state correspond to the two dummy states
added). In this representation the matrix values are the transition probabilities, for example the
transition from a to c has a 10.8% probability of occurring. Every line in the matrix must be
normalized; i.e. the sum of all the transition probabilities originating on a given state must equal one. Notice that in the first column and in the last line all values are zero and will be so in every Markov chain generated by our solution, because the input state is a dummy first state that is never transitioned to and the output state is a dummy final state that never transitions anywhere.
As said before these are first order Markov chains, there are also nth order chains where the
probability of transition to a future state depends on the previous n states. An example of recent work developed with higher-order Markov chains can be found in [26].
The assignment of sequences to clusters is based on the probability of each cluster producing the given sequence. In general, any given sequence will be assigned to the cluster that is able to
produce it with higher probability. Let◦ and•denote the input and output states, respectively.
To calculate the probability of a sequence x={◦, x1, x2,· · ·, xL,•}being produced by cluster ck
the following formula is used:
p(x|ck) =p(x1| ◦;ck)· " L Y i=2 p(xi|xi−1;ck) # ·p(• |xL;ck) (3.1)
wherep(xi|xi−1;ck) is the transition probability fromxi−1 toxi in the Markov chain associated
with clusterck. This formula handles the input and output states in the same way as any other
regular state that corresponds to an event.
The goal of sequence clustering is to estimate these parameters for all clusters ck with k =
1,2,· · ·, K based on a set of input sequences. For that purpose, the algorithm relies on an
Expectation–Maximization procedure [27] to improve the model parameters iteratively. For a
given number of clustersKthe algorithm proceeds as follows:
1. Initialize randomly the state transition probabilities of the Markov chains associated with each cluster.
2. Assign each sequence to the cluster that can produce it with higher probability according to equation (3.1).
3. Recompute the state transition probabilities of the Markov chain of each cluster, considering the sequences that were assigned to that cluster in the previous step.
4. Repeat steps 2 and 3 until the assignment of sequences to clusters does not change, and hence the cluster models do not change either.
In other words, first we randomly distribute the sequences into the clusters (steps 1 and 2), then in step 3 we re-estimate the cluster models (Markov chain and its probabilities) according to the sequences assigned to each cluster. After this first iteration we re-assign the sequences to clusters and again re-estimate the cluster models (steps 2 and 3). These two steps are executed repeatedly until the algorithm converges. The result is a set of Markov models that describe the behavior of each cluster.
The random initialization of the transition probabilities is an important feature of this algorithm that introduces a certain level of uncertainty in the results achieved. The sequence clustering algorithm can therefore generate a different set of clusters for the same sequences. Throughout this dissertation we minimized the impact of this uncertainty by applying the algorithm several times (usually five) and choosing the result that occurred more often.
3.2
Applications of Sequence Clustering
Sequence clustering algorithms have been an active field of investigation in the area of bioinfor-matics [23, 28], as mentioned earlier. Although this has been the area primarily associated with sequence clustering, some work has been done with this type of algorithms in other areas. In [24], the goal was to analyze the navigation patterns on a website, these patterns consisted of sequences of URL categories followed by users. Sequence clustering was the approach chosen to partition site users, placing users with similar navigation paths in the same cluster. The behavior of the users present in each cluster is then displayed and can be analyzed to understand the particular interests of different types of user.
In the field of process mining, sequence clustering has also been investigated [25]. The motivation behind that work was the fact that an event log can contain events originating from different processes; i.e. the idea was to not make the assumption that an event log only contains events of one process, but instead can be a mixture of different processes without any information stating which events correspond to what processes. The goal was to develop an approach that would be able to extract sequences of related events (relating to the same case) from those chaotic logs. After identifying the sequences, the Microsoft Sequence Clustering Algorithm (available in SQL Server [29]) is applied to group similar sequences in the same cluster, without the need for any business logic information.
The environment developed to test this approach was an application that executed sequences of actions over a database and recorded these actions in logs. After extracting the sequences from the event log with some methodology, the sequence clustering algorithm was applied with a specific number of clusters as to generate a new cluster for each of the different types of sequences identified. Consequently, the model generated for each cluster constitutes a deterministic graph (the transition probabilities all equal 1.0) and the visualization of each model leads to the identification of a sequence type executed in the environment tested.
3.3
Preprocessing
Although the sequence clustering algorithm described above is robust to noise, all sequences must ultimately be assigned to a cluster. However, if a sequence is very uncommon and different from all the others it will affect the probabilistic model of that cluster and in the end will make it harder to interpret the model of that cluster. To avoid this problem, some preprocessing must be done to the input sequences prior to applying sequence clustering. This preprocessing can be seen as a way to clean the dataset of undesired states (events) and also as a way to eliminate undesirable sequences. For example, undesired events can be events that occur rarely and undesired sequences can be single step sequences that only have one state.
Some of the steps that can be performed during preprocessing are described in [30] and include, for example, dropping events and sequences with low support. In this work we have extended these steps by allowing not only the least but also the most recurring events and sequences to be discarded. This was motivated by the fact that in some real-world applications the log is filled
with some very frequent but irrelevant events (such as debug messages) that must be removed in order to allow the analysis to focus on the relevant behavior. Spaghetti models are often cluttered with events that occur very often but only contribute to obscure the process model one aims to discover.
The preprocessing steps implemented within the sequence clustering plug-in are optional and configurable. They focus on the following features:
1. Event type – The events recorded in a MXML log file may represent different points in
the lifetime of workflow activities, such as the start or completion of a given activity. For sequence clustering what is important is the order of activity execution, so we retain only one type of event and that is usually the completion event for each activity. Therefore only events of type “complete” are kept after this step.
2. Event support – Some events may be so infrequent that they are not relevant for the purpose
of discovering typical behavior. These events should be removed in order to facilitate analysis. On the other hand, some events may be so frequent that they too become irrelevant and even undesirable if they hide the behavior one aims to discover. Therefore, this preprocessing can remove events both with very low and too high support.
3. Consecutive repetitions – Sequence clustering is a means to analyze the transitions between
states in a process. If an event is followed by an equal event then it should be considered only once, since the state of the process has not changed. Consecutive repetitions are therefore
removed, for example: the sequence A→C→C→D becomesA→C→D.
4. Sequence length– After the previous preprocessing steps, it may happen that some sequences
collapse to only a few events or even to a single event. This preprocessing step provides the possibility to discard those sequences. It also provides the possibility to discard exceedingly long sequences which can have undesirable effects in the analysis results. Sequence length can therefore be limited to a certain range.
5. Sequence support – Some sequences may be rather unique so that they hardly contribute to
the discovery of typical behavior. In principle the previous preprocessing steps will prevent the existence of such sequences at this stage but, as with events, sequences that occur very rarely can be removed from the dataset. In some applications such as fault detection it may be useful to actually discard the most common sequences and focus instead on the less frequent ones, so sequence support can also be limited to a certain range.
The order presented is the order in which the preprocessing steps should be applied, because if the steps are applied in a different order the results may differ. For example, rare sequences should only be removed at the final stage, because previous steps may transform them into common
sequences. Imagining we have the rare sequence A → B → C → D, but in step 2 state B is
considered to have low support and is removed, then it becomesA→C→D. This new sequence
Figure 3.3: Sequence Clustering plug-in in the ProM framework
3.4
Implementation within ProM
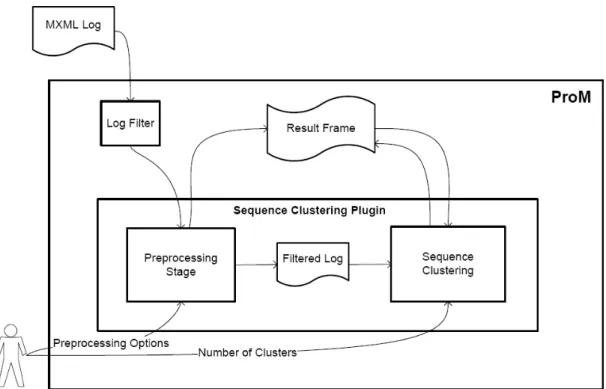
The above preprocessing steps and the sequence clustering algorithm have been implemented as a new plug-in for the process mining framework ProM [1], which offers an environment suitable for extension. Figure 3.3 presents a general view of our solution inserted in that environment and is discussed in detail throughout this section. We particularly approach the interaction between the techniques developed and ProM, including the inputs needed and the outputs produced.
The starting point as for the majority of the plug-ins in ProM is an event log. We assume that the log contains a variety of process instances corresponding to one process and each of these process instances contains a set of audit trail entries. These entries correspond to a given event executed within the process instance and have some attributes like the name, the type and the entity responsible. An event usually marks the beginning or the end of an activity, so these two concepts are closely related and therefore are used interchangeably throughout this dissertation. The set of all the entries of a given process instance is considered the sequence of events that were performed in that process instance. Different process instances (of the same process) may be composed by a different sequence, which represent alternative ways in which the process was executed. The main goal of our solution is to group sequences that are somehow related, with an event log as an input we now have several sequences available, so we can start the implementation of the techniques described.
3.4.1
Preprocessing Stage
In this stage the log is cleaned of certain elements that might influence negatively the usefulness of the final results, the objective is not to alter the format of the log, it is to prepare the sequences for the sequence clustering algorithm to group them afterwards. The preprocessing stage receives an input log in MXML format [11], which means that the elements we need are already available at a known location. If the log we intend to analyze is not in the format mentioned, a framework
called ProM Import1 [31] can be used to restructure and convert the log to the accepted format.
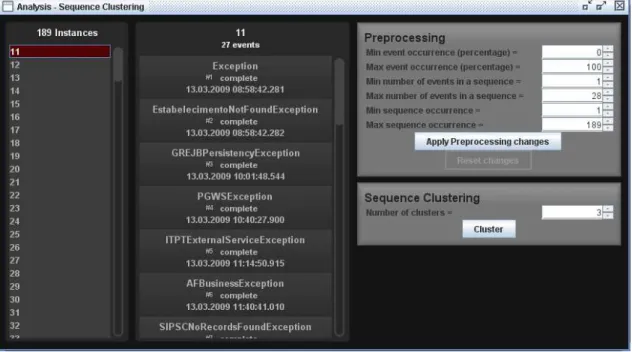
The other input at this stage are some options provided by the user, which specify the parameters to be used in the preprocessing steps described earlier. Figure 3.4 presents a screenshot of this stage and the options can be seen in the top-right corner: (1) the minimum percentage of occurrence of an event, (2) the maximum percentage of occurrence of an event, (3) the minimum size of a sequence, (4) the maximum size of a sequence, (5) the minimum occurrence of a sequence and (6) the maximum occurrence of a sequence. After the user specifies which elements to keep, the sequences present in the log (left in the figure) are altered or removed. The view is then refreshed to show the sequences of the preprocessed log. When implementing this technique and the sequence clustering technique in ProM, the original log is never changed, instead filters are used to create a new log. Rather than modifying the original log, what filters do is construct a new log based on the original one and on the results produced by those techniques. This is an existing component of ProM that includes different types of filters that can be used prior to any mining tool. To support our techniques new filters were created.
The result produced at this stage is afiltered log. This log is made available to the ProM framework,
so that it may be analyzed with other plug-ins if desired, so instead of acting just as a first stage to sequence clustering the preprocessing stage can also be used together with other types of analysis available in the framework.
3.4.2
Sequence Clustering Stage
The sequence clustering stage receives the filtered log as input from the preprocessing stage and also the desired number of clusters. In general the plug-in will generate a solution with the provided number of clusters except when some clusters turn out to be empty. Each cluster can be used again as an event log in ProM, so it becomes possible to further subdivide it into clusters, or for another process mining plug-in to analyze it. These features allow the user to drill-down through the behavior of clusters.
The plug-in provides special functionalities for visualizing the results, both in terms of sequences that belong to each cluster and in terms of the Markov chain for each cluster.
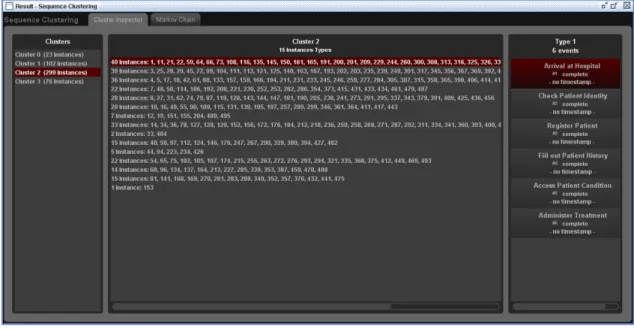
In the first type of visualization depicted in Figure 3.5, the clusters generated are shown (left-hand side), the set of instances present in each cluster are presented (middle) and finally the sequence of events that compose each type of instance can also be inspected (right-hand side). As shown in Figure 3.5 the sequences within each cluster are aggregated according to their types, which means
1Both the schema definition for MXML and the ProM Import framework can be downloaded from
Figure 3.4: Preprocessing stage for the Sequence Clustering plug-in
we can immediately identify how many different types of sequence were assigned to a cluster and how many sequences are there of each type. As an example we can see in the figure the inspection of “Cluster 2”, to which fifteen types of process instances were assigned. There are forty instances of the type highlighted in the image and the sequence of events that compose this type of process instance is the one shown in the right-hand side and is formed by six events. This visualization is especially useful to identify the frequency of occurrence for different types of behavior, for example one can conclude that the last type of process instance seen in the figure that occurs only once is a rare sequence of events, probably originating from noise or ad-hoc behavior and therefore not relevant to understand the behavior of the process being analyzed.
The second type of visualization available makes this plug-in a mixture between a mining plug-in and an analysis plug-in. On one hand, sequence clustering is a mining plug-in that extracts models of behavior for the different behavioral patterns found in an input event log. Figure 3.6 shows the type of results that the plug-in is able to present. When visualizing the results, the user can adjust thresholds that correspond to the minimum and maximum probability of both edges and nodes (right-hand side of fig.3.6). This allows the user to adjust what is shown in the graphical model by removing elements (both states and transitions) that are either too frequent or too rare. This feature facilitates the understanding of spaghetti models by taking advantage of the probabilistic nature of sequence clustering and without having to re-run the algorithm again. This can be seen as a post-processing of the cluster models achieved. An example of the usefulness of this feature
is the difference between figure 3.6 that represents all the behavior present in a cluster2and figure
3.7 that only represents transitions occurring above the threshold of 0.06. The difference in the complexity of the two models after eliminating less recurrent behavior is noticeable.
Figure 3.5: Cluster Inspection in the Sequence Clustering plug-in
Figure 3.7: Cluster model with an edge threshold of 0.06
On the other hand, sequence clustering can also be regarded as an analysis plug-in since it generates new events logs that can be analyzed by other plug-ins available in the ProM framework. This is also useful for analyzing spaghetti models, which are hard to understand at first but can be made simpler by dividing their complete behavior into a set of clusters that can be analyzed separately by other algorithms.
3.5
Hierarchical Clustering
After applying the previous techniques to a set of sequences, the cluster models generated might still be too general and no pattern clearly identified, in such cases reapplying sequence clustering to the clusters can be useful to extract valuable information from the models. From each cluster originated with sequence clustering a log is constructed. These logs are smaller logs than the one that served as input, have a set of sequences assigned by the sequence clustering algorithm and can be viewed and used as regular logs.
Therefore we can re-apply sequence clustering as many times as needed, getting smaller and smaller logs, that have fewer and increasingly similar sequences (less variation within a cluster). This eventually leads to the discovery of some behavioral pattern in the cluster models.
3.6
Conclusion
In this chapter the techniques that form our approach were presented. These techniques were implemented in ProM and generate different types of output. The most important outputs are
the cluster models in the form of Markov chains, which given its probabilistic and simplistic nature allow the user to understand the patterns present in a cluster.
The techniques implemented are of great value when analyzing complex logs. Before applying the sequence clustering algorithm, the preprocessing stage can be used as a way to eliminate unnecessary behavior that has no relevance on the execution of the process. After running the sequence clustering algorithm, if the models generated are still confusing this algorithm can be re-applied hierarchically on the clusters. Using the probabilistic nature of sequence clustering and Markov chains is also important to enhance the quality of the models generated. To accomplish this, the thresholds relating to node and edge occurrence can be adjusted so that the model only presents the behavior relevant to the user’s goals.
After presenting the approach and its implementation, in the next chapter we perform some experiments to understand how the techniques can be used and the value obtained by using them.
CHAPTER
4
Experiments and Evaluation
In this chapter we present three experiments made to demonstrate the capabilities of our solution and the ways in which the techniques can be applied. The first case relates to an issue handling process, where many connections exist between the activities and the second case relates to a hospital treatment process, where there are several behavioral variations that are difficult to visualize as a whole. In both cases sequence clustering and preprocessing techniques are used to enable the visualization of behavioral patterns and the extraction of useful conclusions about the execution of the processes. The third experiment relates to a telephone repair process and unlike the previous two the objective is to evaluate the sequence clustering algorithm by comparing it with other clustering methods using a set of metrics.
4.1
Issue Handling Process
This experiment is based on the case study presented in [30] and was adapted as to better demon-strate the use of the techniques that were implemented in ProM. The main characteristic of this experiment is that the order in which the activities are executed tends to be constantly changing. This is a typical real-world type of problem that complicates the analysis of process models and therefore is a valuable way to demonstrate how this sequence clustering based solution performs in these situations.
The experiment involves an issue handling process, that begins with a customer reporting a prob-lem and then a set of activities are executed to resolve that probprob-lem. Figure 4.1 shows the Markov chain generated for the initial log without dividing it into clusters. Although the number of events is small, the numerous connections between those events complicate the analysis of the model and
Figure 4.1: Model for the initial log of the issue handling process no pattern of behavior can be clearly identified.
There are 5 different events present in the log: (1)New - the problem reported enters the system
and is registered as being a new problem; (2) Assigned - the problem is assigned to a person;
(3)Open - the resolution of the problem begins; (4) Resolved - the problem has been solved; (5)
Duplicated - the problem has been reported in the past and the same resolution is applied. The
sequences formed by these events and present in the log are shown in Figure 4.2, by analyzing them we can conclude that the last 3 sequences have a low occurrence when compared with the others. Low occurrences like this usually point to ad-hoc behavior, noise or some kind of mistake done when executing a process, all of which are irrelevant to understand the usual patterns associated with the execution of a process. As an example the last sequence shown in Figure 4.2 does not make logical sense, since the event “Open” occurred after the issue was considered duplicated and consequently handled. Given the irrelevance of these sequences we start handling this case by eliminating them in the preprocessing stage.
To accomplish this, the preprocessing option concerning the frequency of occurrence of sequences is used. After setting the minimum occurrence of a sequence to six, the sequences are removed. The
sequences present in the filtered log can now be divided into clusters. After experimenting with
different numbers of clusters, we obtained some understandable results by dividing the sequences into four clusters. Figures 4.3 to 4.6 present the models of the clusters generated.
A significant improvement of the models can be immediately identified, especially when consid-ering the number of possible transitions between states. Another important fact about sequence clustering is visible in these models and it concerns the difference in complexity between the cluster models generated. This is a result of the diversity present in the logs and of the grouping executed by the algorithm. There are clusters with more different types of instances than others.
By further analyzing the cluster models we can understand the different types of behavior present in the log.
Cluster 1represents a specific type of behavior where the process is opened before being assigned and in some cases is not opened at all, this usually points to a simple problem that was immediately resolved by the person who registered the issue.
Figure 4.2: Sequences present in the log of the Issue Handling Process
Figure 4.3: Cluster 1: Issue Handling Process
Figure 4.4: Cluster 2: Issue Handling Process
Figure 4.6: Cluster 4: Issue Handling Process
Figure 4.7: Cluster 3.1: Issue Handling Process
Cluster 2 represents the opposite type of behavior where the assignment is done before the
opening. Another fact visible in this model is that the problem was not registered as a New
problem and it should have been as soon as it entered the system.
Cluster 4is a clear example of the above mentioned complexity difference that sometimes occur between clusters, in this case there was only one type of sequence assigned to the cluster.
On the other hand,Cluster 3is the hardest one to analyze, especially due to the existence of a
loop between the statesNew,Assigned andOpen. Several options are available to handle this type
of cluster models. (1) Rerun the algorithm with a different number of clusters, however this is the most drastic option that is not guaranteed to improve the results; (2) Apply the sequence algorithm hierarchically, which means further subdividing the cluster or (3) Use the probabilistic capabilities of sequence clustering, by adjusting the thresholds discussed in Section 3.4.2. These thresholds will remove certain types of behavior (for example transitions occurring with low probability) and will simplify the cluster models. In this case we chose option 2, mainly because other than the
transition betweenOpenandDuplicated, the rest of the elements (both nodes and transitions) are
frequent enough to be relevant. Therefore to avoid losing important behavior we applied sequence clustering hierarchically, dividing the cluster in two clusters.
Cluster 3.1presented in Figure 4.7 is now easier to understand and represents the most common behavior, which is analyzing the issue and labeling it as a new problem. After that the issue is assigned to a person, that opens the process of resolution and resolves the problem. Also in this cluster is a less frequent behavior where only after beginning the resolution of the problem, it is
identified hasDuplicated and therefore resolved.
Cluster 3.2presented in Figure 4.8 is another example of a cluster with only one type of sequence, which correspond to a behavior where the resolution is opened before the problem is identified as a new problem and before the assignment of that problem to a team member.
With this small experiment we demonstrated the use of the techniques and the capabilities of sequence clustering. Starting from a confusing model, we were able to partition the log and extract cleaner models. In these models the different patterns of behavior were identified and
Figure 4.8: Cluster 3.2: Issue Handling Process
conclusions regarding the significance of those behaviors (what they meant in the context of the issue handling process) were drawn.
4.2
Patient Treatment Process
Process mining is a useful tool when studying the execution of processes, especially when dealing with environments where a process can be executed in several different ways. One such environ-ment is the clinical domain, where the technical requireenviron-ments of some tasks and the importance of having up to date information has increased the number of information systems across the units of a hospital. These systems are responsible for a great deal of processes executed in a hospital and are the key component when process optimization is pursued. Before optimizing there is a need to understand how processes are being executed and supported, however the analysis of processes becomes complicated especially due to process variations, the lack of rigid clinical pathways and also the execution of a process across different units and systems. The inherent difficulties of clinical workflows have made them an interesting subject of investigation [32, 33, 34].
Some of the challenges of analyzing the execution of clinical processes can be addressed by using the principles of process mining, in order to extract process models, understand the structure of a process and extract other knowledge provided by process mining techniques, like social networks for example.
For this experiment we developed an event log, based on high level activities usually executed in the treatment of patients. The log contains common procedures followed from the arrival of the patient to the discharge. We also introduced some noise and incomplete executions of a process to better depict the real scenarios that occur in hospitals. The objective is to employ the techniques implemented to understand the different types of executions present in the log and understand the context in which they occur.
Figure 4.9 shows the Markov chain for the entire event log. There are a total of sixteen events with several connections between them. By analyzing the model we can conclude that the first event is always the arrival of the patient, but other than that it is not clear what kind of patterns the execution of the process follows.
Figure 4.9: Mo del for the initial log of the P atien t T reatmen t Pro cess
Letter Event
A Arrival at Hospital
B Check Patient Identity
C Register Patient
D Fill out Patient History
E Analyze Patient Records
F Access Patient Condition
G Admit Patient
H Administer Treatment
I Discharge Patient
J Refer to Family Doctor
L Order Tests M Analyze Results N Refer to Specialist O Transfer Patient P Contact Family Q Contact Authorities
Table 4.1: Correspondence between letters and events
To improve the comprehension of the log, the first action taken was to analyze the occurrence of the different events (Figure 4.10). To facilitate the visualization of some figures we represent the events with a letter and the correspondence between each letter and each event is shown in Table 4.1. In Figure 4.10 it is clear that some events (namely the last four) rarely occur and can therefore be eliminated in the preprocessing stage, considering that the recurrent patterns of behavior is what we intend to determine.
After determining the most relevant events we turned our attention to the sequences recorded in the log. In Figure 4.11 we present the occurrences for the different sequences. Even with the removal of rare events there are unusual process instances, mainly due to incomplete executions of a process or to the execution of events in unusual orders. Given the occurrences of the sequences, we established that it would be acceptable and helpful to remove sequences occurring below 1% of the times, therefore the preprocessing parameter for the minimum sequence occurrence was set to 20 (from the initial 2000 instances, 1926 were kept).
Finally, after preprocessing the process instances the sequence clustering algorithm was applied with the number of clusters set to three. Figures 4.12 to 4.14 present the cluster models achieved. The comprehensibility of the models increased and conclusions were taken about the significance of the behavior present in each cluster.
Figure 4.10: Events present in the log of the Patient Treatment Process
Figure 4.12: Cluster 1: P atien t T reatmen t Pro cess Figure 4.13: Cluster 2: P atien t T reatmen t Pro cess Figure 4.14: Cluster 3: P atien t T reatmen t Pro cess
InCluster 1the first conclusion is that after the arrival at the hospital the identity of the patient is checked. If it is the first time that patient comes to the hospital he is registered and his medical history is filled, otherwise the existing patient records are analyzed. After this, the condition of the patient is examined and either the patient is admitted or referred to a specialist. In either case the situation is probably not simple. We can also conclude that several times tests are needed to determine the condition of the patient.
The main behavioral difference between Cluster 1 and Cluster 2 is that in the last one the
patient is not admitted. This indicates simpler problems that can be treated without the patient staying in the hospital. Another important fact that stands out from this model is that after analyzing the results of some medical test there is in certain occasions the need to order more tests. This can indicate the need to further analyze the situation with other tests, but it can also indicate errors in the choice of the tests ordered or even in the execution of those tests.
Finally the main characteristic of the behavior present in Cluster 3can be seen in the events
beginning the process. Instead of performing the usual identity analysis the patient condition is immediately checked or in some cases the patient is immediately treated. This pattern suggest the presence of emergency situations, where treating the patient as fast as possible takes priority. The fact that the process always ends with the patient being admitted and later being discharged also suggests that the condition of the patient was serious.
This experiment has shown the value of using our solution in flexible and complex environments. The importance of the preprocessing stage is noticeable and the sequence clustering algorithm proved to perform an effective division of the log, given that the behavior assigned to each cluster followed a specific pattern of behavior.
4.3
Telephone Repair Process: Comparing Clustering
Meth-ods
In the previous experiments the goal was to understand the importance of sequence clustering in process mining and to demonstrate the application of the techniques. In this third experiment the goal is to evaluate the sequence clustering algorithm in comparison with other clustering methods available in ProM.
For this purpose we use the Telephone Repair Process from the ProM tutorial [35], also available in the website of the framework. The process starts by registering a telephone device sent by a customer. After that the Problem Detection department analyzes and categorizes the defect. The problem is then sent to the Repair department where one of two teams will handle it, depending on whether it is a simple problem or a complex one. After the repair is finished, the Quality Assurance department makes sure that the problem was indeed fixed. If it was not fixed the problem is sent back to the Repair department, otherwise the case is archived and the telephone is sent to the customer. If after a certain amount of tries to fix the problem, it is still not fixed the case is archived and a new telephone is sent to the customer. Twelve different activities can be found in the log that registers the executions of this process. Different types of process instance
Cluster No i Method 1 Method 2 Method 3 ni ci si ni ci si ni ci si 0 271 32 14 156 23 15 302 8 7 1 213 13 10 213 13 10 249 13 9 2 299 7 5 211 8 6 269 12 9 3 321 21 14 524 2 2 284 3 3 Sum 1104 73 43 1104 46 33 1104 36 28
Table 4.2: Complexity metrics of the process models from the clusters generated by the three different clustering methods
are present in the log, mainly due to the flexibility of the process when considering the order in the execution of activities.
The objective of clustering algorithms when applied to process mining is to ease the discovery of process models by grouping together instances that follow similar execution patterns. Therefore, to evaluate the quality of the results we analyze the process models discovered for the clusters. Better formed clusters tend to group instances such that the cluster models are less complex. The following clustering methods are studied:
• Method 1: K-means Clustering
• Method 2: Agglomerative Hierarchical Clustering
• Method 3: Sequence Clustering
The first two methods are available in the trace clustering approach present in ProM and the last method is the sequence clustering algorithm implemented. The objective of this experiment is to compare clustering algorithms, therefore when testing the sequence clustering algorithm the preprocessing stage was not used, making the test conditions equal for the three algorithms. The method of evaluation followed to compare the results of different clustering methods is based on the methodology found in [22]. The first step of this methodology is to apply each of these methods
to the set of instances present in the telephone repair process event log. Then the α-algorithm
discussed earlier is used to generate models for the clusters formed and finally the Petri-Net Complexity Analysis plug-in also available in ProM is used to evaluate the complexity of the resulting models. This plug-in generates metrics such as the number of control flows, and-joins, and-splits, xor-joins and xor-splits. When the value of these metrics is higher the models are more complex, therefore better formed clusters originate models with lower values for these metrics. The relationship b
![Figure 2.1: Overview of the ProM Framework (adapted from [1])](https://thumb-us.123doks.com/thumbv2/123dok_us/403381.2545560/20.892.167.755.160.541/figure-overview-prom-framework-adapted.webp)