LBS Research Online
R Gao,L Shivakumarand B K Sidhu Exchange-sponsored analyst coverage Article
This version is available in the LBS Research Online repository: http://lbsresearch.london.edu/ 816/
Appendix 1
Gao, R,Shivakumar, Land Sidhu, B K (2018)
Exchange-sponsored analyst coverage.
Contemporary Accounting Research, 35 (2). pp. 734-766. ISSN 0823-9150 DOI:https://doi.org/10.1111/1911-3846.12410
Wiley
http://onlinelibrary.wiley.com/doi/10.1111/1911-38... c
2018 The Canadian Academic Accounting Association. This is the peer reviewed version of the following article: Gao R, Shivakumar L, Sidhu B K (2018) ’Exchange-sponsored analyst coverage’, Contemporary Accounting Research, which has been published in final form at
10.1111/1911-3846.12410. This article may be used for non-commercial purposes in accordance with Wiley Terms and Conditions for Self-Archiving.
Users may download and/or print one copy of any article(s) in LBS Research Online for purposes of research and/or private study. Further distribution of the material, or use for any commercial gain, is not permitted.
Appendix 1: Details of the SGX Research Incentive Scheme
Panel A: Operational features of the Scheme (extracted from Singapore Exchange, 2003a)
Requirements for research firms on the frequency and content of research reports on sponsored companies
Initiation Coverage Update
Minimum Frequency and Timing
1 report within 5 (later extended to 6) months of company allocation
2 reports,
corresponding to the half- and full-year result announcements
2 reports issued at any time
Minimum Content
Company background, identification and discussion of risks, analysis of recent financials, peer group analysis, valuation and recommendation
Analysis of results and analyst’s view of outlook, valuation and
recommendation Recommendation
Description of trigger event(s) for the update, analysis of the effects of such event(s) on the company’s outlook, valuation and recommendation
Quality Flexible presentation style, but of a similar standard of quality to those issued for voluntarily followed firms
Panel B: Sample distribution of analyst reports issued under the Scheme
Year Number of reports Number of firms Number of brokers Number of forecasts % of reports with forecasts Number of pages 2004 497 61 9 479 0.96 5.45 2005 827 95 12 791 0.96 4.95 2006 991 154 13 973 0.98 6.13 2007 840 150 12 819 0.98 5.18 Total 3,155 154 13 3,062 0.97 5.46
Panel C: Research firms participating in the Scheme
Broker code Broker name Number of
firms
Number of reports
Average number of pages per report
BNP BNP Paribas Peregrine Securities 6 48 4.04
CIMB CIMB-GK Research 14 125 4.50
CLSA CLSA (Singapore) 30 233 2.76
DBS DBS Vickers Research 51 539 4.75
DMG DMG & Partners Securities 19 225 7.26
KIM ENG Kim Eng Research 22 250 4.78
NRA NRA Capital 45 350 4.60
OCBC OCBC Investment Research 38 487 6.65
PHILLIP Phillip Securities Research 40 355 5.89
SIAS SIAS Research 33 153 7.18
SP Standard & Poor’s 13 48 3.63
UOB UOB Kay Hian Research 35 193 6.87
WESTCOMB Westcomb Securities 24 148 5.99
Eligibility to join the Scheme
Companies Listed on SGX Mainboard or on SGX Sesdaq (now SGX CATALIST) Research
firms
Meet all of the following conditions:
(i) Licensed or exempted from licensing under the Financial Advisers Act (FAA)
(ii) Have an established track record in issuing or promulgating analyses or reports concerning securities (iii) Have a research team comprising at least three analysts, each with at least three years of relevant
Appendix 2: Variable Definitions
Dependent variables:
FE
forecast error, computed as (forecast earnings ˗ actual earnings)/stock price at the beginning
of the fiscal year
ABSFE
absolute value of FE
CAR(REV) or
CAR(ERN)
cumulative abnormal returns in the three-day (-1, 1) window around the forecast revision
date CAR(REV), or the earnings announcement date CAR(ERN)). Abnormal return is
computed using the market model estimated with daily stock and market returns in the (-100,
-10) window prior to the event. Market returns are based on the Straits Times Index.
ABS_CAR(ERN) absolute value of CAR(ERN)
ABVOL(REV) or
ABVOL(ERN)
cumulative abnormal trading volume in the (-1, 1) window around the forecast revisions
date, ABVOL(REV) or earnings announcement date (ABVOL(ERN)). Abnormal volume is
computed as the share volume minus the mean daily volume in the (-100, -10) window prior
to the event, scaled by the mean daily volume.
SYNC
stock price synchronicity, measured as the logarithmic transformation of R
2/(1 - R
2), where
R
2is the R-squared from the market model, estimated using weekly stock and market returns
over a calendar year, provided that there are a minimum of 30 weekly observations available
in the year (on average, 52 weeks used)
MEDIA
media coverage, measured as the number of media mentions in a calendar year for a
company name appearing in either the heading or the lead paragraph in any news source in
the Factiva database
IPT
decile rank of the timeliness of earnings, where timeliness is calculated as
11 12 1 BH BHm 0.5 m
,
and BHm is the buy-and-hold return from the beginning of the fiscal year to the end of month
m
SPREAD
relative quoted spread, calculated as the daily average quoted spread, scaled by the midpoint
of bid and ask prices
DEPTH
quoted depth, equal to the natural log of the daily average dollar value of shares available to
trade at the best bid and ask prices over the calendar year
VOLUME
trading volume, equal to the natural log of the average daily value of shares traded
AMIHUDP
Amihud’s measure of the price impact of trades, calculated as the absolute daily return
divided by daily share volume, multiplied by 1,000,000, and then averaged over the calendar
year
Variables of interest:
SGXSP
(firm level) dummy variable for SGX-sponsored firms, taking the value 1 if the firm is an
SGX-sponsored firm, and 0 otherwise
SPONSOR
(year level) dummy variable, taking the value 1 if the firm-year observation relates to an
SGX-sponsored firm, and 0 otherwise
POST
dummy variable taking the value 0 if it is before the SGX Scheme, and 1 otherwise
Independent variables:
ABSRET
absolute value of stock returns in the previous calendar year
ABSREV
absolute value of REV
DOWN
indicator variable, equal to 1 if the forecast is a downward revision
ECHG
absolute value of earnings change, deflated by total assets
EPS
earnings per share
HORIZON
number of days between forecasts and earnings announcement dates, scaled by 365
INTANGIBLE
ratio of intangible assets to total assets
ISSUE
dummy variable, equal to 1 for firms issuing new equity in the fiscal year
KURT
kurtosis of weekly returns in the previous calendar year
LEV
ratio of total liabilities to total assets
LOSS
dummy variable, equal to 1 if the firm reports negative operating earnings
MB
market-to-book ratio
PRICE
natural log of average stock price over the
calendar year
MSCI
dummy variable for firms included in the Morgan Stanley Capital International country index
N_ANALYSTS number of analysts issuing forecasts for the firms
RETURN
raw stock return in the past
calendar year
REV
difference between the new and the previous forecast issued by the same analyst for the same
firm, scaled by the stock price at the beginning of the fiscal year
ROE
return on equity, calculated as net income divided by common shareholders’ equity
RSQ
R-squared from the market model, estimated from the daily returns in the previous calendar
year
SIZE
natural log of total assets (in thousands of dollars)
SKEW
skewness of weekly returns in the previous calendar year
Appendix 3: Self-Selection Issues
A3.1 Prediction regressions of analyst coverage and sponsored firms
The SGX Scheme setting involves sequential self-selection. In a first step, analysts choose the firms on
which to provide research coverage, and in the next step, firms that do not attract voluntary analyst coverage
self-select to join the Scheme. Analyses that ignore the first-stage self-selection could be potentially biased, as
although all firms are observed in the first selection stage by analysts, only a censored sample of firms (viz.,
those that fail to attract voluntary analyst coverage) are included in the second stage analysis. If unobservable
determinants of selection in the first-stage were correlated with those in the second stage, then analyses ignoring
this correlation would be biased (Arendt and Holm 2006). We check for this potential bias by simultaneously
estimating the following Probit regressions and testing for correlation between the residuals in the two
equations:
1Pr(NO_ANALYST
it=1) = Ω(
+
Y
it+ YEAR FIXED-EFFECTS +
e
it)
(A1)
Pr(SPONSOR
it=1) = Ω(
+
Z
it+ YEAR FIXED-EFFECTS +
e
it)
(A2)
where NO_ANALYSTit takes the value 1 for firms that are not voluntarily covered by analysts and 0 for firms
with analyst coverage; SPONSOR
itis a firm-year specific dummy variable taking the value 1 for firms that join
the SGX Scheme, and the value of 0 for firms without analyst following;
Y
it andZ
it are vectors of the variablesthat predict voluntary coverage by analysts and that predict firms joining the sponsorship Scheme, respectively.
The predictor variables employed in the regression Equation (A1) are those that previous studies have found to
be influential in the choice of analysts to follow a firm voluntarily. The decision to use these variables is based
on the argument that an analyst’s decision to cover a firm voluntarily is at least partly based on the balance of
benefits and costs of initiating coverage (e.g., O’Brien and Bhushan 1990). As the benefits from providing
research coverage are greater for firms with greater investor trading interest, information asymmetry and
external financing needs, the determinants of analyst-following that we consider are firm-size, market-to-book
ratio, trading volume, stock return volatility, correlation of company returns with market returns, stock returns,
investments in intangible assets and, equity issuance (e.g., Bhushan 1989; O’Brien and Bhushan 1990; Lang
and Lundholm 1996; Barth, Kasznik, and McNichols 2001; Lang, Lins, and Miller 2004). We also employ these
variables to predict a firm’s choice for joining the SGX Scheme since firms which require more external
financing and those which face greater information asymmetry are likely to benefit more from joining the
Scheme. Finally, we add firm level membership in the Morgan Stanley Capital International (MSCI) country
index in the prediction model for voluntary analyst coverage, in accordance with Ferreira and Matos (2008),
who show that institutional investors prefer to invest in firms included in this index, and that a firm’s
membership in this index is likely to motivate analysts to voluntarily follow that firm.
Table A1 presents the results from estimating Equations A1 and A2, using observations from the sample
period 2004 to 2007. From Column (1), which reports the results for Equation A1, we find that smaller firms
and those with lower trading volume, higher return volatility and higher firm-specific information (as proxied
by lower R
2from market model regressions) are more likely to be passed up by analysts when they select firms
to follow voluntarily. Firms that have lower stock returns and firms that do not tend to issue new equity are also
more likely to be passed up. These findings are consistent with our own expectations and with the findings of
prior studies. Column (2) shows that firms with larger trading volume, lower volatility, greater (lesser)
market-wide (firm-specific) information and higher stock returns are more likely to join the SGX Scheme.
Furthermore, the correlation coefficient in residuals across regression Equations A1 and A2 are found to
be highly insignificant (
p
-value = 0.830), implying that self-selection by analysts does not induce biases in
subsequent analyses that rely only on firms without analyst coverage. Hence, our comparisons across sponsored
firms and not-followed firms all control for only one stage of self-selection, namely for firms self-selecting to
join the Scheme.
A3.2 Difference-in-differences propensity-score matching estimator
To control for potential self-selection biases that arise from firms choosing to join the SGX Scheme, our
tests in Section 4.2 (for comparing the information environment and liquidity across sponsored and
not-followed firms) are based on a propensity-matching estimator with difference-in-differences analysis. This
approach allows us to construct counterfactuals that permit both cross-sectional differences in observables and
time-invariant differences in unobservables across the treatment and comparison firms (Todd 1999, 2008).
Based on Kirk (2011), we proceed as follows to obtain propensity scores and our matched sample of
not-followed firms:
Step 1: We estimate a probit regression of Equation A2 to obtain the probabilities from the model as propensity
scores for each firm-year observation. The output is almost identical to that shown in the second column
of Table A1.
Step 2: Using the propensity scores generated in Step 1, we match (without replacement) each sponsored firm to
a ‘not-followed’ firm with the closest propensity score (within a 0.02 caliper) within the same year.
Step 3: We perform the difference-in-differences analysis on the sponsored firms and the propensity score
matched sample of the not-followed firms across the introduction of the SGX Scheme, as described in
Section 4.2.
These procedures yield a matched not-followed firm for 109 of the 132 sponsored firms. Following
Rosenbaum and Rubin (1985), we test the reliability of the propensity score matches, and use a two-sample
t
-test to check if there are significant differences in covariate means between the two groups.
2Based on the
results reported in Table A2, we find no significant differences after matching for those variables at the
individual level. When considered jointly, the sponsored firms and the not-followed firms differ insignificantly
based, on Hotelling’s T
2-test (
p
= 0.346).
A.3.3
Endogenous treatment effects model
In Section 4.3, we implement an endogenous treatment effects model for tests to compare sponsored and
voluntarily followed firms. This approach is essentially an instrumental variables technique, where the
endogenous variable is ordinal or binary (Khandker, Koolwal, and Samad, Chapter 15, 2010; Angrist and
Pischke 2008, Chapter 4, Section 4.6; Wooldridge 2010, Section 21.4.1, pp. 938-939). The idea behind this
2 Additionally, we confirm that the treatment and control samples have common support by plotting the kernel density function o f estimated propensity scores in the treatment and control groups.
approach is to find an observable exogenous variable that influences treatment selection (instruments), but not
the outcome variable for the treated. The first equation is estimated by using a probit regression to predict the
probability of treatment based on observable exogenous variables. The second equation is either a linear or a
probit regression for the outcome variables. This approach is useful in producing improved estimates of average
treatment effects, especially when the causes of the selection process are observable and are correctly specified
in the selection equation. However, as is the case with an instrumental variables model or a Heckman model,
the treatment effects model is sensitive to model ‘mis-specification’, which occurs when important determinants
of selection that are also correlated with second-stage outcome variables which are not included in the model.
The treatment effects model can also be mis-specified if unobservables in the two stages are not binormally
distributed. In these cases, the results of the treatment effect model may remain biased.
TABLE A1: Prediction regressions for voluntary analyst following and for firms joining the SGX Scheme
This table presents probit estimates for when the dependent variable is either NO_ANALYSTit or SPONSORit for the 2004–2007 period, inclusive.
NO_ANALYSTit takes the value of 1 for firms that are not voluntarily covered by analysts (i.e., sponsored and not-followed firms), and 0 for firms with voluntary
analyst coverage. SPONSORit takes the value 1 for firms that join the SGX Scheme (SF firms), and the value 0 for firms without analyst following (not-followed
firms). Analysis of NO_ANALYST is based on the entire sample, while analysis based on SPONSOR excludes voluntarily followed firms (i.e., the second column excludes firms that have voluntary analyst coverage). The full variable definitions are presented in Appendix 2. Robust standard errors clustered at the firm-level are reported in parenthesis. *** indicates p < 0.01, ** indicates p < 0.05 and * indicates p < 0.1. The sample for this analysis is described in Table 1 (Panels B and C), and it consists of 944 firm-years for not-followed firms, 358 firm-years for sponsored firms and 587 firms year for voluntarily followed firms.
Dependent variable:
VARIABLES NO_ANALYST SPONSOR
CONSTANT 5.730*** -3.527** (0.603) (1.483) SIZE -0.244*** 0.148 (0.044) (0.107) MB -0.006 -0.006 (0.004) (0.006) VOLUME -0.155*** 0.103* (0.031) (0.058) VOLATILITY 1.289* -3.957*** (0.703) (0.983) RSQ -3.220*** 2.845* (0.735) (1.685) RETURN -0.132** 0.260*** (0.064) (0.089) INTANGIBLE -0.643 0.354 (0.538) (0.722) ISSUE -0.184* 0.098 (0.095) (0.130) MSCI -0.195* (0.117)
Year fixed effects YES YES
Observations 1,889 1,302 Pseudo R-squared 0.285 0.132 Wald test of (X = 0) 93.460 (p < 0.001) LR test of indep. Eqns. Chi 2 (1) = 0.050 (p = 0.830)
TABLE A2: Firm characteristics across sponsored firms and matched control firms
This table presents the average values for selected firm characteristics for sponsored (treated) firms and their matched not-followed (control) firms. The table also reports differences in these averages across the samples and the corresponding t-statistics. The matched control firms are obtained through propensity-score estimation of Equation (A2), using the most recent data prior to a firm joining the SGX Scheme. The sample for this analysis is described in Table 1, Panel B.
Variable
Treated Control
Difference t-stat p > t (No. of firms =109) (No. of firms =109)
SIZE 11.658 11.888 -0.230 -1.440 0.150 MB 2.462 3.632 -1.170 -0.830 0.407 VOLUME 11.425 11.012 0.413 1.870 0.063 VOLATILITY 0.119 0.107 0.012 1.310 0.192 RSQ 0.059 0.049 0.011 1.170 0.242 RETURN 0.191 0.212 -0.021 -0.280 0.778 INTANGIBLE 0.028 0.040 -0.012 -1.000 0.319 ISSUE 0.385 0.330 0.055 0.850 0.399 (Hotelling’s T2-test: F = 1.128, p = 0.346)
TABLE 1 Sample selection procedures
This table contains the frequencies of firms and firm-year observations available for each type of test. Panel A presents the base sample of the raw data, and for the tests of quality of forecasts and revisions, while the remaining panels present the available samples after considering the data requirements for difference-in-difference tests across sponsored versus not followed firms (Panel B), and cross-sectional tests for sponsored and voluntarily followed firms (Panel C).
Panel A: Sample frequencies used in tests of the quality of forecasts, 2004 to 2007
Sample selection procedures
Sponsored Voluntarily followed firms forecasts /
revisions firms
forecasts / revisions
SGX-sponsored forecasts for 154 3,062
One-year-ahead earnings forecasts from IBES, not sponsored by SGX 355 11,890
Total forecasts 154 3,062 355 11,890
Matched with DataStream 143 2,663 299 11,364
After eliminating forecast errors greater than 100% of share price 142 2,621 296 11,285
Final forecasts sample (for Table 3) 132 2,385 224 10,769
Final revisions sample (for Table 4) 132 1,012 224 7,504
Panel B: Sample frequencies for the tests of difference-in-differences, 2002 to 2007 (Table 5)
Sample selection procedures Sponsored Not Followed
firms firm-years firms firm-years Sponsored and not-followed firms available on DataStream 132 558 375 1374*
Final matched sample (for Table 5, Panel A) 109 456 109 559
Final matched sample, with additional data available on stock liquidity
measures (for Table 5, Panel B) 66 176 66 206
*For 2004 to 2007, the corresponding figures are 375 firms and 944 firm-years.
Panel C: Sample frequencies for the treatment effects models, 2004 to 2007 (Table 6)
Sample selection procedures Sponsored Voluntarily followed firms firm-years firms firm-years
Final sample (for Table 6, Panel A) 132 358 224 587
Final sample, with additional data available on stock liquidity measures
TABLE 2 Summary statistics
Panels A and B present the time and the industry distributions of sample observations, respectively. Panel C compares summary statistics on forecast properties across sponsored (SF) and voluntarily-followed (VF) firms. Panel D shows a comparison of firm characteristics, information environment attributes and stock liquidity measures across these two groups, and Panel E compares the variables across matched sponsored and not-followed (NF) firms. For Panels C, D and E, the number of observations are presented in parenthesis at the top of each set of variables. The two-tailed p-values (in parentheses) for the tests of differences between groups are based on median scores. Full definitions are in Appendix 2.
A. Sample distribution by year, of analyst forecasts and revisions for sponsored and voluntarily followed firms
Sponsored Voluntarily followed
No. of firms No. of
forecasts No. of revisions No. of firms No. of forecasts No. of revisions 2004 56 311 114 146 3,845 2,974 2005 80 630 276 147 2,305 1,513 2006 120 743 316 137 2,150 1,322 2007 128 701 306 145 2,469 1,695 Full period (2004-2007) 132 2,385 1,012 224 10,769 7,504
B. Sample distribution by industry, of analyst forecasts and revisions for sponsored and voluntarily followed firms
Sponsored Voluntarily followed
Industry No. of firms No. of forecasts No. of revisions No. of firms No. of forecasts No. of revisions Basic materials 8 129 61 10 147 108 Consumer goods 25 451 194 33 550 355 Consumer services 9 127 50 24 1,279 919 Financials 8 172 76 39 3,666 2,619 Health care 8 104 45 6 143 83 Industrials 51 962 413 68 2,445 1,621
Oil and gas 3 62 27 7 609 411
Technology 18 339 128 29 1,035 748
Telecommunication s
0 0 0 3 771 564
Utilities 2 39 18 5 124 76
C. Univariate statistics on analyst forecasts
Sponsored Voluntarily followed Difference: SF vs. VF*
( N=132 firms, 2,385 forecasts) (N=224 firms, 10,769 forecasts)
Mean Std. dev. Median Mean Std. dev. Median in median p-value
FE 0.029 0.147 0.014 -0.001 0.105 0.005 0.009 <0.001
ABSFE 0.092 0.130 0.048 0.049 0.098 0.016 0.032 <0.001
HORIZON 0.430 0.281 0.392 0.457 0.286 0.432 -0.040 <0.001
N_ANALYSTS 2.780 0.929 3.000 15.432 8.251 16.000 -13.000 <0.001 (N=132 firms, 1,012 revisions) (N=224 firms, 7,504, revisions)
REV -0.006 0.063 -0.002 0.002 0.037 0.001 -0.003 0.003
TABLE 2 contd.
D. Univariate statistics for sponsored firms and voluntarily followed firms in the post-Scheme period Sponsored vs. Voluntarily followed firms
Sponsored Voluntarily followed Difference in
(No. of firms = 132) (No. of firms =224) medians: Mean Std. dev Median Mean Std. dev Median value p-value Measures of firm attributes: (SF=358, VF=587, Firm-years)
SIZE 12.078 1.170 11.983 13.213 1.971 12.963 -0.980 <0.001 MB 2.131 5.431 0.949 3.329 10.221 1.392 -0.443 <0.001 LOSS 0.087 0.282 0.000 0.058 0.234 0.000 0.000 0.120 LEV 0.499 0.250 0.479 0.476 0.239 0.452 0.027 0.194 ROE 0.206 0.475 0.177 0.218 0.546 0.191 -0.014 0.212 RETURN 0.268 0.599 0.139 0.408 0.677 0.274 -0.135 <0.001 INTANGIBLE 0.034 0.075 0.005 0.041 0.081 0.004 0.001 0.926 VOLATILITY 0.102 0.061 0.087 0.104 0.065 0.088 -0.001 0.860 Measures of information environment: (SF=358, VF=587, Firm-years)
ABS_CAR(ERN) 0.133 0.087 0.116 0.111 0.098 0.090 0.026 <0.001 ABVOL(ERN) 7.714 15.131 2.409 4.459 10.467 1.435 0.974 0.066
IPT 5.955 2.761 6.000 5.477 2.829 6.000 0.000 0.563
SYNC -3.047 1.975 -2.671 -2.443 1.789 -2.025 -0.646 <0.001 MEDIA 43.249 87.639 25.000 100.961 158.435 42.000 -17.000 <0.001 Measures of stock liquidity: (SF=144, VF=274, Firm-years)
SPREAD 0.089 0.094 0.058 0.041 0.057 0.019 0.039 <0.001 DEPTH 10.271 1.114 10.219 11.270 1.395 11.211 -0.992 <0.001 VOLUME 11.264 1.720 11.316 12.260 1.608 12.432 -1.116 <0.001 AMIHUDP 1.194 2.791 0.269 0.669 2.670 0.059 0.210 <0.001
TABLE 2 contd.
E. Univariate statistics for sponsored firms and not-followed firms in the post-Scheme period
Matched Sponsored vs. Matched Not-followed firms
Matched Sponsored Matched Not-followed Difference in (No. of firms = 109) (No. of firms = 109) medians: Mean Std. dev Median Mean Std. dev Median Value p-value Measures of firm attributes: (Matched SF=292, Matched NF=318, Firm-years)
SIZE 11.852 1.031 11.734 11.927 1.371 11.941 -0.207 0.012 MB 2.245 5.880 0.963 5.001 17.902 0.731 0.232 <0.001 LOSS 0.103 0.304 0.000 0.160 0.368 0.000 0.000 0.036 LEV 0.489 0.256 0.461 0.461 0.266 0.441 0.020 0.418 ROE 0.181 0.485 0.161 0.039 0.491 0.069 0.092 <0.001 RETURN 0.258 0.586 0.110 0.203 0.620 0.105 0.005 0.573 INTANGIBLE 0.031 0.076 0.002 0.037 0.099 0.000 0.002 <0.001 VOLATILITY 0.107 0.065 0.094 0.108 0.063 0.093 0.001 0.688 Measures of information environment: (SF=292, Matched NF=318, Firm-years)
ABS_CAR(ERN) 0.139 0.092 0.124 0.151 0.133 0.119 0.005 0.517 ABVOL(ERN) 7.786 15.310 2.318 3.635 10.259 0.465 1.853 0.009
IPT 5.979 2.768 6.000 5.676 2.888 6.000 0.000 0.145
SYNC -3.177 1.986 -2.723 -3.609 2.073 -3.249 0.526 0.019 MEDIA 30.041 23.080 23.000 28.720 31.502 19.000 4.000 0.003 Measures of stock liquidity: (SF=117, Matched NF=121, Firm-years)
SPREAD 0.097 0.097 0.070 0.114 0.097 0.079 -0.009 0.873 DEPTH 10.146 1.062 10.066 10.221 1.196 10.094 -0.028 0.959 VOLUME 11.055 1.734 10.957 11.007 1.904 11.207 -0.250 0.878 AMIHUDP 1.420 3.050 0.490 3.115 8.603 0.506 -0.016 0.715
TABLE 3 Regression of analyst forecast errors on sponsored versus voluntary coverage
This table presents the results from regressions of analyst forecast errors on the variable SPONSOR, an indicator variable set to 1 for a sponsored firm, or set to 0 otherwise. The sample consists of all forecasts made for 132 sponsored and 224 voluntarily followed firms during the period 2004 to 2007, inclusive. Panel A uses all analysts’ forecasts, whereas Panel B includes only the last forecast made for each firm prior to its annual earnings announcement. All variables are defined in Appendix 2. The parentheses show robust standard errors that control for firm cluster effects. Asterisks indicate probability levels (*** indicates p<0.01, ** indicates p<0.05 and * indicates p<0.10).
Panel A: Using all available forecasts Panel B: Using only the latest forecasts prior to
earnings announcements
FE ABSFE FE ABSFE
VARIABLES Selection
Model Main Model
Selection
Model Main Model
Selection
Model Main Model
Selection
Model Main Model
CONSTANT 7.475*** 0.033 7.387*** 0.060 3.596*** -0.023 2.289** -0.059 (1.340) (0.044) (1.372) (0.043) (0.874) (0.054) (0.966) (0.074) SPONSOR 0.010 0.026* 0.004 0.166*** (0.016) (0.015) (0.026) (0.049) SIZE -0.416*** -0.002 -0.417*** 0.002 -0.201*** 0.003 -0.176*** 0.006 (0.090) (0.004) (0.090) (0.003) (0.060) (0.004) (0.052) (0.005) LOSS -0.044** 0.009 -0.116*** 0.023 (0.019) (0.016) (0.026) (0.026) HORIZON -0.004 -0.008* 0.036 -0.028 (0.005) (0.005) (0.026) (0.024) N_ANALYSTS 0.001 -0.003*** 0.001 -0.003*** (0.001) (0.001) (0.001) (0.001) LEV 0.057** -0.039* 0.043* -0.003 (0.024) (0.021) (0.025) (0.024) EPS -0.071*** 0.049** -0.122*** 0.099*** (0.021) (0.020) (0.030) (0.033) ECHG -0.124** 0.188*** 0.038 0.127** (0.049) (0.037) (0.078) (0.058) MB -0.027 -0.028 -0.023* -0.023** (0.018) (0.018) (0.013) (0.010) VOLUME -0.219*** -0.209*** -0.092* 0.005 (0.060) (0.065) (0.049) (0.052) VOLATILITY 1.571 1.693 -0.951 -0.255 (1.753) (1.777) (1.249) (1.094) RSQ -1.724* -1.768* -1.967** -1.981*** (0.938) (0.941) (0.844) (0.738)
INTANGIBLE -1.179 -1.187 -0.743 -0.669 (0.917) (0.914) (0.895) (0.625) MSCI -0.163 -0.197 -0.142 -0.305** (0.189) (0.205) (0.151) (0.132) ISSUE -0.263* -0.271* -0.081 -0.186* (0.157) (0.158) (0.126) (0.102) RETURN -0.051 -0.063 0.006 -0.067 (0.112) (0.115) (0.082) (0.067)
Year fixed effects YES YES YES YES YES YES YES YES
Analyst fixed effects YES YES YES YES YES YES YES YES
Pseudo R-squared 0.114 0.156 0.127 0.104
TABLE 4 Market reactions to forecast revisions
This table presents the results from regressions of market reactions on either revisions in analyst forecasts (REV) or absolute value of revisions (ABSREV). The sample consists of forecast revisions for SGX-sponsored and voluntarily followed firms listed in Singapore during 2004 to 2007. The alternative measures of market reactions to analyst revisions are CAR(REV) and ABVOL(REV). SPONSOR̂ is the predicted value from the probit regression of Equation 1(a). The definitions of all variables are given in Appendix 2. Robust standard errors that control for firm cluster effects are given in parentheses (*** indicates p<0.01, ** indicates p<0.05 and * indicates p<0.1).
VARIABLES CAR(REV) ABVOL(REV)
CONSTANT -0.028 1.085 (0.030) (1.709) REV 0.045 (0.033) REV*𝐒𝐏𝐎𝐍𝐒𝐎𝐑̂ -0.029 (0.096) ABSREV 9.860*** (3.672) ABSREV*𝐒𝐏𝐎𝐍𝐒𝐎𝐑̂ -17.450* (9.434) SPONSOR̂ 0.027** 3.051*** (0.013) (0.984) SIZE 0.001 -0.070 (0.001) (0.074) MB -0.000*** 0.002* (0.000) (0.001) VOLATILITY -0.040 5.253** (0.028) (2.494) VOLUME 0.001 -0.026 (0.002) (0.081) N_ANALYSTS 0.000 0.025 (0.000) (0.022) DOWN -0.010*** 0.041 (0.002) (0.130) RSQ -0.006 -0.927 (0.009) (0.797)
Year fixed effects YES YES
Analyst fixed effects YES YES
R-squared 0.021 0.025
Observations 8,516 8,516
F test of REV + REV* SPONSOR̂ =0
Chi-square =0.040 (p= 0.834). F test of ABSREV + ABSREV*SPONSOR̂ =0
Chi-square = 1.170 (p= 0.280).
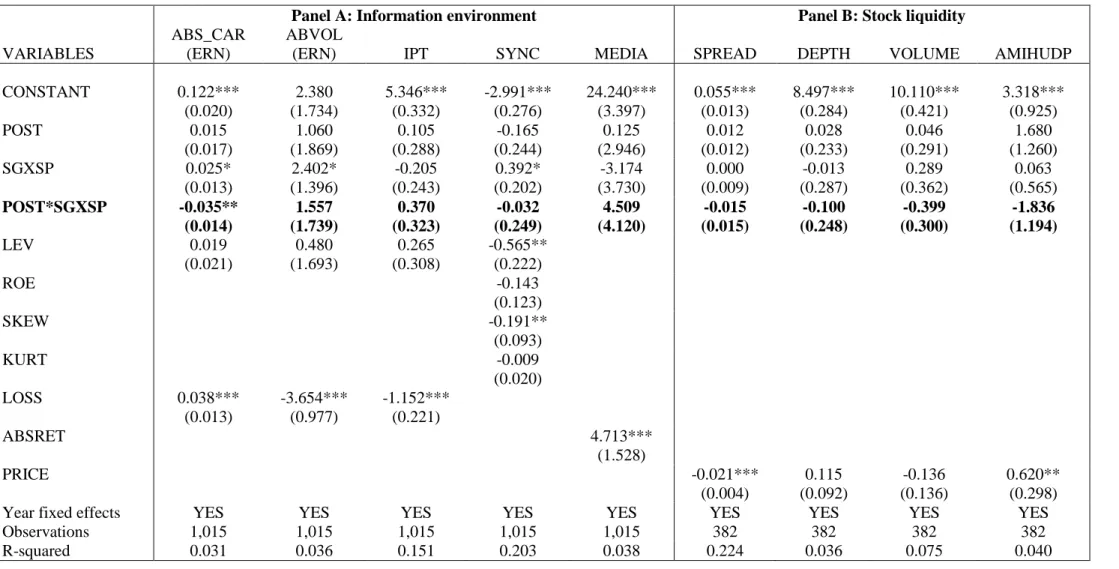
TABLE 5 Effects of joining the SGX Scheme on the information environment and stock liquidity
This table reports on the impact of joining the SGX scheme on the information environment and the stock liquidity of firms. The research design is based on a difference-in-differences propensity-score matched estimator that compares changes in these constructs for 109 sponsored firms joining the SGX scheme compared to corresponding changes in propensity-score matched not followed firms. The sample for this table consists of sponsored firms and matched not-followed firms during 2002 to 2007, inclusive. The information environment is measured by (i) price and volume reaction to earnings announcements (ABS_CAR(ERN) and ABVOL(ERN)), (ii) the intra-period timeliness of earnings (IPT), (iii) stock price synchronicity (SYNC), and (iv) media coverage (MEDIA). Stock liquidity is measured by (i) bid-ask spread (SPREAD), (ii) market depth (DEPTH), (iii) volume traded (VOLUME), and (iv) price response to a dollar of shares traded (AMIHUDP). All variables are as defined in Appendix 2. Robust standard errors that control for firm cluster effects are given in parentheses (*** indicates p<0.01, ** indicates p<0.05 and * indicates p<0.1).
Panel A: Information environment Panel B: Stock liquidity
VARIABLES
ABS_CAR (ERN)
ABVOL
(ERN) IPT SYNC MEDIA SPREAD DEPTH VOLUME AMIHUDP
CONSTANT 0.122*** 2.380 5.346*** -2.991*** 24.240*** 0.055*** 8.497*** 10.110*** 3.318*** (0.020) (1.734) (0.332) (0.276) (3.397) (0.013) (0.284) (0.421) (0.925) POST 0.015 1.060 0.105 -0.165 0.125 0.012 0.028 0.046 1.680 (0.017) (1.869) (0.288) (0.244) (2.946) (0.012) (0.233) (0.291) (1.260) SGXSP 0.025* 2.402* -0.205 0.392* -3.174 0.000 -0.013 0.289 0.063 (0.013) (1.396) (0.243) (0.202) (3.730) (0.009) (0.287) (0.362) (0.565) POST*SGXSP -0.035** 1.557 0.370 -0.032 4.509 -0.015 -0.100 -0.399 -1.836 (0.014) (1.739) (0.323) (0.249) (4.120) (0.015) (0.248) (0.300) (1.194) LEV 0.019 0.480 0.265 -0.565** (0.021) (1.693) (0.308) (0.222) ROE -0.143 (0.123) SKEW -0.191** (0.093) KURT -0.009 (0.020) LOSS 0.038*** -3.654*** -1.152*** (0.013) (0.977) (0.221) ABSRET 4.713*** (1.528) PRICE -0.021*** 0.115 -0.136 0.620** (0.004) (0.092) (0.136) (0.298)
Year fixed effects YES YES YES YES YES YES YES YES YES
Observations 1,015 1,015 1,015 1,015 1,015 382 382 382 382
TABLE 6 Treatment-effects analysis of the information environment and stock liquidity for sponsored and voluntarily followed firms in the
post-Scheme period 2004-2007
Panel A reports the treatment effects of a firm joining the SGX Scheme in terms of the price and volume reactions to earnings announcements (ABS_CAR(ERN) and ABVOL(ERN)), the intra-period timeliness of earnings (IPT), the stock price synchronicity (SYNC) and the level of media coverage (MEDIA). Panel B presents the results for four stock liquidity measures: (i) bid-ask spread (SPREAD), (ii) market depth (DEPTH), (iii) traded volume (VOLUME), and (iv) price impact of trade (AMIHUDP). All variables are as defined in Appendix 2. Robust standard errors that control for firm cluster effects are given in parentheses (*** indicates p<0.01, ** indicates p<0.05 and * indicates p<0.1).
Panel A: The information environment
ABS_CAR(ERN) ABVOL(ERN) IPT SYNC MEDIA
VARIABLES Selection Model Model Main Selection Model Model Main Selection Model Model Main Selection Model Model Main Selection Model Model Main CONSTANT 3.481*** 0.006 4.233*** 20.330*** 4.236*** 4.219** 3.606*** -6.554*** 3.898*** -242.300*** (0.729) (0.040) (0.771) (5.372) (0.777) (1.679) (0.800) (0.916) (0.752) (80.010) SPONSOR 0.137*** 0.794 0.280 -1.540*** -152.100*** (0.021) (3.059) (0.948) (0.365) (27.400) SIZE -0.188*** 0.000 -0.227*** -0.929*** -0.228*** 0.009 -0.189*** 0.164*** -0.213*** 29.810*** (0.045) (0.002) (0.052) (0.327) (0.053) (0.104) (0.052) (0.043) (0.054) (6.824) MB -0.020*** 0.002* -0.016** 0.046 -0.016** -0.004 -0.015** 0.004 -0.013* -0.072 (0.008) (0.001) (0.008) (0.046) (0.008) (0.012) (0.007) (0.004) (0.007) (0.359) VOLUME -0.099*** -0.118** -0.117** -0.089* 0.201*** -0.077* (0.038) (0.048) (0.049) (0.046) (0.048) (0.041) VOLATILITY -1.182 0.392*** -1.702 -18.590*** -1.702 0.091 -1.100 -1.888* -88.760 (1.000) (0.073) (1.056) (6.856) (1.080) (1.686) (0.936) (0.990) (72.090) RSQ -0.786 -1.204 -1.231 -2.404*** -3.268*** (0.584) (0.833) (0.830) (0.774) (0.777) INTANGIBLE -0.269 -0.410 -0.448 -0.535 -0.676 (0.505) (0.819) (0.826) (0.664) (0.684) ISSUE 0.020 -0.067 -0.057 -0.071 -0.141 (0.087) (0.133) (0.134) (0.109) (0.097) RETURN -0.103* 0.028 0.023 -0.109 0.011 (0.057) (0.079) (0.095) (0.074) (0.069) MSCI -0.163 -0.195 -0.184 -0.150 -0.158 (0.110) (0.168) (0.167) (0.143) (0.122) LOSS 0.037** -0.922 -1.536*** (0.018) (2.348) (0.387) LEV 0.020 1.002 1.227*** -0.386** (0.016) (1.774) (0.377) (0.186) ROE -0.082 (0.089) SKEW -0.087 (0.080) KURT -0.057*** (0.019) ABSRET -2.611 (7.571)
Year fixed effects YES YES YES YES YES YES YES YES YES YES
Pseudo R-squared 0.191 0.035 0.087 0.375 0.344
Panel B: Stock liquidity
SPREAD DEPTH VOLUME AMIHUDP
VARIABLES Selection Model Main Model Selection Model Main Model Selection Model Main Model Selection Model Main Model CONSTANT 5.435*** 0.044 4.792*** 6.550*** 4.704*** 10.620*** 3.937*** 1.006 (1.009) (0.041) (0.926) (0.779) (0.818) (1.123) (1.507) (1.640) SPONSOR 0.079*** -1.898*** -2.598*** 3.496*** (0.010) (0.140) (0.139) (1.180) SIZE -0.183** -0.003 -0.093 0.358*** -0.042 0.185** -0.120 -0.144 (0.072) (0.003) (0.067) (0.056) (0.055) (0.080) (0.076) (0.119) MB -0.018** -0.027*** -0.054*** -0.018 (0.009) (0.006) (0.009) (0.013) VOLUME -0.312*** -0.356*** -0.387*** -0.253*** (0.061) (0.045) (0.046) (0.072) VOLATILITY 0.813 0.045 1.694 2.967** 1.815 6.616*** 1.802 5.555* (1.575) (0.070) (1.524) (1.319) (1.619) (1.965) (1.293) (3.304) RSQ 0.792 0.765 -0.359 0.416 (1.108) (0.666) (0.621) (0.880) INTANGIBLE -0.351 -0.455 0.611 -0.473 (1.017) (0.630) (0.590) (0.707) ISSUE -0.129 -0.100 -0.218*** -0.137 (0.161) (0.130) (0.085) (0.112) RETURN -0.076 0.012 0.0525 -0.146 (0.140) (0.086) (0.070) (0.127) MSCI -0.140 -0.087 0.067 -0.030 (0.190) (0.130) (0.109) (0.151) PRICE -0.018*** 0.228*** -0.043 0.119 (0.004) (0.060) (0.087) (0.171)
Year fixed effects YES YES YES YES YES YES YES YES
Pseudo R-squared 0.457 0.698 0.564 0.208