Mining Feature Importance: Applying Evolutionary Algorithms
within a Web-based Educational System
Behrouz MINAEI-BIDGOLI1, and
Gerd KORTEMEYER2, and
William F. PUNCH1
1 Genetic Algorithms Research and Applications Group (GARAGe), Department of Computer Science & Engineering, Michigan State University
East Lansing, MI 48824, USA, {minaeibi, punch}@cse.msu.edu http://garage.cse.msu.edu
2 Division of Science and Math Education, Michigan State University, LITE lab, East Lansing, MI 48824, USA, [email protected]
http://www.lon-capa.org
ABSTRACT
A key objective of data mining is to uncover the hidden relationships among the objects in given data set. Classification has emerged as a popular task to find the groups of similar objects in order to predict unseen test data points. Classification fusion combines multiple classifications of data into a single classification solution of higher accuracy. Feature extraction aims to reduce the computational cost of feature measurement, increase classifier efficiency, and allow greater classification accuracy based on the process of deriving new features from the original features. Recently web-based educational systems collect vast amounts of data on user patterns, and data mining methods can be applied to these databases to discover interesting associations based on students’ features, problems’ attributes, and the actions taken by students in solving homework and exam problems. This paper represents an approach for classifying students in order to predict their final grades based on features extracted from logged data in an educational web-based system. By weighing feature vectors representing feature importance using a Genetic Algorithm we can optimize the prediction accuracy and obtain significant improvement over raw classification. This work represents a rigorous application of known classifiers as a means of analyzing and comparing use and performance of students who have taken a technical course that was partially/completely administered via the web.
Keywords: Web-based Educational System, Data Mining,
Classification Fusion, Prediction, Genetic Algorithm, Feature Extraction, Feature Importance.
1. INTRODUCTION
The ever-increasing progress of network-distributed computing and particularly the rapid expansion of the web have had a broad impact on society in a relatively short period of time. Education is on the brink of a new era based on these changes. Online delivery of educational instruction provides the opportunity to bring colleges and universities new energy, students, and revenues. Many leading educational institutions are working to establish an online teaching and learning presence. Several web-based educational systems with different capabilities and approaches have been developed to deliver online education in an academic setting. In particular, Michigan State University (MSU) has pioneered some of these systems to provide an infrastructure for online instruction. The research presented here was performed on apart of the latest online educational system developed at MSU, the Learning Online Network with Computer-Assisted Personalized Approach (LON-CAPA).
LON-CAPA is involved with three kinds of large data sets: 1) educational resources such as web pages, demonstrations, simulations, and individualized problems designed for use on homework assignments, quizzes, and examinations; 2) information about users who create, modify, assess, or use these resources; and 3) activity log databases which log actions taken by students in solving homework and exam problems. In other words, we have three ever-growing pools of data.
This paper investigates methods for extracting useful and interesting patterns from these large databases using online educational resources and their recorded paths
within the system. We aim to answer the following research questions: Can we find classes of students? In other words, do there exist groups of students who use these online resources in a similar way? If so, can we predict a class for any individual student? With this information, can we then help a student use the resources better, based on the usage of the resource by other students in their groups?
We find similar patterns of use in the data gathered from LON-CAPA, and eventually make predictions as to the most-beneficial course of studies for each learner based on their past and present usage. The system could then make suggestions to the learner as to how best to proceed.
2. BACKGROUND
Genetic Algorithms (GA) have been shown to be an effective tool to use in data analysis and pattern recognition [1], [2], [3]. An important aspect of GAs in a learning context is their use in pattern recognition. There are two different approaches to applying GA in pattern recognition:
1. Apply a GA directly as a classifier. Bandyopadhyay and Murthy in [4] applied GA to find the decision boundary in N dimensional feature space.
2. Use a GA as an optimization tool for resetting the parameters in other classifiers. Most applications of GAs in pattern recognition optimize some parameters in the classification process. Many researchers have used GAs in feature selection [5], [6], [7], [8]. GAs has been applied to find an optimal set of feature weights that improve classification accuracy. First, a traditional feature extraction method such as Principal Component Analysis (PCA) is applied, and then a classifier such as k-NN is used to calculate the fitness function for GA [9], [10]. Combination of classifiers is another area that GAs have been used to optimize. Kuncheva and Jain in [11] used a GA for selecting the features as well as selecting the types of individual classifiers in their design of a Classifier Fusion System. GA is also used in selecting the prototypes in the case-based classification [12]. In this paper we focus on the second approach and use a GA to optimize a combination of classifiers. Our objective is to predict the students’ final grades based on their web-use features, which are extracted from the homework data. We design, implement, and evaluate a series of pattern classifiers with various parameters in order to compare their performance on a dataset from LON-CAPA. Error rates for the individual classifiers, their combination and the GA optimized combination are presented.
Two approaches are proposed for the problem of feature extraction and selection. The filter model chooses features
by heuristically determined “goodness/relevant” or knowledge, while the wrapper model does this by the feedback of classifier evaluation, or experiment. Research has shown the wrapper model outperforms the filter model comparing the predictive power on unseen data [13]. We propose a wrapper model for feature extraction through setting different weights for features and getting feedback from ensembles of classifiers.
3. DATASETS AND FEATURES
We selected 14 student/course data sets of LON-CAPA courses, which were held at MSU in fall semester 2002 (FS02), spring semester 2003 (SS03), and fall semester 2003 (FS03) as shown in Table 1.
Table 1. 14 of MSU courses which held by LON-CAPA
Course Title Term
ADV 205 Principles of Advertising SS03 BS 111 Biological Science: Cells and Molecules SS02 BS 111 Biological Science: Cells and Molecules SS03 CE 280 Civil Engineering: Intro Environment Eng. SS03 FI 414 Advanced Business Finance (w) SS03 LBS 271 Lyman Briggs School: Physics I FS02 LBS 272 Lyman Briggs School: Physics II SS03 MT 204 Medical Tech.: Mechanisms of Disease SS03 MT 432 Clinic Immun. & Immunohematology SS03 PHY 183 Physics Scientists & Engineers I SS02 PHY 183 Physics Scientists & Engineers I SS03 PHY 231c Introductory Physics I SS03 PHY 232c Introductory Physics II FS03 PHY 232 Introductory Physics II FS03
Table 2. Characteristics of courses which held by LON-CAPA
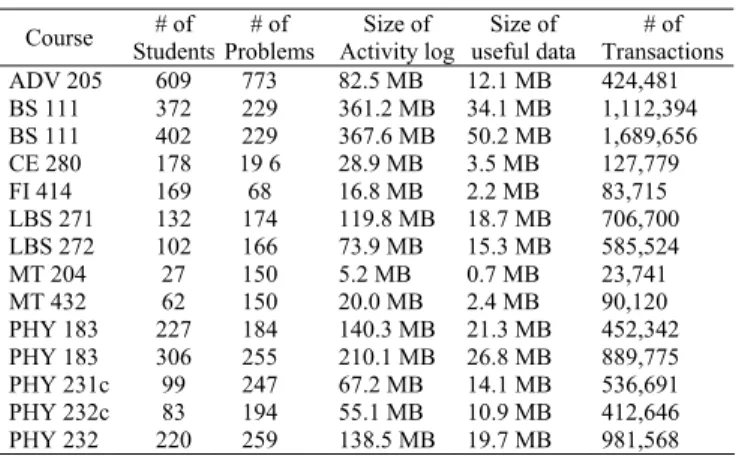
Course Students# of Problems # of Activity log Size of useful data Size of Transactions# of ADV 205 609 773 82.5 MB 12.1 MB 424,481 BS 111 372 229 361.2 MB 34.1 MB 1,112,394 BS 111 402 229 367.6 MB 50.2 MB 1,689,656 CE 280 178 19 6 28.9 MB 3.5 MB 127,779 FI 414 169 68 16.8 MB 2.2 MB 83,715 LBS 271 132 174 119.8 MB 18.7 MB 706,700 LBS 272 102 166 73.9 MB 15.3 MB 585,524 MT 204 27 150 5.2 MB 0.7 MB 23,741 MT 432 62 150 20.0 MB 2.4 MB 90,120 PHY 183 227 184 140.3 MB 21.3 MB 452,342 PHY 183 306 255 210.1 MB 26.8 MB 889,775 PHY 231c 99 247 67.2 MB 14.1 MB 536,691 PHY 232c 83 194 55.1 MB 10.9 MB 412,646 PHY 232 220 259 138.5 MB 19.7 MB 981,568
Table 2 shows the characteristics of these 14 courses; for example the third row of the table shows that the BS111 03 (Biological Science: Cells and Molecules) was held in spring semester 2003 integrated 229 online homework problems, and 402 students used LON-CAPA for this course. the BS111 course had an activity log with approximately 368 MB. Using some perl script modules for cleansing the data, we found 48 MB of useful data in
BS111 SS03 course. We then pulled out from these logged data 1,689,656 transactions (interactions between students and homework/exam/quiz problems) from which from which we extracted the following nine features:
1. Total number of attempts before correct answer is derived
2. Total number of correct answers. (Success rate) 3. Success on the first try
4. Success on the second try 5. Success after 3 to 9 attempts 6. Success after 10 or more attempts
7. Total time from first attempt until the correct answer 8. Total time spent on the problem, regardless of success 9. Participation in the provided online communication
mechanisms with other students and instructional staff Based on the above extracted features in each course, we classify the students, and try to predict for every individual student of test data to which class he/she belongs. We categorize the students with one of two class labels: “Passed” for grades higher than 2.0, and ”Failed” for grades less than or equal to 2.0 where the MSU grading system is based on grades from 0.0 to 4.0.
4. CLASSIFICATION FUSION
Pattern recognition has a wide variety of applications in many different fields, such that it is not possible to come up with a single classifier that can give good results in all cases. The optimal classifier in every case is highly dependent upon the problem domain. In practice, one might come across a case where no single classifier can achieve an acceptable level of accuracy. In such cases it would be better to pool the results of different classifiers to achieve the optimal accuracy. Every classifier operates well on different aspects of the training or test feature vector. As a result, assuming appropriate conditions, combining multiple classifiers may improve classification performance when compared with any single classifier. The scope of this study is restricted to comparing some popular non-parametric pattern classifiers and a single parametric pattern classifier according to the error estimate. Four different classifiers using the LON-CAPA dataset are compared in this study. The classifiers used in this study include Quadratic Bayesian classifier, 1-nearest neighbor (1-NN), k-nearest neighbor (k-NN), Parzen-window.1 These are some of the common classifiers used in most practical classification problems. After some preprocessing operations the optimal k=3 is chosen for kNN algorithm. To improve classification performance, a fusion of classifiers is performed.
1The classifiers are coded in MATLABTM 6.5.
Normaliztion. Having assumed in Bayesian and Parzen-window classifiers that the features are normally distributed, it is necessary that the data for each feature be normalized. This ensures that each feature has the same weight in the decision process. Assuming that the given data is Gaussian, this normalization is performed using the mean and standard deviation of the training data. In order to normalize the training data, it is necessary first to calculate the sample mean
µ
, and the standard deviationσ
of each feature in this dataset, and then normalize the data using the Eq. (1).
σ
µ
− = i i x x (1)This ensures that each feature of the training dataset has a normal distribution with a mean of zero and a standard deviation of unity. In addition, the kNN method requires normalization of all features into the same range.
Combination of Multiple Classifiers. In combining multiple classifiers we improve classifier performance. There are different ways one can think of combining classifiers:
• The simplest way is to find the overall error rate of the classifiers and choose the one which has the least error rate on the given dataset. This is called an offline classification fusion. This may appear to be a classification fusion; however, in general, it has a better performance than individual classifiers.
• The second method, which is called online classification fusion, uses all the classifiers followed by a vote. The class getting the maximum votes from the individual classifiers will be assigned to the test sample.
Using the second method we show that classification fusion can achieve a significant accuracy improvement in all given data sets. A GA is employed to determine whether classification fusion performance can be maximized.
5. OPTIMIZING CLASSIFICATION
FUSION WITH GENTIC ALGORITHMS
Our goal is to find a population of best weights for every feature vector, which minimize the classification error rate. The feature vector for our predictors are the set of nine variables for every student: Number of attempts before correct answer is derived, Success rate, Success at the first try, Success at the second try, Success with number of tries between three and nine, Success with high number of tries, the time at which the student got the problem correct
relative to the due date, and total time spent on the problem. We randomly initialized a population of nine dimensional weight vectors with values between 0 and 1, corresponding to the feature vector and experimented with different number of population sizes. We found good results using a population with 200 individuals. Real-valued populations may be initialized using the GA MATLAB Toolbox function crtrp. For example, to create a random population of nine individuals with 200 variables each: we define boundaries on the variables in FieldD which is a matrix containing the boundaries of each variable of an individual.
FieldD = [ 0 0 0 0 0 0 0 0 0; % lower bound 1 1 1 1 1 1 1 1 1]; % upper bound
We create an initial population with Chrom = crtrp(200, FieldD), So we have for example:
Chrom = 0.23 0.17 0.95 0.38 0.06 0.26 0.31 0.52 0.65 0.35 0.09 0.43 0.64 0.20 0.54 0.43 0.90 0.32 0.50 0.10 0.09 0.65 0.68 0.46 0.29 0.67 0.13 0.21 0.29 0.89 0.48 0.63 0.81 0.05 0.12 0.71
………
We used the simple genetic algorithm (SGA), which is described by Goldberg in [14]. The SGA uses common GA operators to find a population of solutions which optimize the fitness values. We used Stochastic Universal Sampling [14] as our selection method. A form of stochastic universal sampling is implemented by obtaining a cumulative sum of the fitness vector, FitnV, and generating N equally spaced numbers between 0 and sum(FitnV). Thus, only one random number is generated, all the others used being equally spaced from that point. The index of the individuals selected is determined by comparing the generated numbers with the cumulative sum vector. The probability of an individual being selected is then given by
(2)
where f(xi) is the fitness of individual xi and F(xi) is the
probability of that individual being selected.
The operation of crossover is not necessarily performed on all strings in the population. Instead, it is applied with a probability Px when the pairs are chosen for breeding. We selected Px = 0.7. Intermediate recombination combines parent values using the following formula [15]:
Offspring = parent1 + Alpha
×
(parent2 – parent1) (3)where Alpha is a Scaling factor chosen uniformly in the interval [-0.25, 1.25]
A further genetic operator, mutation is applied to the new chromosomes, with a set probability Pm. Mutation causes the individual genetic representation to be changed according to some probabilistic rule. Mutation is generally considered to be a background operator that ensures that the probability of searching a particular subspace of the
problem space is never zero. This has the effect of tending to inhibit the possibility of converging to a local optimum, rather than the global optimum. We considered 1/800 as our mutation rate. The mutation of each variable is calculated as follows:
Mutated Var = Var + MutMx
×
range×
MutOpt(2)×
delta (4)where delta is an internal matrix which specifies the normalized mutation step size; MutMx is an internal mask table; and MutOpt specifies the mutation rate and its shrinkage during the run.
During the reproduction phase, each individual is assigned a fitness value derived from its raw performance measure given by the objective function. This value is used in the selection to bias towards more fit individuals. Highly fit individuals, relative to the whole population, have a high probability of being selected for mating whereas less fit individuals have a correspondingly low probability of being selected. The error rate is measured in each round of cross validation by dividing “the total number of misclassified examples” into “total number of test examples”. Therefore, our fitness function measures the accuracy rate achieved by classification fusion and our objective would be to maximize this performance (minimize the error rate).
6. EXPERIMENTS
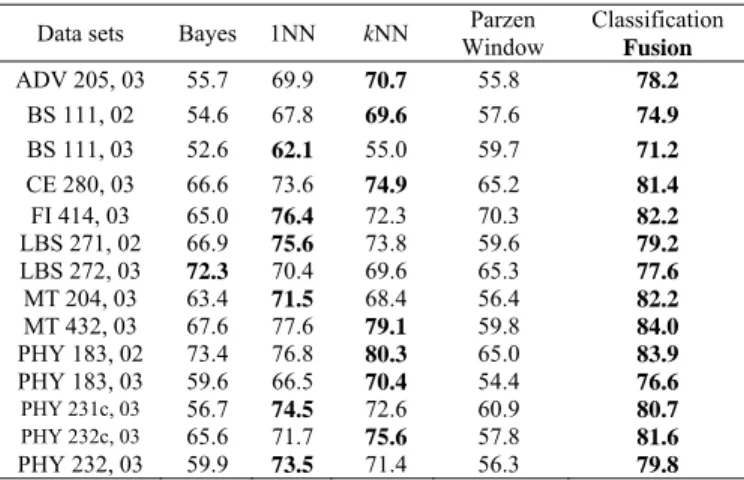
Without using GA, the overall results of classification performance on our datasets for four classifiers and classification fusion are shown in the Table 3. Regarding individual classifiers, mostly, 1NN and kNN have the best performance. However, the
classification fusion improved the classification accuracy significantly in all data sets. That is, it achieved in average 79% accuracy over the given data sets.
Table 3. Comparing the average performance% of ten runs of classifiers
on the given datasets using 10-fold cross validation, without GA
Data sets Bayes 1NN kNN Window Parzen Classification
Fusion ADV 205, 03 55.7 69.9 70.7 55.8 78.2 BS 111, 02 54.6 67.8 69.6 57.6 74.9 BS 111, 03 52.6 62.1 55.0 59.7 71.2 CE 280, 03 66.6 73.6 74.9 65.2 81.4 FI 414, 03 65.0 76.4 72.3 70.3 82.2 LBS 271, 02 66.9 75.6 73.8 59.6 79.2 LBS 272, 03 72.3 70.4 69.6 65.3 77.6 MT 204, 03 63.4 71.5 68.4 56.4 82.2 MT 432, 03 67.6 77.6 79.1 59.8 84.0 PHY 183, 02 73.4 76.8 80.3 65.0 83.9 PHY 183, 03 59.6 66.5 70.4 54.4 76.6 PHY 231c, 03 56.7 74.5 72.6 60.9 80.7 PHY 232c, 03 65.6 71.7 75.6 57.8 81.6 PHY 232, 03 59.9 73.5 71.4 56.3 79.8
For GA optimization, we used 200 individuals (weight vectors) in our population, running the GA over 500
∑
= = ind N i i i i x f x f x F 1 ) ( ) ( ) (generations. We ran the program 10 times and got the averages, which are shown, in Table 4.
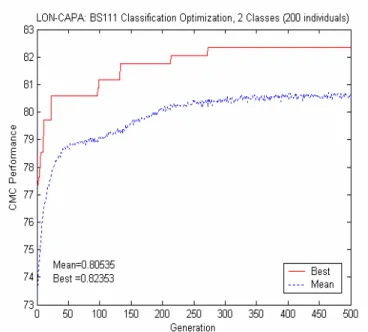
The results in Table 3 represent the mean performance with a two-tailed t-test with a 95% confidence interval for every data set. For the improvement of GA over non-GA result, a P-value indicating the probability of the Null-Hypothesis (There is no improvement) is also given, showing the significance of the GA optimization. All have p<0.001, indicating significant improvement. Therefore, using GA, in all the cases, we got approximately more than a 10% mean individual performance improvement and about 10 to 17% best individual performance improvement. Fig. 1 shows the results of one of the ten runs in the case of 2-Classes (passed and failed). The dotted line represents the population mean, and the solid line shows the best individual at each generation and the best value yielded by the run (Due to the space limitation, only a graph for BS 111 2003 GA-optimization is shown).
Table 4. Comparing the classification fusion performance on given datasets, without-GA, using-GA (Mean individual) and improvement, 95% confidence interval
Data sets Without GA GA ptimized Improvement
ADV 205, 03 78.19
±
1.34 89.11±
1.23 10.92±
0.94 BS 111, 02 74.93±
2.12 87.25±
0.93 12.21±
1.65 BS 111, 03 71.19±
1.34 81.09±
2.42 9.82±
1.33 CE 280, 03 81.43±
2.13 92.61±
2.07 11.36±
1.41 FI 414, 03 82.24±
1.54 91.73±
1.21 9.50±
1.76 LBS 271, 02 79.23±
1.92 90.02±
1.65 10.88±
0.64 LBS 272, 03 77.56±
0.87 87.61±
1.03 10.11±
0.62 MT 204, 03 82.24±
1.65 91.93±
2.23 9.96±
1.32 MT 432, 03 84.03±
2.13 95.21±
1.22 11.16±
1.28 PHY 183, 02 83.87±
1.73 94.09±
2.84 10.22±
1.92 PHY 183, 03 76.56±
1.37 87.14±
1.69 9.36±
1.14 PHY 231c, 03 80.67±
1.32 91.41±
2.27 10.74±
1.34 PHY 232c, 03 81.55±
0.13 92.39±
1.58 10.78±
1.53 PHY 232, 03 79.77±
1.64 88.61±
2.45 9.13±
2.23 Total Average 78.98±
12 90.03±
1.30 10.53±
56 Finally, we can examine the individuals (weights) for features by which we obtained the improved results. This feature weighting indicates the importance of each feature for making the required classification. In most cases the results are similar to Multiple Linear Regressions or some tree-based software (like CART) that use statistical methods to measure feature importance. The GA feature weighting results, as shown in Table 4, state that the “Success with high number of tries” is the most importantfeature. The “Total number of correct answers” feature is also the most important in some cases.
Fig. 1. GA-Optimized Combination of Multiple Classifiers’ (CMC)
performance in the case of 2-Class labels (Passed and Failed) for BS111 2003, 200 weight vectors individuals, 500 Generations
Table 5. Relative Feature Importance%, Using GA weighting for BS111 2003 course
Feature Importance %
Aerage Number of Tries 18.9 Total number of Correct Answers 84.7 # of Success at the First Try 24.4 # of Success at the Second Try 26.5 Got Correct with 3-9 Tries 21.2 Got Correct with # of Tries ≥ 10 91.7 Time Spent to Solve the Problems 32.1 Total Time Spent on the Problems 36.5 # of communication 3.6
Table 5 shows the importance of the nine features in the BS 111 SS03 course, applying the Gini splitting criterion. Based on Gini, a statistical property called information gain measures how well a given feature separates the training examples in relation to their target classes. Gini characterizes impurity of an arbitrary collection of examples S at a specific node N. In [16] the impurity of a node N is denoted by i(N) such that:
)
(
1
)
(
)
(
)
(
Gini(S)
2 j j i i j jP
P
P
N
i
=
∑
ω
ω
=
−
∑
ω
=
≠ (5)where
P
(
ω
j)
is the fraction of examples at node N that go to categoryω
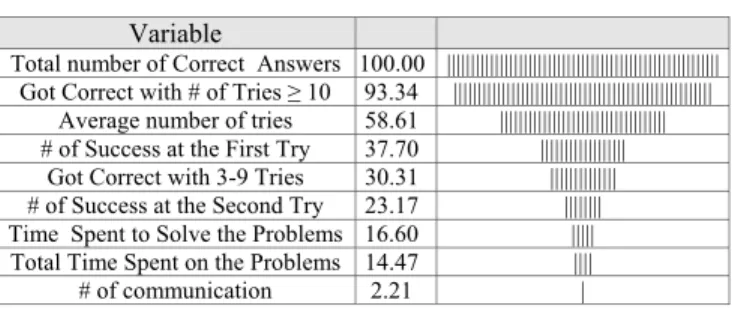
j. Gini attempts to separate classes by focusing on one class at a time. It will always favor working on the largest or, if you use costs or weights, the most important class in a node.Table 5. Feature Importance for BS111 2003, using decision-tree software CART, applying Gini Criterion
Variable
Total number of Correct Answers 100.00 ||||||||||||||||||||||||||||||||||||||||||||||||||||||||| Got Correct with # of Tries ≥ 10 93.34 ||||||||||||||||||||||||||||||||||||||||||||||||||||||
Average number of tries 58.61 ||||||||||||||||||||||||||||||||||| # of Success at the First Try 37.70 ||||||||||||||||||
Got Correct with 3-9 Tries 30.31 |||||||||||||| # of Success at the Second Try 23.17 |||||||| Time Spent to Solve the Problems 16.60 ||||| Total Time Spent on the Problems 14.47 |||| # of communication 2.21 |
Comparing results in Table 4 (GA-weighting) and Table 5 (Gini index criterion) shows the very similar output, which demonstrates merits of the proposed method for detecting the feature importance.
7. CONCLUSIONS
We proposed a new approach to classifying student usage of web-based instruction. Four classifiers are used in grouping the students. A combination of multiple classifiers leads to a significant accuracy improvement in the given data sets. Weighing the features and using a genetic algorithm to minimize the error rate improves the prediction accuracy by at least 10% in the all three test cases. In cases where the number of features is low, feature weighting worked much better than feature selection. The successful optimization of student classification in all three cases demonstrates the merits of using the LON-CAPA data to predict the students’ final grades based on their features, which are extracted from the homework data. This approach is easily adaptable to different types of courses, different population sizes, and allows for different features to be analyzed. This work represents a rigorous application of known classifiers as a means of analyzing and comparing use and performance of students who have taken a technical course that was partially/completely administered via the web. For future work, we plan to implement such an optimized assessment tool for every student on any particular problem. Therefore, we can track students’ behaviors on a particular problem over several semesters in order to achieve more reliable prediction.
8. ACKNOWLEDGMENT
This work was partially supported by the National Science Foundation under ITR 0085921.
9. REFERENCES
1. M.L. Raymer, W.F. Punch, E.D. Goodman, L.A. Kuhn, and A.K. Jain, “Dimensionality Reduction Using Genetic
Algorithms”. IEEE Transactions on Evolutionary Computation, Vol. 4, (2000) 164-171
2. A. K. Jain, D. Zongker, “Feature Selection: Evaluation, Application, and Small Sample Performance”, IEEE Transaction on Pattern Analysis and Machine Intelligence, Vol. 19, No. 2, February (1997).
3. K.A. De Jong, W.M. Spears and D.F. Gordon, “Using genetic algorithms for concept learning”. Machine Learning 13, (1993) 161-188.
4. S.Bandyopadhyay, and C.A. Muthy, “Pattern Classification Using Genetic Algorithms”, Pattern Recognition Letters, Vol. 16, (1995) 801-808
5. J. Bala, K. De Jong, J. Huang, H. Vafaie, and H. Wechsler, “Using learning to facilitate the evolution of features for recognizing visual concepts”. Evolutionary Computation 4(3) - Special Issue on Evolution, Learning, and Instinct: 100 years of the Baldwin Effect (1997)
6. C. Guerra-Salcedo, and D. Whitley, “Feature Selection mechanisms for ensemble creation: a genetic search perspective”. In: Freitas AA (Ed.) Data Mining with Evolutionary Algorithms: Research Directions – Papers from the AAAI Workshop, 13-17. Technical Report WS-99-06. AAAI Press (1999)
7. H. Vafaie, and K. De Jong, “Robust feature Selection algorithms”, Proceeding of IEEE International Conference on Tools with AI, Boston, Mass., USA. Nov. (1993) 356-363 8. M.J. Martin-Bautista, and M.A.Vila, “A survey of genetic
feature selection in mining issues”. Proceeding Congress on Evolutionary Computation (CEC-99), Washington D.C., July (1999) 1314-1321
9. M. Pei, E.D. Goodman, and W.F. Punch, “Pattern Discovery from Data Using Genetic Algorithms”. Proceeding of 1st Pacific-Asia Conference Knowledge Discovery & Data Mining (PAKDD-97) (1997)
10. W.F. Punch, M. Pei, L. Chia-Shun, E.D. Goodman, P. Hovland, and R. Enbody, “Further research on Feature Selection and Classification Using Genetic Algorithms”. In 5th International Conference on Genetic Algorithm, Champaign IL, (1993) 557-564
11. L.I. Kuncheva, and L.C. Jain, “Designing Classifier Fusion Systems by Genetic Algorithms”. IEEE Transaction on Evolutionary Computation, Vol. 33 (2000) 351-373
12. D. B. Skalak, “Using a Genetic Algorithm to Learn
Prototypes for Case Retrieval an Classification”, Proc. of the AAAI-93 Case-Based Reasoning Workshop, Washigton, D.C., American Association for Artificial Intelligence, Menlo Park, CA, (1994) 64-69
13. G.H. John, R. Kohavi, K. Pfleger, “Irrelevant Features and the Subset Selection Problem”, Proceedings of the Eleventh International Conference of Machine Learning, Morgan Kaufmann Publishers, San Francisco, CA (1994) 121-129 14. D.E. Goldberg, Genetic Algorithms in Search,
Optimization, and Machine Learning. MA, Addison-Wesley (1989)
15. Muhlenbein and D. Schlierkamp-Voosen, “Predictive Models for the Breeder Genetic Algorithm”, Continuous Parameter Optimization, Evolutionary Computation, Vol. 1, No. 1 (1993) 25-49
16. R.O. Duda, P.E. Hart, and D.G. Stork, Pattern
Classification. 2nd Edition, John Wiley & Sons, Inc., New York NY. 2001.