Andrew Benoy & Sandy Forbes
Nous Group
Benchmarking Best
Practice
Our presentation will cover four key areas
1. Evolution of our approach to benchmarking 2. Overview of process
3. Potential benefits
The cost and quality of back-of-house functions directly affects capacity to deliver services to clients
• Organisations that deliver their administrative and support functions
efficiently can spend more on front-of-house service delivery
• High quality administrative and support services free up staff to spend
more time helping their clients and less time dealing with cumbersome back-of-house functions Benchmark back-of-house functions Measure cost and quality, share good practice & identify improvement opportunities Better supported program staff Improved job-seeker outcomes Improve back-of-house service quality Reduce back-of-house cost & reinvest savings
Better program resourcing
We have worked with NFPs since 2008 to conduct
back-of-house benchmarking
• Community sector has historically lacked comparative data on
the cost and quality levels across NFP sector
• In 2008, twelve Victorian NFPs engaged Nous Group to
investigate the feasibility and potential benefits of benchmarking back-of house functions.
• Feasibility study identified potential performance
improvement dividends of 2% through reduced costs or increased quality from benchmarking
These 12 NFPs commissioned Nous to conduct the three year NFP Benchmarking project
Final year report (10/14) Project website
We have refined our approach nationally
•Currently working with one of WA's largest NFP aged care and retirement village providers
Victoria
•Three year NFP Benchmarking Project
•Individual project with large disability
CSO
ACT
•Current discussions with ACT Government and local CSOs
New South Wales •Online benchmarking
project with 100+ small to large disability NGOs
Queensland
•Individual project with a large disability provider
To date we have benchmarked 7 back-of-house functions
Function In-scope service areas
HR
•Recruitment and selection •Performance management •Training •OH&S •Workplace relations •Management services ICT •Management services •Communications services •Helpdesk services •Base IT environment
•Applications support, operations & maintenance •Public internet site
•Building new or enhancing existing ICT capability •Back up
•Disaster Recovery
To date we have benchmarked 7 back-of-house functions
Function In-scope service areas
Finance
•Financial accounting
•General ledger and asset financial management •Tax activity
•Grant and donation management •Management accounting
•External reporting and financial governance •Investment management
Payroll •Payroll services •Salary packaging
Fleet •Fleet provision and management
General admin •Office reception, coordination and support Facilities ••Property managementRepairs, maintenance and utilities
We have also looked at the costs of funding compliance • The NFP Benchmarking Project benchmarked activities related
to compliance for DHS (Vic) and DSS funding agreements
• Benchmarking compliance had several challenges:
– Reaching consensus on the motivation for measuring compliance (e.g.
is it to improve performance or support advocacy to government)
– Agreeing the scope of the compliance activities
– Measuring staff effort that is dispersed across back- and
front-of-house staff (e.g. reporting)
– Distinguishing between activities that constitute compliance versus
business as usual (BAU) quality improvement
– Differing views about whether compliance is the cost of being in
business versus an additional burden that could be reduced with improved monitoring. Agree scope Confirm KPIs and level of context ual detail Collect data Validate and analyse data Produce reports Conduct good practice work-shops
The benchmarking process has several key stages
Debrief results and findings
Benchmarking has enabled organisations to identify and implement improvements in service delivery practices
Function Change in practice
Overall • Introduced performance pay tied to key performance indicators (KPIs)for function managers
HR
• Restructure of HR function to report directly to CEO
• Centralised recruitment policy while decentralising recruitment • Renewed focus on formal performance management
• Centralised coordination and procurement of training delivery • Introduced self-directed online learning for non-technical learning
Payroll
• In-housed overall payroll function
• Out-sourced salary packaging management • Automated payroll systems
• Increased electronic and mobile timesheets and rostering
Improvements in service delivery practices [Continued]
Function Change in practice
Fleet
• Transitioned to different fleet management model • Decreased overall fleet size
• Downsized vehicle size
• Implemented strategies to increase utilisation such as sharing vehicles
between sites
• Transitioned Executive vehicles into pool during business hours
Finance •• Centralised Accounts Payable functionsInvested in additional capability in management accounting function
ICT
• Increased investment transition to Citrix and thin clients
• Shifted overall ICT spend from hardware to global applications and
mobile technology
The benefits of benchmarking increase over time
•Better understand drivers of cost and quality for their
back-of-house functions for the first time
•Increase transparency and visibility internally around how
back-of-house functions operate
•Shift attitudes away from viewing back-of-house functions as
‘administrative burdens’ to key enablers of efficient and effective client service delivery
Stage 1 - Understand drivers and change internal attitudes
•Broaden and deepen understanding of back-of-house
functions
•Make more informed decisions about significant changes to
back back-of-house service delivery
•Proactively manage fixed costs for back-of-house services in
the context of highly variable revenues
•Increase quality of back-of-service delivery
Stage 2 – Improve data quality and increase efficiencies
•Develop internal partnerships with service delivery functions
that align directly with needs of the organisation
•Establish clear expectations about back-of-house service
delivery levels
•Embed benchmarking KPIs into regular management and
board reporting
•Set differentiated and evidence-based targets for
back-of-house services
Stage 3 - Develop internal strategic partnerships
The benefits of benchmarking increase over time
Working with other organisations to benchmark can also foster much greater communication and collaboration • Some of the key benefits from the collaboration between the
12 organisations in the NFP Benchmarking project include:
– Increased trust to work collaboratively on those areas where collective
power increases the return for all (e.g. using group purchasing power)
– Joint advocacy activities regarding cost of compliance
– Active communities of practice across each function to identify good
practice and where the best return on investment is likely to be found
– Exploration of co-operative projects (developing better IT systems,
Quality benchmarking outcomes require direct and indirect investments by each organisation
• The time required can range anywhere from one to several
days for each back-of-house function – depending on the:
– Size and complexity of the function – Extent to which costs are stable over time
– Type of systems and processes already in place to track costs, outputs
and outcomes.
Organisational data is protected by strict privacy protocols • De-identification
• Restricted data storage • ‘Chatham’ house rules
The proposed project will likely begin next year
Month Milestone
October 2014 • Confirm benchmarking consortium members • Conduct initial briefing meeting
• Scope benchmarking of compliance
February 2015 • Meet with CEOs and senior teams to confirm objectives • Brief data collectors
• Data collection commences
March 2015 • Cleanse and analyse data
April 2015 • Meet with organisations to debrief findings identify existing
strengths and opportunities
May 2015 • Conduct best practice workshops for each function
Benchmarking investment
• The cost per organisation to benchmark 5-6 back-of-house
functions will range from $15,000-$20,000 p/a – depending on the number of partner organisations that participate each year.
NFP Benchmarking Project organisations spent on average $12,287 per FTE on back-of-house services in FY 2011/12
Figure 1: NFP investment in back-of-house functions per FTE
$373 $1,393 $2,249 $3,577 $4,011 $0 $1,000 $2,000 $3,000 $4,000 $5,000
Payroll Finance HR Fleet ICT
In ve st m en t i n bac k-of -h ou se fu nc tio ns p er F TE p er an nu m
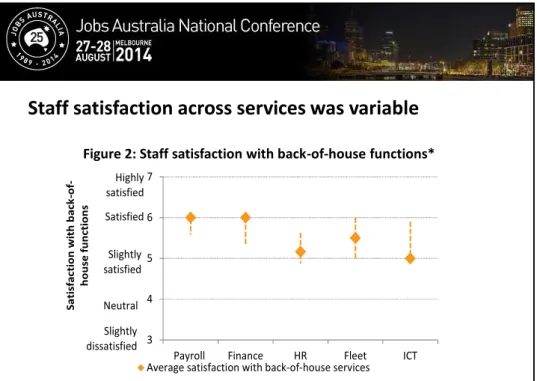
Staff satisfaction across services was variable
3 4 5 6 7Payroll Finance HR Fleet ICT
Sat is fac tio n w ith b ac k-of -ho us e fu nc tio ns
Average satisfaction with back-of-house services Highly satisfied Satisfied Slightly satisfied Neutral Slightly dissatisfied
Figure 2: Staff satisfaction with back-of-house functions*