The Composition Approach
for Large-Scale SOA
Frank Cohen
Email: [email protected] Brian Bartel
Email: [email protected] February 13, 2008
This paper introduces a new composition approach to building SOA services, explains
composition, and provides a methodology to evaluate today’s tools for developer productivity and ease of deployment/management.
Table of Contents
1 EXECUTIVE SUMMARY 1
2 MODEL DRIVEN SOA WITH COMPOSITION AND SERVICE VIRTUALIZATION 7
2.1 SERVICE VIRTUALIZATION 9
2.2 SERVICE COMPOSITION 10
2.3 SOA PROMISES AND THE TOOLS REALITY 12
3 USE CASE AND OPERATIONAL GOVERNANCE 14
3.1 USE CASE FOR SOA APPLICATION CONSTRUCTION AND DEPLOYMENT 15
3.2 HANDLING CHANGE 16
4 PROBLEMS WITH EXISTING TOOLS/PLATFORMS 18
4.1 TOP-LINE OBSERVATIONS 18
4.2 DEVELOPMENT SKILLS AND DOMAIN EXPERTISE TO BE SUCCESSFUL 19
4.3 DEVELOPMENT REUSE SKILLS REQUIRED TO BE SUCCESSFUL 19
4.4 DEPLOYMENT SKILLS REQUIRED TO BE SUCCESSFUL 20
4.5 CONCLUSIONS 21
4.6 BEA COMPARED TO TIBCO 22
4.7 IBM COMPARED TO TIBCO 24
4.8 ORACLE COMPARED TO TIBCO 26
5 SOA KNOWLEDGE AND PERFORMANCE TEST KITS 28
6 REFERENCES & GLOSSARY 29
6.1 GLOSSARY 29
7 COST OF OWNERSHIP DETAILED ANALYSIS 30
QUANTITATIVE STUDY RESULTS 32
PushToTest acknowledges this study was commissioned by TIBCO and that the study is genuinely independent because:
Scope and measurements were defined by PushToTest •
Its terms of reference are independent and not controlled by TIBCO •
PushToTest is an independent software and services supplier who relies on their market •
position being independent
The report is balanced because it does call out limitations of all products evaluated •
including those from TIBCO
PushToTest publishes all of the code, methodology, test suites, and deployment scripts •
under a free open-source SOA Knowledge Kit found at: http://soakit.pushtotest.com and encourages readers to “check for themselves” using their tools.”
1 Executive Summary
This section provides a summary detailing the key findings, including the high-level TCO results.
PushToTest, the open-source test automation company, provides test automation tools, platforms, and methodology to medium and large enterprises needing to surface functional, load and performance, and business performance issues in Service Oriented Architecture (SOA), Web service, Ajax, and Web application environments. In 2007 we observed a trend among the 160,000 people in our open-source community that software developers, QA testers, and IT managers are looking for a better way to develop, orchestrate, deploy, and manage services. This paper introduces a new composition approach to building SOA services, explains composition, and provides a methodology to evaluate today’s tools for developer productivity and ease of deployment/management.
In an effort to quantify the benefits of this composition approach, as well as understand the impact of platform heterogeneity on SOA initiatives, PushToTest conducted an independent evaluation of SOA-related products from several leading vendors. This evaluation consists of a time/motion analysis of each step of the services lifecycle to reveal the amount of time and effort required to build, integrate, deploy and manage a range of services needed to assemble a composite application. The goal of the study is to compare the cost savings that can be achieved through greater productivity resulting in significantly reduced TCO. The data presented in this report is the result of a seven-month long project that required nearly four man-years worth of effort.
PushToTest evaluated SOA development and deployment tools and platforms from Oracle, IBM, BEA, and TIBCO to look below the surface-level marketing claims and understand the skill sets, domain expertise, and specialization that it takes to be successful in each platform. We discovered a wide variety of experiences: some highly successful and others rife with challenges. We measured the amount of developer effort to implement an SOA use case and summarize the findings in the following total cost of ownership (TCO) comparison chart.
As illustrated in the figure below, the TIBCO platform and tools provide the lowest overall labor cost based on the integration activities performed across all of the four vendor platforms and toolsets included in the study. One of the study’s greatest surprises was the cost related to BEA. IBM provided the best overall support experience.
While all of the platforms offer basic competency to build SOA services, PushToTest observed the areas of greatest productivity gains in service construction, orchestration, policy management, security configuration, and change management. We found that TIBCO ActiveMatrix took 49% less time/costs against BEA, 35% less than Oracle, and 22% less than IBM. We list the products used and version numbers in the Resource section in Section 6 of this paper.
The differences observed in the effort and time by vendor are significant based on the well defined use case examined in the detailed study. Scaling, or extrapolating, these study results over a longer time horizon can yield insight into the tangible differences from a cost of ownership standpoint revealing that BEA substantially increases cost of ownership by as much as 83%, Oracle 59% and IBM 43% when compared to TIBCO. The figure below shows the study results annualized based on a representative set of integration projects.
$10,741 $13,720 $16,596 $21,088 $0 $5,000 $10,000 $15,000 $20,000 $25,000
Labor Cost to Deploy
TIBCO
IBM
Oracle
BEA
Integration Activities Measured • System Setup • Adapter Setup • Design/Review • Project Management • Configuration • Service Construction • Service Orchestration • Deployment • Policy Management
• Security Configuration
• Monito ring and Management (SLAs)
• Change Management
• QA
Summary Study Results for Side-by-Side Product Implementation
SOA Cost of Ownership: Study Results Annualized
Potential Annual Cost of Ownership Impact Based on Study Results
¹ Note: Labor costs are based on assumptions that can be found in Section 7.2.PushToTest made the following conclusions based upon the experience of implementing a use case across all of the tools:
Success requires a composition approach to service development, and an architecture •
that separates governance from service development. Large-scale SOA initiatives with dozens to hundreds of services require us to address a complex network of services, written in a variety of languages, tools, and patterns, and residing in multiple hosted environments. The old techniques have a glass ceiling that limits large-scale SOA success and the composition approach, with its easier way to model and assemble services into composite applications, is promising.
Service Virtualization is an emerging architecture intended to host heterogeneous •
services, including Java and .NET. Service virtualization separates application business logic from the underlying technical implementation, including transports, governance and deployment details.
Oracle, IBM, BEA, TIBCO tools have major differences in developer productivity and •
deployment. A fundamental difference in the architecture of these products can best be described as platform or application server-centric, versus platform independence. TIBCO’s platform independent architecture is better suited for large-scale SOA
initiatives that must deal with the complexity of deploying and managing services across heterogeneous platforms, whereas the others are best suited for services that reside in the confines of their own domains.
Based on the implemented use cases, TIBCO’s service composition and service •
virtualization approach demonstrated greater productivity and lower overall TCO in our efforts. We also believe TIBCO’s approach accelerates time-to-market, and more easily manages the services lifecycle.
In the study, we found three areas that dramatically influence the cost of any SOA related effort. Service Construction, Service Orchestration, and Change Management all played important factors in the study. These activities contributed the most in terms of project cost. The following explains our definition of these terms:
Service Construction – All the steps needed to build components of the application •
as reusable services. During this stage we built the services and wrote our own service consumers (client) code to test.
Service Orchestration – We deploy and wire together the services into a process flow. •
Change Management – We changed the services built in the Service Construction phase, •
It is interesting to analyze how the vendor results fared across these particular activities. The tables below demonstrate the cost associated with each vendor for these four selected activities, in order of their place in the lifecycle of the integration project (note that you can also find detailed vendor by vendor TCO comparisons provided in section 7 of this report).
Service Construction
Service Orchestration
Category TIBCO IBM Oracle BEA
Labor Cost ¹ $1,572 $1,816 $2,441 $2,593
Cost Difference (% as compared to
lowest labor cost) Low Cost Vendor + 16% + 55% + 65%
Cost Basis 33.2 Total Hours • 30.7 Developer Hours • 2.5 Architect Hours 38.2 Total Hours • 34.2 Developer Hours • 4 Architect Hours 52 Total Hours • 51.5 Developer Hours • 0.5 Architect Hours 53.8 Total Hours • 42.5 Developer Hours • 11.3 Architect Hours
Change Management
Category TIBCO IBM Oracle BEA
Labor Cost $984 $1,691 $1,603 $1,570
Category TIBCO IBM Oracle BEA
Labor Cost ¹ $2,569 $3,580 $3,943 $4,706
Cost Difference (% as compared to
lowest labor cost) Low Cost Vendor + 39% + 53% + 83%
Cost Basis 54.3 Total Hours • 50.5 Developer Hours • 3.8 Architect Hours 75.5 Total Hours • 69 Developer Hours • 6.5 Architect Hours 82.8 Total Hours • 73 Developer Hours • 9.8 Architect Hours 99.7 Total Hours • 94.5 Developer Hours • 5.2 Architect Hours
The above statistics come from a time-and-motion analysis of each tool. To calculate these statistics for your own environment, PushToTest makes the financial model spreadsheet available for free download at http://soakit.pushtotest.com.
In general terms, we found the following top-line strengths and weaknesses:
BEA, IBM, and Oracle retrofit SOA into their older/established platforms. The core to •
these platforms is application server technology for building Web applications. For instance, many tools treat service interfaces as something added-on to existing Java objects and not integral to service development. Consequently, these tools require a lot of SOA skills from the developer, tester, IT manager to be successful.
SOA requires interoperability and integration with services. We found that BEA, IBM, •
and Oracle struggle with services and business flows built outside of their own tools. For instance, in Oracle’s case we found automatically generated deployment descriptors pointing one tool’s consumer to the wrong network port for a service.
BEA, IBM, and Oracle require multiple tools to get from ‘here’ to ‘there’. PushToTest •
needed to download and use 3 or more tools from the same vendor to accomplish the SOA use case. Each tool offered its own graphic interface conventions and sometimes required proprietary extensions and manual techniques to get the implementation to deploy. For example, IBM requires 4 products to build your first service.
We found serious bugs in BEA, IBM and Oracle shipping products. For instance, BEA •
displayed broken dialog boxes when we tried to identify a database interface. While some bugs we encountered were solved with patches, the overall number of bugs is significant enough to impact TCO.
We expected to find EJB and Spring support in TIBCO ActiveMatrix, but found that •
ActiveMatrix 2 supports only Plain Old Java Object (POJO) class development. We had to get past some of our preconceived notions for service virtualization. We •
expected service virtualization would create orchestrations of externally running services. That is different from TIBCO’s actual architecture where Java and .NET classes run within the ActiveMatrix containers.
In terms of a large-scale SOA tool for moving services onto a heterogeneous grid for •
operational governance and orchestration, virtualization, and composition, TIBCO ActiveMatrix is on the right track.
Finally, PushToTest expects that your experience may be different from ours. That is why PushToTest publishes all of the code, methodology, test suites, and deployment scripts we created during this project so you may build and operate the use case implementations in your own enterprise environment. All of these are packaged by PushToTest and published under a free open-source SOA Knowledge Kit found at: http://soakit.pushtotest.com
We welcome you to complete the analysis on your own and share the results with our community of architects, developers, testers, and IT executives.
2 Model Driven SOA with Composition and
Service Virtualization
This section introduces software architects and developers to the core concepts of SOA
composition and service virtualization. This section includes the methodology of the project and key reasons for completing this project.
There is a list of reasons that explains the differences in the time/effort required to complete each step of the services lifecycle defined in our use case, and these reasons can be found in Section 4. Beyond the bugs we had to resolve, and number of tools we had to use to complete these tasks, there were architectural advantages that became evident with TIBCO’s unique approach to SOA.
The composition approach to building SOA services looks at the pitfalls of today’s software development and provides a common way for software architects to describe a design, for a software developer to define and create software classes, for QA testers to understand what they are testing, and for IT managers to describe the interactions a service has when it is orchestrated to a grid of other services.
We see this as a natural course for the improvement of the software construction process. It is analogous to Java developers moving away from EJB to the annotation framework of something like Spring. Java developers wire plain old Java objects (POJOs) using Spring. In the SOA space developers and architects compose strings of services into composite applications. Service composition is the method, notation, patterns, and APIs to string together services.
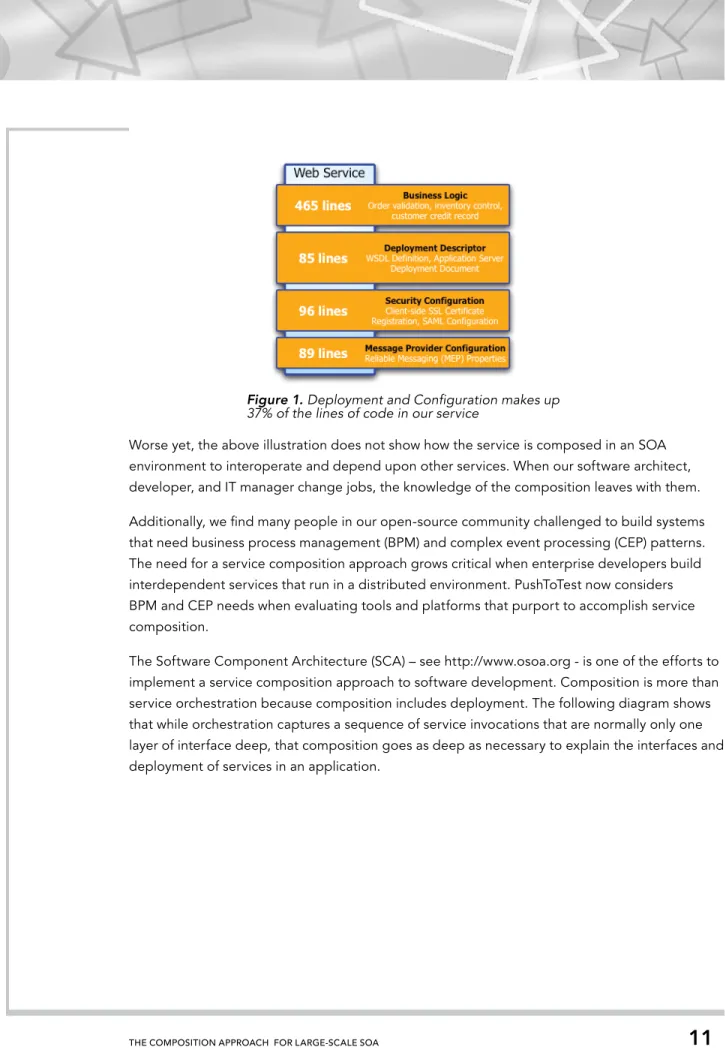
The composition approach emerged as a solution to the overhead that is required to achieve operational governance in today’s modern datacenter. Consider what it takes to develop and deploy a standard Enterprise Java Bean (EJB) based application using today’s tools. As an example, PushToTest built an EJB-based service to sell licenses to our manuals. The business logic took 465 lines of Java code. However, we had to write another 270 lines of configuration, deployment, and property files to install the service in our application server, establish security for the service, and configure a reliable message provider for the service. Taken together, 37% of the code exists simply to deploy our service.
Worse yet, the above illustration does not show how the service is composed in an SOA environment to interoperate and depend upon other services. When our software architect, developer, and IT manager change jobs, the knowledge of the composition leaves with them. Additionally, we find many people in our open-source community challenged to build systems that need business process management (BPM) and complex event processing (CEP) patterns. The need for a service composition approach grows critical when enterprise developers build interdependent services that run in a distributed environment. PushToTest now considers BPM and CEP needs when evaluating tools and platforms that purport to accomplish service composition.
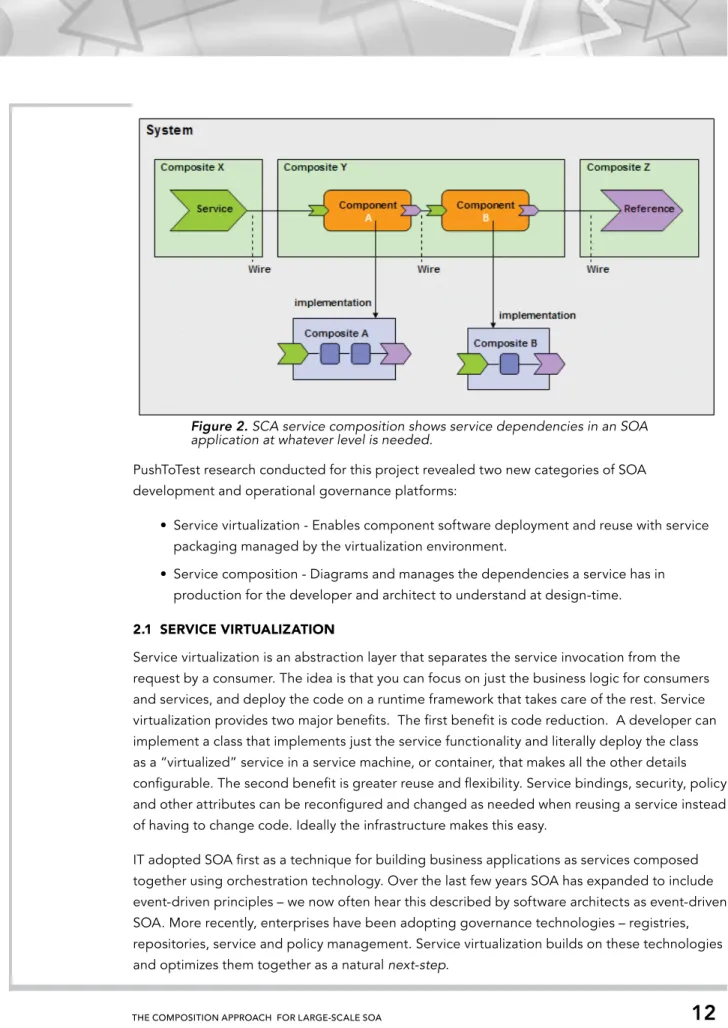
The Software Component Architecture (SCA) – see http://www.osoa.org - is one of the efforts to implement a service composition approach to software development. Composition is more than service orchestration because composition includes deployment. The following diagram shows that while orchestration captures a sequence of service invocations that are normally only one layer of interface deep, that composition goes as deep as necessary to explain the interfaces and deployment of services in an application.
Figure 1. Deployment and Configuration makes up 37% of the lines of code in our service
PushToTest research conducted for this project revealed two new categories of SOA development and operational governance platforms:
Service virtualization - Enables component software deployment and reuse with service •
packaging managed by the virtualization environment.
Service composition - Diagrams and manages the dependencies a service has in •
production for the developer and architect to understand at design-time. 2.1 SERVICE VIRTUALIZATION
Service virtualization is an abstraction layer that separates the service invocation from the request by a consumer. The idea is that you can focus on just the business logic for consumers and services, and deploy the code on a runtime framework that takes care of the rest. Service virtualization provides two major benefits. The first benefit is code reduction. A developer can implement a class that implements just the service functionality and literally deploy the class as a “virtualized” service in a service machine, or container, that makes all the other details configurable. The second benefit is greater reuse and flexibility. Service bindings, security, policy and other attributes can be reconfigured and changed as needed when reusing a service instead of having to change code. Ideally the infrastructure makes this easy.
IT adopted SOA first as a technique for building business applications as services composed together using orchestration technology. Over the last few years SOA has expanded to include
Figure 2. SCA service composition shows service dependencies in an SOA application at whatever level is needed.
Enterprises adopting service virtualization benefit in several ways:
Developers are more productive because they can focus on writing just the core business •
logic of the service and let the virtualization technology manage everything else. The best solution allows the developers to focus on their development environment of choice, and not have to use multiple environments and tools.
Services are more easily promoted, reused and changed across departments because •
security, policies and communication over Web services or messaging is now configured, not coded into the service.
Administrators are more productive because service and policy configuration, deployment •
and management are done centrally, not separately for each application server, ESB or orchestration engine.
For a more detailed explanation of Service Virtualization please see the PushToTest Service Virtualization white paper available at:
http://downloads.pushtotest.com/docs/ServiceVirtualization.pdf 2.2 SERVICE COMPOSITION
Service composition is a set of functions and a service orchestration model that identifies the interdependencies between a set of services operating in a grid environment. Enterprises need tools that support service composition to achieve the promises of SOA, including reduced development costs, increased stability, and faster time-to-market in their effort to assemble services into composite applications. The need comes from several efforts within the typical
Figure 3. Service virtualization enables developers to write just the core business logic as a service or consumer and wrap it in a service container for deployment and management.
A new platform is needed that provides a common view of the dependencies of the services in an application and the governance support to best manage applications within these dependencies. This is true for instances where we need to coordinate among a group of developers to change a service without impacting applications that reuse the service. Additionally the nature of this platform helps us find the root cause of an application failure by showing us the dependencies.
2.3 SOA PROMISES AND THE TOOLS REALITY
SOA requires a collection of tools, techniques, and protocols to deliver cost reductions and faster time-to-market. SOA promises a lot:
Reduced Costs from Component Reuse (Registries and Repositories) •
Better Able to Achieve SLAs (Governance) •
Architecture for Modern Application Development (Enterprise Web 2) •
PushToTest helps medium and large enterprises achieve these promises, but normally with much effort. For instance, PushToTest helped General Motors achieve its use of SOA as a corporate strategy. Enterprises like GM evaluating individual tools and platforms for SOA development find that they need to leverage a huge array of SOA tools, including Business Intelligence, BI, Enterprise Service Bus (ESB), Master Data Management (MDM), Registry/Repository
Governance, Customer Data Integration (CDI), and BPM/Workflow tools. With all of these tools in a datacenter, service composition and service virtualization play an important role to successful SOA implementations.
PushToTest looked at SOA development tools and platforms from Oracle, IBM, BEA, and TIBCO to determine which would get an enterprise closest to service composition and service virtualization. PushToTest found today’s tools lacking in several areas:
Today’s tools offer a confusing mix of features, functions, and bugs. To make this worse, •
the tools vendors offer very little guidance on the best practices to use their tools in SOA environments.
The tools demand a mix of backgrounds, skills, and architectural experiences. We found •
the tools required skills in Java, .NET, XML, SQL, XQuery, XSLT, EJB, BPEL, WSDL, SDO, and their proprietary extensions to the above.
The tools support Java or .NET deployments but not both. TIBCO ActiveMatrix was the •
only heterogeneous platform where we could deploy both Java and .NET in the same runtime environment.
to their WSDL to support JMS transports and deployment options that are not portable to competing tools.
The platforms offer huge variations in performance based on developer decisions. •
For instance, BEA provides a choice of XML parsers to work with SOAP message contents - Document Object Model (DOM), Streaming XML Parser (StAX), and XML Binding Compiler (JAXB) - and lets the developer choose which is best suited for the application. In past studies a developer’s poor choice of XML parser slowed Web service message throughput by 618%. For details see: http://dev2dev.bea.com/pub/a/2004/05/ SOAPScalability.html
The platforms lock software developers into a limited number of development patterns. •
None of the platforms supported development with EJB, Spring, POJO, Annotations, and third-party add-on frameworks. For example, we found Oracle offering EJB and Spring but not custom annotations and TIBCO offering POJO but not EJB or Spring development.
From our research, PushToTest found that TIBCO is the leader in understanding service composition and service virtualization and is building products to meet our needs. We are looking for a platform with consistent tools across the development and deployment
environment that support our SOA development needs. We need the platform to simplify service development, support multiple application servers, and support heterogeneous (Java and .NET) development. As you will learn in this paper, even TIBCO has areas for improvement; however, TIBCO appears to be on the right track.
3 Use Case and Operational Governance
This section introduces the use case and illustrates our early thoughts on what tools and patterns to use to accomplish the use case.
Evaluating the SOA development tools for service virtualization and composition requires a unique set of use cases, a proven test criteria, and an expert methodology to determine which tools best fit an enterprise’s requirements. The problem most enterprises encounter when evaluating SOA tools and platforms is that they misread the use cases and underestimate the impact these tools have on developer productivity. PushToTest witnessed several large enterprises fail to achieve actionable knowledge from a tools evaluation from use cases that seemed reasonable but are unable to determine a winner in a tools evaluation.
PushToTest knows the biggest challenge enterprises and institutions have in evaluating Service Oriented Architect (SOA), Business Process Management (BPM), Complex Event Processing (CEP), and Service Virtualization (SV) platforms is to understand SOA use cases, and apply an SOA evaluation methodology and criteria, to achieve actionable knowledge.
PushToTest’s methodology for an SOA, BPM, CEP, and SV evaluation defines a use case with the following mandatory criteria:
It is an orchestration of services. •
It is a long running process. •
The use case requires connectivity to SAP, JMS, and SOAP services. •
It uses medium to large payload sizes defined by complex schemata. •
It must be able to be instrumented as a scalability test. •
It requires reliable messaging (RAMP). •
It uses document-oriented container architecture. •
Evaluating the competitive differences between tools according to the above criteria can be a complex effort and the accurate understanding of the results requires expert analysis.
The following is an illustration of a use case for which we believe SOA patterns are appropriate. The scenario is a manufacturing company that adopts a standard document schema to represent the purchase and shipment of products through a supply chain. The manufacturer chooses an SOA approach using composite applications and data services to interoperate with a set of existing services: financial services group purchase order tracking, warehouse just-in-time
3.1 USE CASE FOR SOA APPLICATION CONSTRUCTION AND DEPLOYMENT PushToTest illustrates the typical order using such a system in the following flow-chart:
The use case begins when a customer places an order for a product. This begins an SOA workflow that consumes three services:
Allocate Purchase Order – uses a service from the financial services group to issue and •
track purchase orders. The service features three methods: open new PO, close a PO, and remove a PO. This is a workflow process that provides a SOAP user interface accessed over an HTTPS protocols.
Reserve Parts – uses a service for warehouse just-in-time inventory control to reserve •
portions of the inventory to meet the delivery needs defined in the purchase order. This is a Java object (hosted in the provided container by each vendor tool) that receives a document-literal encoded SOAP request over a JMS service interface. The message conforms to the inventory control service’s XML message schema.
The system depends on a shipping clerk to authorize the inventory to meet the customer’s order. The clerk uses an Ajax-enabled browser interface to view a list of pending orders and quickly check-off multiple approvals.
The manufacturing purchasing system is described as follows:
The order system uses a different version of the PO schema at each service. That is, the 1.
SOA flow will use a standard XML schema (see below), but each service at each step may internally use a different schema. Thus, each step through the workflow requires a schema transformation. PushToTest defines this requirement to show developers how to work with multiple schemas and multiple XML document parsers, including the parser suggested/ provided by the particular vendor tool.
PushToTest built Mock Objects for SAP NetWeaver and Siebel services to isolate the 2.
impact of these systems’ own scalability and interoperability issues from the project. PushToTest used an ebXML-based Business Object Document (BOD) schema to represent 3.
the purchase order documents through the flow. 3.2 HANDLING CHANGE
PushToTest evaluated implementing the use case described above and then evaluated the developer effort to make changes from product and change management perspective. This effort includes documentation that shows the learning curve, effort to develop, effort to deploy, effort to maintain and support. For example, PushToTest incorporated the following issues into the project.
Ability to add transports to the deployed services 1.
a. An example would be the extension of a service such as the “reserve parts” service in your Use Case from SOAP over JMS to allow partners access to the service via SOAP over HTTPS.
Ability to add resources to services in production with zero downtime 2.
b. An example here might be a bandwidth limitation for a single instance of the “price purchase order” service. As a result customers are complaining of slow response times. The manufacturer decides to implement a policy that during peak loads as this service approaches predetermined thresholds an additional “price purchase order” service will be dynamically created on an under utilized server to handle the additional load. Ability to add/change/remove policies
3.
c. An example here might be the addition of the new policy above. Another possibility might be the dynamic policy enforcement of access to the “allocate PO” service.
4 Problems with Existing Tools/Platforms
PushToTest applied the vision of SOA development, composition, and operational governance to the manufacturing scenario use case. This section finds the architectural and implementation level problems we encountered when working with tools from Oracle, IBM, BEA and TIBCO.
When PushToTest implemented the use case using the chosen tools, we found many variations from the ideal experience. This section describes the architectural and implementation-level problems we encountered when working with tools from Oracle, IBM, BEA and TIBCO. 4.1 TOP-LINE OBSERVATIONS
Overall PushToTest was able to accomplish the use case on each of the tools. The experience gave us valuable knowledge we would not have had if we had relied on the surface-level marketing claims from the tools providers. The following summarizes our top-line observations.
BEA, IBM, and Oracle require multiple tools to get from ‘here’ to ‘there’. PushToTest •
needed to download and use 3 or more tools from the same vendor to accomplish the SOA use case. Each tool offered its own graphic interface conventions and sometimes required proprietary extensions and manual techniques to get the implementation to deploy. For example, IBM requires 4 products to build your first service.
We found “blocker” bugs in BEA, IBM and Oracle shipping products. In development •
of PushToTest test automation products, we consider a “blocker” to be something that prevents a function from working and has no workaround. For instance, BEA displayed broken dialog boxes when we tried to identify a database interface. While some bugs we encountered were solved with patches, the overall number of bugs are significant enough to impact TCO.
We expected to find EJB and Spring support in TIBCO ActiveMatrix, but found that •
ActiveMatrix 2 supports only Plain Old Java Object (POJO) class development. We had to get past some of our preconceived notions for service virtualization. We •
4.2 DEVELOPMENT SKILLS AND DOMAIN EXPERTISE TO BE SUCCESSFUL
PushToTest found that each tool vendor requires developer skills and specific domain expertise to be successful using their tool. The following is a summary:
BEA requires Java, XQuery, XSLT, EJB, BPEL, XML, WSDL and their proprietary graphical •
user interfaces to be successful.
Oracle requires Java, SQL, EJB, BPEL, SDO, XML, and proprietary deployment •
descriptors.
IBM requires Java, SQL, EJB, XML, WSDL and their proprietary graphical user interfaces to •
be successful.
TIBCO requires Java or .NET, or maybe neither. We say this in the light of SOA •
development being more about composition of services than the actual classes or integration code one writes in an SOA environment.
4.3 DEVELOPMENT REUSE SKILLS REqUIRED TO BE SUCCESSFUL
PushToTest found that each tool vendor also required specific developer skills to accomplish service reuse in an enterprise setting. When using composition to build, deploy, and govern services, the ability to track existing services to avoid reinventing an existing service falls on registry solutions. The following is a summary of our registry experiences on each of the tools:
BEA offers reuse strategies through two products: AquaLogic Enterprise Repository •
(Flashline) registry and Systinet. PushToTest found neither solution particularly integrated into BEA’s development and deployment tools.
Oracle partners with HP/Systinet as a strategic partner for Service Registry (SR) and •
bundles registry components with Fusion. PushToTest found no immediate integration from Oracle JDeveloper to its Enterprise Manager development and deployment tools. IBM offers several registry solutions. One solution requires WebSphere Repository that is •
a registry with no support for UDDI 3 and no support for services built with other tools. TIBCO ActiveMatrix provides good integration to the TIBCO Registry (an integration of •
Systinet Registry). The development tools featured graphical components to facilitate the interaction from composition designer tools to the Registry.
Additionally, we need to be able to capture the knowledge of one developer who is skilled at an area of development and record their expertise into a set of reusable policies to reduce development, configuration and change management costs. For instance, changing a service interface from SOAP over HTTP to XML over JMS by implementing a policy is a clear win. In our
4.4 DEPLOYMENT SKILLS REqUIRED TO BE SUCCESSFUL
SOA development is more about composition of services than the actual classes or integration code one writes in an SOA environment. It surprised us how little focus the tools had on deployment of the resulting services. The following is a summary of our experience deploying and governing services:
BEA provides a simple administrative console to deployment and management services. •
Many BEA customers in the PushToTest community build or buy specialized tools/ platforms - HP OpenView, Hyperic, CA Control Center - for deployment/management. These tools require coding to deploy services, are not configuration driven, require editing of properties files/pages versus EJB deployment descriptors and require deployment coding.
Oracle requires Enterprise Manager, which requires extensive skills to master its •
proprietary scripting language and APIs. PushToTest found very few resources through Google and other developer on-line resources to solve our deployment issues.
IBM requires Tivoli, a large-scale proprietary platform. Tivoli requires use of proprietary •
APIs and a proprietary scripting language to be successful.
TIBCO ActiveMatrix is the only platform we tested that provides a friendly Web GUI to •
deploy and manage services. 4.5 CONCLUSIONS
Our conclusion after building the use case on IBM, Oracle, BEA, and TIBCO tools is that TIBCO ActiveMatrix is on the right track. We found the following advantages to TIBCO:
Moves services onto the grid to benefit from operational governance •
Orchestration and repository for enhanced productivity in development and production •
Graphical integration development •
Strong interoperability: platform, message schema, service interface independence •
On-ramp for developers to understand and use BPM and CEP productively •
4.6 BEA COMPARED TO TIBCO
Overall: TIBCO ActiveMatrix provided a 49% total productivity savings over BEA.
BEA
(Hours) (Hours) TIBCO TIBCO Savings (% less time required to complete) 34 11 68% 20 10 53% 68 38 44% 39 18 55% 27 7 74% 100 54 46% 54 33 38% 2 1 42% 13 9 35%
Key Reasons for Time Difference
Multiple installers Manual adapter settings required
BEA documentation does not identify a starting point
So many bugs, so many meetings
Configuration through properties and ANT scripts, no Wizard/GUI
No way to create callback in ALSB
WLI for orchestration, ALSB for intermediation, ALBPM for process ANT tasks and EJB descriptors
Transformations require XQuery
System Setup Adapter Setup
Design & Review
Project Management Tools Configuration Service Construction & Integration Service Orchestration Service Deployment Policy Management
4.7 IBM COMPARED TO TIBCO
Overall: TIBCO ActiveMatrix provided a 22% total productivity savings over IBM.
IBM
(Hours) (Hours) TIBCO Savings TIBCO
(% less time required to complete) 18 11 39% 20 10 53% 48 38 21% 10 18 - 80% 2 7 - 367% 76 54 28% 38 33 13% System Setup Adapter Setup Design & Review
Project Management Tools Configuration Service Construction & Integration Service Orchestration
Key Reasons for Time Difference
Multiple installers and MySQL support manual steps
Multiple properties files Multiple tools with inconsistent integration SVN support built
Easy JMS set up wizard
Top-down, bottom- up choices
Assembly diagram GUI not easy to understand at
4.8 ORACLE COMPARED TO TIBCO
Overall: TIBCO ActiveMatrix provided a 35% total productivity savings over Oracle. Oracle (Hours) TIBCO (Hours) TIBCO Savings (% less time required to complete)
7 11 - 48% Universal installer, no post configuration needed
16 10 41% Ant scripts, separate download and install
67 38 43% Multiple acquired tools 14 18 - 27% SVN support and JMS Ant tasks
26 7 73% Proprietary WSDL extensions make JMS easier
83 54 34% Bottom up, manual Ant tasks for -JMS
52 33 36% Great visual editor for process design and transformations 2 1 18% JDeveloper one- click
deployment 16 9 46% JDeveloper XML schema support Services Lifecycle System Setup Adapter Setup
Design & Review Project Management Tools Configuration Service Construction & Integration Service Orchestration Service Deployment Policy Management
Key Reasons for Time Difference
5 SOA Knowledge and Performance Test Kits
PushToTest publishes the software code of the use case implemented on Oracle, IBM, BEA, and TIBCO tools. This section describes the contents of the kits and the benefits enterprise IT managers receive from the kit contents, including the Developer Journals.
PushToTest expects that your experience may be different than ours. That is why PushToTest publishes all of the code, methodology, test suites, and deployment scripts we created during this project under a free open-source license. We encourage you to build and operate the use case implementations in your own enterprise environment. All of these are packaged by PushToTest and published under a free open-source SOA Knowledge Kit found at:
http://soakit.pushtotest.com.
If you don’t believe this paper then believe the code!
The SOA Knowledge Kits are intended to be used by the following roles of internal team members: Enterprise Developer – requires immediately useful knowledge to build SOA, BPM, and •
CEP applications. The Kit delivers step-by-step instructions to build the application scenario.
Software Architect – requires a methodology and facts to evaluate technology choices. •
The Kit shows the impact of choices in SOA design, XML handling and transformation; techniques, platforms, payload sizes, and concurrent request levels have on the scalability and performance of the resulting system.
Line Of Business (LOB) Manager – requires performance results and developer •
productivity metrics to make business level decisions on architecture, tools, and personnel. The Kit provides comparative performance benchmark results. Throughput (TPS) measured for each application server, type of application, payload size, and concurrent request levels.
6 References & Glossary
Products used in the PushToTest evaluation.
IBM BEA ORACLE TIBCO
IBM WebSphere Process Server v6.0.1 Websphere ESB V6.0.2 WebSphere Integration Developer V6.0.2 IBM Rational Application Developer V7.0 AquaLogic Service Bus 2.6 BPM Studio 6.0 WebLogic Server 10 (although ALSB and BPM Studio use 9.2) Oracle SOA Suite 10g Oracle BPEL Process manager Oracle ESB Oracle Web Services Manager Oracle Application Server Oracle JDeveloper 10g ActiveMatrix Service Grid 2.0 BusinessWorks 5.6 Enterprise Message Service 4.4.1 Policy Manager 2.0 General Interface 3.5.0 ActiveMatrix
6.1 GLOSSARY
SOA - Service Oriented Architecture. Architectural style based on integration and exposition of functionality using services
BPM - Business Process Management. Methods, techniques and tools to design, enact, control, and analyze operational business processes
CEP - Complex Event Processing. A technology for building and managing event-driven information systems, especially to detect meaningful meta events from an event cloud Ajax - Web development technique used for creating interactive web applications BOD - OAGIS Business Document Object
7 Cost of Ownership Detailed Analysis
The study conducted by PushToTest demonstrates a thorough comparison of the time and effort needed to complete a well defined integration project utilizing four different SOA vendor platforms including TIBCO, BEA, Oracle and IBM. The integration project included a real world deployment scenario for a manufacturing organization − a purchase order creation process and a parts reservation process, as detailed in the report.
For each vendor platform, a variety of metrics were carefully recorded along the lifecycle of common integration activities, from system setup through to post-integration change management and quality assurance activities. The primary metric, and the key to understanding cost of ownership for integration projects, is the time and effort required to complete each activity.
Upon analyzing the data in terms of developer time and cost, the TIBCO platform and integration tools provide a significant advantage in terms of both time and cost.
As illustrated in the figure below, the TIBCO platform and tools provide the lowest cost based on the integration activities performed across all of the four vendor platforms and toolsets included in the study. $10,741 $13,720 $16,596 $21,088 $0 $5,000 $10,000 $15,000 $20,000 $25,000
Labor Cost to Deploy
TIBCO
IBM
Oracle
BEA
Integration Activities Measured • System Setup • Adapter Setup • Design/Review • Project Management • Configuration • Service Construction • Service Orchestration • Deployment • Policy Management • Security Configuration • Monito ring and
Management (SLAs) • Change Management
Summary Study Results for Side-by-Side Product Implementation
The specific differences in labor costs for TIBCO versus the other three vendors across all activities of the integration project are as follows:
TIBCO was 22% less than IBM. •
TIBCO was 35% less than Oracle. •
TIBCO was 49% less than BEA. •
It is important to note that these results are based on a well defined integration scenario which involved the construction and deployment of four services and integration to a popular ERP application (SAP). When these results are extrapolated to represent the scale of recurring enterprise integration projects, the absolute dollar figures become very substantial. This is illustrated in the following table, along with the key assumptions used to scale the study results.
Based on this annual cost of ownership analysis, the specific differences in labor costs for TIBCO versus the other three vendors across all activities of the integration project are as follows:
Potential Annual Cost of Ownership Impact based on Study Results
$936,999 $1,338,627 $1,491,558 $1,717,692 $0 $200,000 $400,000 $600,000 $800,000 $1,000,000 $1,200,000 $1,400,000 $1,600,000 $1,800,000
SOA Cost of Ownership:
Study Results Annualized
TIBCO
IBM
Oracle
BEA
SOA Cost of Ownership Assumptions • 25 integration projects
• Average of 7 adapters per integration project
• Average of 10 services per integration project
• Average of 25 changes per integration project per year
• Labor assumptions same as study
qUANTITATIVE STUDY RESULTS
Analyzing the detailed study results provides additional insights based on the study data. One important analysis point is the distribution of effort and cost across the various integration activities. The figure below shows the distribution of time/effort based on an average of all the vendor projects.
The top four activities, in terms of proportion of overall effort, represent two-thirds (65%) of the overall integration effort.
24% of time/effort for Service Construction •
18% of time/effort for Design/Review •
14% of time/effort for Service Orchestration •
9% of time/effort for Change Management •
Because these activities contribute the most in terms of project cost, it is most interesting to analyze how the vendor integrations fared across these particular activities. The following tables demonstrate the cost associated with each vendor for these four selected activities, in order of their place in the lifecycle of the integration project.
Distribution of Time/Effort Across Integration Activities
Time/Effort by Activity: Average All Vendors
5% 5% 18% 7% 5% 25% 14% 0% 4% 3% 1% 9% 4% System Setup Adapter Setup Design/Review Project Management
Configuration (Implementation of tools) Service Construction
Service Orchestration Deployment Policy Management Security Configuration
Monitoring and Management (SLAs) Change Management
Cost of Key Integration Activities by Vendor
The integration project using the TIBCO platform and associated tools resulted in the lowest labor costs for each of these activities. Looking a bit more closely at the study data yields further insights into the differences in the time and effort.
Design/Review
Category TIBCO IBM Oracle BEA
Labor Cost $1,971 $2,355 $3,382 $3,486
Low Cost Vendor + 20% + 72% + 77%
Cost Basis 37.9 Total Hours • 18.2 Developer Hours • 13.2 Architect Hours • 6.5 Project Manager Hours 47.7 Total Hours • 34.7 Developer Hours • 9.5 Architect Hours • 3.5 Project Manager Hours 67 Total Hours • 38.5 Developer Hours • 22.7 Architect Hours • 5.8 Project Manager Hours 67.8 Total Hours • 31.2 Developer Hours • 29.4 Architect Hours • 7.2 Project Manager Hours Cost Difference (% as compared to lowest labor cost)
Service Construction
Category TIBCO IBM Oracle BEA
Labor Cost ¹ $2,569 $3,580 $3,943 $4,706
Cost Difference (% as compared to
lowest labor cost) Low Cost Vendor + 39% + 53% + 83%
Service Orchestration
Category TIBCO IBM Oracle BEA
Labor Cost ¹ $1,572 $1,816 $2,441 $2,593
Cost Difference (% as compared to
lowest labor cost) Low Cost Vendor + 16% + 55% + 65%
Cost Basis 33.2 Total Hours • 30.7 Developer Hours • 2.5 Architect Hours 38.2 Total Hours • 34.2 Developer Hours • 4 Architect Hours 52 Total Hours • 51.5 Developer Hours • 0.5 Architect Hours 53.8 Total Hours • 42.5 Developer Hours • 11.3 Architect Hours
Change Management
Category TIBCO IBM Oracle BEA
Labor Cost $984 $1,691 $1,603 $1,570
Cost Difference (% as compared to
lowest labor cost) Low Cost Vendor + 72% + 63% + 60%
Cost Basis 21 Total Hours • 21 Developer Hours 35 Total Hours • 27 Developer Hours • 8 Architect Hours 33 Total Hours • 24 Developer Hours • 9 Architect Hours 32.5 Total Hours • 25 Developer Hours • 7.5 Architect Hours
Other Notes No Lines of Code Written No Lines of Code Written 36 Lines of Code Written 79 Lines of Code Written
7.1 COST OF LABOR
While the analysis above articulates the bulk of the difference in labor costs based on the study data, it is also interesting to evaluate the labor costs recorded across all of the activities included in the study. These are presented in the following table. The low cost vendor for each activity is highlighted.
Study Results of Labor Costs Across all Integration Lifecycle Activities
# Integration Activity TIBCO IBM Oracle BEA
1 System Setup $524 $844 $357 $1,657
2 Adapter Setup $461 $981 $775 $969
3 Design/Review $1,971 $2,355 $3,382 $3,486
4 Project Management $914 $525 $744 $2,106
5 Configuration (Implementation of tools) $334 $70 $1,228 $1,284
6 Service Construction $2,569 $3,580 $3,943 $4,706
7 Service Orchestration $1,572 $1,816 $2,441 $2,593
8 Deployment $66 $28 $80 $113
9 Policy Management $408 $822 $765 $628
7.2 APPROACH AND ASSUMPTIONS
The summary results presented were based on a detailed recording of the time and effort involved with identical development, integration, and deployment projects conducted using each of the four vendors platforms and associated toolsets. For each activity, hours were
recorded for each of the three roles involved in the integration project, which is representative of the types of resources that would participate in projects of this nature. An overview of the three roles is listed below.
To convert the time and effort recorded for each activity and each role, the number of hours was multiplied by an average hourly rate to determine the labor costs.
Integration Project Roles, Descriptions and Study Assumptions
Role Role Description Key Assumptions
Integration Engineer / Developer
Works on the analysis, design and implementation of the system.
Executes test plans and does bug fixing to validate the correct behavior of the developed components. Creates written reports about the processes executed as well as any other documentation required. Exposes any technical issues to the architect in order to have it solved. Creates periodic reports to the PM and Architect about the assigned tasks and their status. 2-5 years of experience.
For analysis purposes, an average hourly burdened rate of $47 was used for this role. This is based on: a) An annual salary of $75,000,
which represents the U.S. average salary data for this position sourced from several leading job search sites.1
b) An average burden rate of 25% to account for employee benefits.
Integration Architect
Works on analysis, design and implementation, supporting the team in technical issues, validating that code sticks to the design and technical requirements. Creates models and prototypes if needed.
Also reviews current architecture and defines enhancements, supports product implementation and delivery. Owns the technical aspects of the project and coordinates with both the client and the Project Manager in order to keep the project within the schedule and costs. 10 + years of experience.
For analysis purposes, an average hourly burdened rate of $53 was used for this role. This is based on: a) An annual salary of $85,000,
which represents the U.S. average salary data for this position sourced from several leading job search sites.
b) An average burden rate of 25% to account for employee benefits.
Integration Project Manager
Manages the project in order to guarantee the client satisfaction with a product with quality, reaching the objectives, estimated duration and costs. Assigns and distributes the resources and tasks. Ke eps the client informed of the project status and takes the actions needed, in coordination with the client, to keep the project within the schedule and costs. Negotiates any change to the project. Involves other areas if needed. 2 -5 years of experience.
For analysis purposes, an average hourly burdened rate of $64 was used for this role. This is based on: a) An annual salary of $102,500,
which represents the U.S. average salary data for this position sourced from several leading job search sites.
b) An averag e burden rate of 25% to account for employee benefits. 1 B ased on November, 2007 data from www.usajobs.com and www.indeedjobs.com
7.3 ANNUAL COST OF OWNERSHIP ANALYSIS
The following table demonstrates the scaling of the study results presented in Section 7.1 based on a representative enterprise with significant SOA project deployments. The table identifies the cost of ownership assumptions and a description of the scaling factors that were applied to the study results for each of the integration activity line items.
Resources
1. Software Component Architecture (SCA) is at http://www.osoa.org
PushToTest is a software publishing and global services company specializing in business optimization and information systems test automation. Our expertise is put to work for enterprises needing to understand and solve scalability and performance problems in complex information systems, especially Web Services. PushToTest provides open-source SOA test automation tools for software developers, information architects, and CIOs. Details are found at http://www.pushtotest.com.