F
Policy, Research, and External Affairs1
WORKING- PAPERS
International Trade
International Economics Department The World Bank
August 1991
WPS 755
Hedging
Crude
Oil imports
ill
DeVOU
Ri I IN IN
Cuu
Ittrie
Stijn Claesse,ns
and
Panos Varangis
How a state oil-importing company can use risk management
instruments to insure against price fluctuations for crude oil.
The Policy, Rescarch, and External Affairs Complex distibutes PRE Working Papers to disseminate the findtngs of vork in progrcss a.d to encourage the exchange of ideas among Bank staff and all others interested in development issues. These papers carry the names of the authors, reflect only their views, and should be used and cited accordingly. The findings, interpretations, and conclusions are the authors' own They should not be attributed to theWorld Bank, its Boand of Dimctors, its management, or any of its member countries.
Public Disclosure Authorized
Public Disclosure Authorized
Public Disclosure Authorized
International Trade WPS 755
This paper- a product of the Intemaiional Trade Division, Intemational Economics Department - is part of a largereffort in PRE to study the benefits of using financial instruments to hedge the external exposures of developing countries. Copies are available free from the World Bank, 1818 H Street NW, Washington DC 20433. Please contact Dawn Gustafson, room S7-044, extension 33714 (46 pages).
Crude oil prices have become more and more state oil-importing company locks in a price for volatile since the 1973 oil crisis. Particularly its imports for one month ahead, and the long-sinice the recent Gulf crisis (crude oil prices rosc tern hedgc, in which it locks in the price for six and fell sharply between August 1990 and March months ahead. I'he short-term hedge reduces oil 1991), producers, refiners, and consumers have price volatility a potential 72 percent to 85 been interested in acquiring more assurances percent; the long-term hedge, a potential 65 about the prices they would pay or receive over percent to 81 percent. For these reductions to be future periods. Increasingly they have used such realized, the prices of the crude oils hedged must risk management instruments as futures, options, move together with the futures prices. Tests are and swaps to protect themselves against adverse carried out to see if this is so.
oil price movements.
Apparently oil-importing developing Claessens and Varangis show how risk countries could gain considerably from using managem'nt instruments can be used by a state financial risk management instruments. But oil-importing company to insure against price several constraints - particularly negative
fluctuations for crude oil. The main bencfit of publicity and legal obstacles - can impede a
risk management is reduced uncertainty about state oil-importing company's use of risk man-the oil prices consumers and man-the sLate oil- agement instruments. Educating governmernt importing company will pay rather than lower policymakers and state enterprise officials about average crude oil import prices. the proper use, limits, and benerits of risk
management instruments will make them more Claessens and Varangis simulate two acceptable.
scenarios: the short-term hedge, in which the
The PRE Working Paper Scries disseminates the findings of work under way in the Banlk's Policy, Research, and Extemal AffairsComplex. An objective of the series is to get these findings outquickly. even ifpresentations arc less than fully polished. The findings, interpretations, and conclusions in these papers do not necessarily represent oTficial Bank policy.
1.
INTRODUCTION
... 2
2.
CRUDE OIL PRICES
AND OIL PRICE VOLATILITY
...
3
3.
RISK MANAGEMENT PROBLEMS
OF A
TYPICAL STATE-OWNED
OIL COMPANY
... 5
4.
RISK MANAGEMENT .
...
9
5.
INTERNAL AND EXTERNAL CONSTRAINTS
ON THE USE OF
FUTURES
AND OPTIONS BY A STATE-OWNED
OIL COMPANY
....
...
25
6.
CONCLUDING
REMARKS
AND OUTLINE OF POSSIBLE
LINES
OF ACTION
.
...
32
ANNEXES
...
35
ANNEX FIGURES
.
...
43
1. I
IRODUCTION
*Oil imports in developing countries accounted for approximately 14% of total import expenditures in recent years.' However, in periods of relatively high oil prices, such as during the early 1980s, oil imports accounted for over 25% of their total import bill in many countries. Oil prices have continued to be very volatile, varying between $13 and $40 per barrel over the last decade. The instability in crude oil prices has resulted in market-based pricing of crude oil by many exporters. In 1989, market priced (variable price) crude oil exports by OPEC increased to about 8 million barrels per day, or about 45Z of total exports--up from 3.5 million barrels per day (or about 26%) in 1985 (World Bank, 1991). This change to spot pricing has increased the risk to developing countries now that more of their petroleum imports are at variable, market prices.
The increased instability in the petroleum market after the early 1970s and the move towards variable pricing gave rise to the trading of crude oil futures contracts on the New York Mercantile Exchange (NYMEX) in 1978. NYMEX crude oil
trading volumes increased from 2 million barrels per day in 1983 to over 80 million barrels per day (approximately 1-1/2 times world daily output) in 1989.
In addition to crude oil futures, NYMEX now trades heating oil and gasoline futures, and in 1986, crude oil options were introduced (reaching a volume of 25 million barrels per day in 1989). Crude oil futures and options are now the most actively traded contracts ont the NYMEX.2
* The authors would like to thank especially Mudassar Imran of the World Bank for his valuable comments. We elso would like to thank Ron Duncan, Takamasa Akiyama and Robert Myers for their helpful suggestions.
'In at least 19 developing countries oil imports accounted for 20% or more of the total import bill over the period 1984-88.
'Other exchanges worldwide also trade futures on crude oil and petroleum products such as the London International Petroleum Exchange (IPE), the Singapore International Monetary Exchange (SIMEX) and the Rotterdam Exchange (ROEFEX).
Use of these and other recently introduced financial risk management techniques provide scope for smoother adjustment of developing countries to oil price shocks and thus enhance their ability to plan. The objective of the paper is to explore the application of such risk management techniques to a typical developing country state-owned oil company (SOC) involved in importing and refining crude oil and to make estimates of the potential gains from using such techniques. The paper is structured as follows. First, we describe the crude oil price data that we use in the study and estimate the volatility of oil prices. The next two sections discuss the nature of a typical SOC's exposure to oil prices and present risk management applications for each of the exposures
identified. Section five discusses the internal and external constraints to the use of options and futures hedges typically encountered in a developing country and provides some possible remedies. Section six concludes.
2. CRUDE OIL PRICES AND OIL PRICE VOLATILITY
We explore the application of risk management techniques to 15 crude oils which together represent a very large part of crude oil imports by developing countries. The crudes can be classified according to their geographical areas of origin as follows (the country of origin is inside the parentheses):
Middle East: Dubai (Abu Dhabi), Arab Light (Saudi Arabia), Khafji (Neutral Zone).
Africa: Es Sider (Libya), Saharan (Algeria), Bonny Light
(Nigeria).
Eurove: Brent (U.K.)
North America: Alaska North Slope (USA), West Texas Intermediate (USA) Istmo (Mexico).
South America: Lagotreco (Venezuela), Bachaquero (Venezuela), Oriente (Ecuador), Cano Limon (Colombia).
ALSa: Attaka (Indonesia).
With the exception of the Khafji and Bachaquero crudes, all others are so-called light to medium crudes (API gravity 30° to 40°). Light to medium crudes account
for the bulk of international trade since they are preferred by refineries because of their good yields.
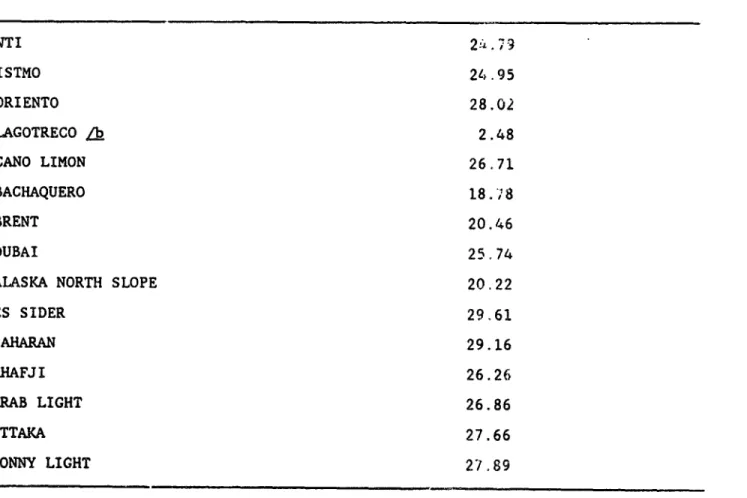
The risks associated with importing these crudes can be measured by the volatility of their prices. As a measure of volatility, we use the coefficient of variation based on monthly observations for the period January 1986 to December 1990.3 The estimated coefficients of variation are presented in Table 1. For most crudes the coefficient of variation is between 25% and 30%. This volatility is high even by comparison with ocher primary commodities. Op average
the volatility for all primary commodities was around 17% for this period.
Table 1: COEFFICIENTS OF VARIATION FOR CRUDE OILS /a
WTI 2 .,-3 ISTMO 24.95 ORIENTO 28.02 LAGOTRECO
/b
2.48 CANO LIMON 26.71 BACHAQUERO 18.,8 BRENT 20.46 DUBAI 25.74ALASKA NORTH SLOPE 20.22
ES SIDER 29.61 SAHARAN 29.16 KHAFJI 26.26 ARAB LIGHT 26.86 ATTAKA 27.66 BONNY LIGHT 27.89
m For the period January 1986 to December 1990.
LR
For the period August 1988 to December 1990.3
Data on crude oil prices were obtained from Platt's Oilgram Price Report and the World Bank's petroleum price data base.
3. RISKi4A?AMENT PROBLEMS OF A TYPICAL_SATE-O_WNED OIL1 -COMPAN
A typical SOC is involved in purchasing crude and petroleum products for
domestic energy needs. While SOCS are exposed to international oil price volatility, domestic prices are not always immediately adjusted in line with
international price movements. The SOC often has to absorb the consequences of this imperfect adjustment and has therefore an exposure to international oil price risk.
OA the basis of a typical SOC's operating procedures, two types of risk management problems can be distinguished: transaction risk and long-term risk. Transaction risk refer to the price uncertainty between the time of ordering crude oil and the time of delivery. Long-term risk refers to the price uncertainty over a longer planning horizon, say six months or a year. For each of the problems a different risk manag,ment strategy is applicable. However, the two risk management strategies follow a logical sequence: the SOC would first engage in transaction risk management (i.e., short-term risk management) and the in long-term risk management.
i) TRANSACTION RISKS:
The typical SOC commits to a purchase of crude oil a considerable period ahead of actual loading, while the price of crude is determined at the time of loading. The time difference between the purchasing commitment and the date of loading varies, but usually is from 20 to 50 days. To analyze more concretely the transaction risk, we describe the case of the SOC of Costa Rica (RECOPE) which is representative of many other SOCs. The following time-axis illustrates the transaction risk management problem for RECOPE.
Time: -(50.20) -(20-15) 0 +30 +(38-40)
(days)
I
~
~
~~I
I
I
I
A A C D E
Date:;civt
A: RECOPE decides on its production program and contracts the carrier B: RECOPE pays in cblones (local currency) to the Central Bank
C: RECOPE date of loading (bill-of-lading) and setting of price
D: Payment to the seller (by the Central Bank through a foreign bank) E: Return of excess payment (in colones) by the Central Bank to RECOPE.
RECOPE decides on its program of production (whether to run the refinery and which product mix to produce) on the 10th of every month, based on expected demand, prices and market sentiment, and makes an assessment of the future prices of the different crudes and refined products. It then decides which crudes and refined products to import and contracts with its suppliers. Five days later the suppliers confirm availability, the contract is finalized and RECOPE agrees with the supplier of the crude (or refined product) to take delivery. RECOPE then contracts with independent shipping companies for loading of the difference crudes at various ports. There is a minimum of 15 days between the time of contracting the shipper (A) and actual loading. The actual loading (C) therefore does not happen until 20 to 50 days after RECOPE decides its production program
(A).4 The actual price paid for the crude is set at the date of loading at the then prevailing international spot price.
Approximately 20 to 15 days before the bill-of-lading date, RECOPE transfers the expected sum due on the bill-of-lading date to the Central Bank, adding 10 for possible variation in oil price and exchange rate over the 20 to
'50 days is the longest time lag and occurs if RECOPE decides to import crude on the 10th day of a month for delivery at the end of the next month.
i5 day period (B). The Central Bank then arranges a letter-of-credit with a fore'gn bank to be used for payment at the date of loading. The letter of credit is cashed about 30 days after the bill-of-lading date when payments are made to the seller (D). About 8 to 10 days after the letter of credit is cashed, any excess payments 'the difference between the actual payments and the expected payments plus the 10%) are returned by the Central Bank to RECOPE in colones (E).
RECOPE is exposed to two type of risks over the period from contracting the shipper (A) and receiving the excess payments (E): dollar-colone exchange risks and oil price risks. The exchange rate risk is as follows. Between points in time A and D RECOPE faces the risk that the colone exchange rate depreciates, in which case its foreign currenicy payment at time D will be more in colones terms than expected and it will receive less back of the 10% variation margin. In addition, RECOPE faces exchange rate risks between points D and E on any excess payments. RECOPE faces oil price risks since it has to decide where to obtain its supplies 50 to 20 days (A) before the actual price to be paid is determined (C). If oil prices increase in this period, RECOPE will have to incur the extra costs since it cannot change or cancel its order (or only at very high costs).
ii) LONG-TERM RISKS:
Long-term risk concerns the transmission of changes in international oil prices from the SOC to the domestic economy over some planning period. The allocation of the long-term risk between the SOC and the rest of the economy derends on the internal pricing system for energy products. At one extreme, the internal pricing system may transmit all international price volatility directly to the final consumer. In this case, the SOC does not face any risk but the economy does. At the other extreme, the internal pricing system insulates the domestic consumer from world price fluctuations by maintaining a fixed domestic price. In this case, all price risk lies with the SOC. In reality, maintenance of fixed domestic prices over a long period is impossible without undermining the viability of the SOC, imposing budget deficits, and distorting consumption and
-8-investment
decisions.
More
commonly,
domestic
prices
are
fixed
for
some
period
of time,
say
six
months,
in
which
case
the
risk
within
that
period
lies
entirely
with the
SOC.
Whether
the
risk
lies
with
the
SOC
or with
the
domestic
consumer,
the
SOC
is in
a
position
to manage
it for its
own
benefit
as well
as for
the
benefit
of
the
economy
as
a
whole. The SOC is the logical
place
to manage
such
risks
since
it
has
a
physical
exposure
through
purchasing
oil)
and
can
thus
"match'
physical
with futures
or options
trading. It also has a good knowledge
of the oil
4. RISK MANAGEMENT TECHNIQUES
i) Hedging Transaction Risks
The transaction exposure to oil price risks could be managed using futures on oil or options on futures on oil.5
HixigngxJ wi tuh e s
The SOC has a short position in oil because it has a commitment to satisfy domestic demand and domestic prices cannot be adjusted instantaneously. To hedge the resulting price risk, we seek an asset whose return is positively correlated with oil prices. Then as oil prices go up, the return on the hedging asset increases to offset the additional cost of higher import prices for the SOC. The purchase of futures contracts is a good example of such an asset. The basic concept of futures contracts is that the buyer of a futures contract purchases a specific asset at a specified price on a specific date. Contract terms (amounts, grades, delivery dates, etc.) are all standardized in futures contracts, and futures are traded only on organized exchanges through clearing house systems. To ensure good performance on these contracts, profits and losses on futures are settled daily, and futures contracts require a small "margin" as
collateral (see further Annex 1). If spot oil prices rise over the planning horizon, so will futures prices. The profit from selling futures contracts back at the higher price will offset the extra cost of importing oil. Conversely, if price-s fall lower oil import costs offset the loss on the futures.
The transaction risk of the SOC could thus be managed using futures as follows. On the date of arranging the purchase of oil, the SOC could buy an oil futures contract. The maturi ., date of the contract should be as close as possible to the expected date of loading, but not before it. The futures contract
sFor more details regarding the use of futures and options see Masuoka (1990), Kolb (1985) and Labuszewski and Myhoff (1988) a,b. For another agplication to oil, but from the producers' point of view, see also Overdahl
would be for the same volume of oil as the oil contracted for purchase. The contract would be terminated through a reverse transaction in the futures market (i.e., selling the futures contract) on the date of loading (note that even though futures contracts specify physical delivery, by reversing contracts this does not need to happen). In this way the effective price paid for the oil will be locked in on the date of entering the agreement with the shipping company.
For example, assume that in March 1991 the SOC plans to buy crude oil two months ahead i.e., in May 1991, in the amount of 10,000 barrels, where the price to be pai.d would be the spot Mexico (Istmo) price two months from now. The SOC would then buy 10 futures contracts of 1,000 barrels each, maturing in two months.' The price of the May 1991 futures contract is quoted as say $18.50/barrel. The SOC would have to put up about $12,000 in margins. Two months later, a gain or loss in the import cost of the crude--arising from fluctuations in the Istmo oil price--is offLet by the loss or gain in the futures contracts. The offset may not be exact because of basis risks (see below). Between
initiating the futures contracts and closing them out, transfers of cash to and from a broker will be required almost every day because the gains and losses in the futures contracts are settled daily.
Hedging with ORtiong
The main disadvantage of hedging with futures is that the potential bernefit of an import price decline is eliminated along with the potential loss of an import price increase.7 Yet falling import prices are clearly desirable because this reduces the SOC's cost. Hedging with options provides protection against upward price movements while still allowing the SOC to gain from a price fall. But this asymmetry has a cost.
6 Here, for simplicity the delivery date is assumed to coincide with the timing of the import costs.
7Another disadvantage can be the unpredictability of the margin requirements
A number
of technical
terms
are
involved
in options.
We explain
the
most
important:
(a) If the option
gives the right
to buy, the option is a "call'
option;
if it gives
the
right
to sell,
it is a "put"
option;
(b)
The asset
on
which
the
option
is written
is referred
to as the
"underlying"
asset;
(c)
The
price
at which a buyer
of the
option
can
buy or sell the
underlying
asset
is
called
the "strike"
or "exercise"
price;
(d) If the right to buy or sell is
exercised
by the
buyer,
the
option
is "exercised;"
(e)
The date
on (or
before)
which
the
buyer
can
buy
or sell
the
underlying
asset
is called
the
"maturity"
or
"expiration"
date;
(f)
An option
which
can
be exercised
only
on the
expiration
date
is called
a "European"
option;
an option
which
is exercisable
on or before
the
expiration
date
is an "American"
option; and
(g)
The
price
of the
option
is
calleci
a "premium."
The buyer
pays the
premium
to the seller
at the time
of
contracting.
Oil
options
are
written
on futures
contracts
on oil
with
a maturity
equal
to the
maturity
of the
option
and are
American-style
options.
Oil
call
options
are the most relevant for an oil-importing
SOC.
An oil call option gives the SOCthe right,
but not the obligation,
to buy a futures
contract
for oil at a
predetermined
price
called
the
strike
price. If the
futures
price
at maturity
is higher
than
the strike
price
then
the call
option
is valuable
and
will be
exercised
(because
the SOC can buy at the lower
strike
price
and sell
at the
higher
market
price).'
Bt.t
if the
futures
price
at maturity
is lower
than
the
strike
price
then
the
option
will
expire
without
value. Purchasing
call
options
allows
the SOC to lock in maximum
prices
for imported
oil over the planning
horizon
(subject
to basis
risk),
at the
cost
of the
premiums
on the
options.
Compared
to futures
contracts,
options
have
the
following
three
interesting
characteristics.
First,
futures
"lock-in"
a price,
but
options
contracts
limit
the
maximum
loss
(equal
to the
premium
paid
up-front)
and leave
an opportunity
to take advantage of favorable price movements. Options thus have flexibility
in payoff profiles. Second, the buyer has to pay the premium up-front.9 This often requires a significant amount of cash. Third, while the buyer of options faces the credit risk or default risk of the counter-party, the seller does not. Opcions are not subject to margin calls. It is the seller who is liable, not the buyer.
The SOC would buy call options at the same time as making purchase arrangements. The maturity-date of the option would be as close as possible to the expected date the purchase is settled but not before it. For example, if the SOC contracted in January 1991 to purchase one month ahead, paying the then-current oil price, the SOC could have bought a March call option with an exercise price of say $22 dollar/barrel. On January 21, 1991, it would have paid a premium for this option of $1.10. If oil prices moved above $22/barrel, the gain on the call option would have been offset by the increase in import costs and the net price paid would have been $22/barrel, plus the cost of the premium, or $23.10/barrel. If the oil price fell, the net price paid would be the actual oil price, plus the premium.
Options are available with several exercise prices: the lower the exercise price, the more insurance the SOC obtains, but the higher the premium for the
call option. As an example, Figure 1 plots the premium as a function of the exercise price for January 21, 1991 options (source of data: Wall Str1eS
jurjal).
As can be observed, option premiums are decreasing in the exercise price (and, in general, increasing in the maturity of the contract.)Which exercise price of the call option will suit the needs of the SOC best
will depend on, among others, the following two factors. First, the impact of higher oil prices on the SOC's cashflows and profitability. Through sensitivity-derived scenarios the SOC can determine a profile of cashflows and profitabilities under different oil prices. This will provide the SOC with an
'There exist futures-style options where the premium does not need to be paid upfront, but where a (daily-adjusted) margin is required.
-13-Opt ion Premiurr.s on WTI
Cjanuary 21. 1991, from WSJ) 311 29 2a 25 1 24 23 22 2 194 Flur 1? 16 15 13 19
~~~~20
22Exercise Price (in S/bOI)
0 May .4 April 0> kirch
Figure 1
indication of which oil price levels are acceptable in terms of profitability (for which no insurance needs to be obtained) and those price levels which are not acceptable (for which price insurance needs to be obtained). Price level
insurance could then be obtained by buying call options with exercise prices equal to the price level at which prices become unacceptable in terms of cashflow and profitability. For example, the SOC could determine that prices above $25/barrel lead to negative cashflows and that call options with exercise prices of $25/barrel need to be bought. The second main factor determining the choice of options will be the SOC's expectations about future oil prices. On this basis SOC may decide that a particular option is attractively priced. It should be realized, however, that prices of options already reflect market sentiment regarding future oil price movements and options are efficiently priced, i.e., provide no opportunity for profitable arbitrage and no consistent rewards for
speculators. It would thus be difficult to make profits by buying certain options at certain times and, in general, the SOC's own price forecasts should play a minor role in deciding whether to buy an option or which option to buy since it cannot be expected that che SOC is able to consistently beat the market.
Basis Risk
Futures and options on oil are available on several exchanges, including the New York Mercantile Exchange (NYMEX) where they are written on West Texas Intermediate (WTI) (contract terms are listed in Annex 1, certain restrictions apply). However, most SOCs in developing countries do not import WTI crude oil.
Using futures or options based on the WTI to hedge other crude oil price risks could expose the SOC to so-called "basis risks": the possibility that the WTI futures price moves differently than the hedged crude oil price. The hedge ratio, the amount of futures or options contracts to buy as a fraction of the amount of physical crude oil bought, could be adjusted to minimize the degree of basic risk. A hedge ratio of one would imply that for each 1,000 barrels of
imports one WTI futures contract (equivalent to 1,000 barrels) would be bought.'° The optimal hedge ratios were calculated in accordance to the methodology outlined in Annex 2. The relevant equation to derive the hedge ratio is equation 2.5 of Annex 2 relating spot prices of different crudes to the WTI futures prices. The slope coefficient b from this equation is the optimal hedge ratio. Results from estimating hedge ratios for the 15 crudes are given in Table 2. The relevant futures are the two nearby New York crude oil futures contracts based on WTI. Monthly averages of daily futures price data for the period August 1986 to December 1990 are used as independent variables. For all crudes, the monthly averages of the cash prices are used as the dependent variables.
'0A hedge ratio of one can also be used if the SOC decides to use options instead of futures. For proof see Annex 2.
Tab1e JZ: HEDGE RATIOS FOR THE DIFFERENT CRUDES ;
~~~~~~~bi
/ bi - O b; 1 21 R D.W. t-Stat t-stat Istmo (Hex) 1.08 16.53 1.19 0.88 2.02 Lagotreco 0.85 10.73 -1.89 0.69 1.89 (Ven) Lagotreco j/ 0.92 9.63 -0.84 0.78 1.84 Oriente (Ecu) 1.01 12.24 0.13 0.77 1.99 Cano Limon 1.05 15.03 0.73 0.85 1.99 (Col) Bachaquero 0.64 8.95 4.94 0.60 2.05 (Ven) WTI (USA) 1.03 30.75 1.03 0.97 1.96 Dubai (Abu 1.00 17.79 0.00 0.86 1.92 (Daubi) Brent (U.K.) 1.07 19.13 1.28 0.88 1.91 Alaska North Slope (USA) 1.06 18.11 1.03 0.86 1.93 Es Sider 1.09 14.39 1.18 0.84 1.94 (Libya) Arab Light Saudi Arabia) 1.01 14.40 0.21 0.80 1.83 Attaka (Indo) 1.03 14.60 0.36 0.80 1.85 Bonny Light 1.08 16.10 1.17 0.83 1.73 (Nig) Sahara 1.12 14.48 1.55 0.84 1.96 (Algeria) Khafji (Neutral Zone) 0.97 13.22 -0.41 0.74 1.79/
b, signifies the hedge ratio.~/
This column shows the t-statistic for this coefficient biin the equation Pi - bi of1. + th from testing the hypothesis b; - 1. i.e., the hedge ratiois equal to one. The previous column shows the t-statistic from testing the hypothesis b,- 0. A high t-statistic implies that the hypothesis bi - k (for k - 0,1) may be rejected; a low statistic indicates that this hypothesis may be accepted.
Table 2 indicates that, with the exception of Bachaquero, all 15 crudes can be hedged effectively using the WTI futures contract. The high R2 from the regressions indicates that basis risk is small (between 3% and 23%)." Excluding WTI (which is expected to have extremely low basis risk since the N.Y. contract is written on it), most of the remaining crudes have basis risk between 15% and 20%. The closest relationships with the N.Y. futures contract are exhibited by Dubai, Brent, Alaska North Slope, Istmo, Cano Limon, Es Sider, Bonny Light and Saharan (basis risk between 12% and 17%). Th- orst performers are Bachaquero, Khafji, and Lagotreco (for the period Janau:y 1986 to December 1990). However,
in the recent period (after July 1988), the Lagotreco price has followed the N.Y. futures contract price more closely, and basis risk has declined from 31% to 22%. Bachaquero and Khafji are so-called heavy crudes, with smaller price variability,
since they are relatively more price-inelastic. The WTI contract cannot be expected to hedge the price risk of these two heavy crudes well. Khafji performs better in terms of basis risk, probably due to the fact that it is not as heavy as Bachaquero (API gravity of 250 versus 17'). The contrast between a crude having a close relationship with WTI and one that does not is also shown in Annex Figures Al (Istmo-WTI) and A2 (Bachaquero-WTI) respectively.
We examined also what happens to basis risks if, instead of buying the contract with an expiration date nearest to delivery, the SOC buys a contract with a later expiration (second to fourth contract from delivery). The results indicate that this would lead to only a small increase in basis risk (an average of 1.1%, with 4% being the highest (Lagotreco)). Again the hedge ratio is not significantly different from one.
The hypothesis that the hedge ratio is equal to one, is accepted for all crudes, except Bachaquero, as indicated by the figures in the third column of
Table 2.12 Using a hedge ratio of one, rather than the estimated ratio, basis risk increased at most by 2X and there was no increase in basis risk for Dubai, Oriente and Arab Light. For most crudes, basis risk increased by only 1 to 1.5X.
The hedge ratios derived so far refer to hedging the physical (barrels of oil). When hedging dollar expenditures, hedge ratios can be obtained by estimating the b,'s based on spot and future prices, expressed as percentage differences rather than as absolute dollar amounts. This was done for all 15 crudes and the results are very similar to those obtained for hedging the physical. The hedge ratios are found to be not significantly different from one, but there was an increase in basis risk compared to hedging the physical.
In summary, therefore, the results indicate that the SOC can reduce its transaction exposure by between 74X and 86X for all light and Khafji crudes and that a hedge ratio of one can be used for WTI options as well as for futures contracts. Only in the case of Bachaquero crude did we find a weak relationship with the WTI futures price and thus it would be inadvisable to use WTI for hedging Bachaquero crude oil imports.
ii) Hedging Long-Term Price Risks
Management of the transaction risks will only reduce oil price risk over a short horizon (one to three months), will mainly protect the SOC, and will not hedge the risks for the entire developing country. A strategy for managing the long-term oil price risks would be to use longer-dated futures contracts. This strategy would involve buying a series of futures contracts with maturities varying from say three to 12 months. The amounts to be bought would reflect the anticipated imports of crude oils in each month. The hedges would be put in place, for example, at the start of each fiscal year, and not be changed during the year, or could be rolled forward during the year and thus cover overlapping
'2A hedge ratio hi her than one means that in excess of one contract of WTI
fiscal years. If this strategy is pursued, the short-term, transaction hedges would not be necessary (or, at least, they would have to be modified).
We simulate here the following long-term hedging strategies. We assume that in July and January of each year the SOC wants to lock in import prices over a six-month planning horizon.'3 Since trading in the nearby futures contract is
not very liquid, we assume that the SOC buys contracts two to seven months ahead.
For example, in July of each year the SOC buys contracts for each month in equal amounts, starting from September and up to February (of the next year). As the contracts approach their maturity month, the SOC reverses the contract by selling in the month 3efore expiration an identical contract, e.g., in August of each year the SOC sells the September contract of that year. We assume also that the SOC buys and sells all contracts gradually throughout the month so that it pays
or obtains the average price for the contracts in eacth month. Th-is is to assure
comparability to the SOC's cash transactions which, since we use average cash price data, are also assumed to take place gradually throughout the month.
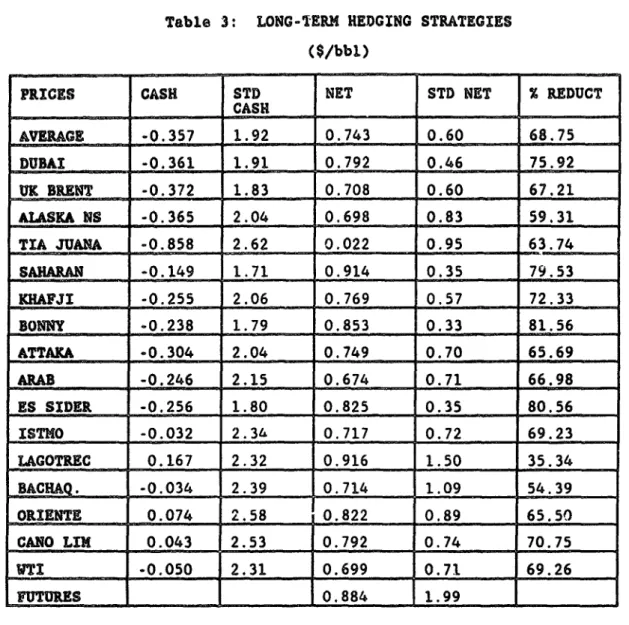
We have 4 1/2 years of observations on futures prices (starting July 1986 through December 1990) and can therefore simulate only eight six-monthly hedges, starting the first in July 1986 and going through January 1990. We use a hedge ratio of one which was shown above to be a conservative, yet efficient hedge ratio for short-term hedging. Table 3 reports the important results from the six-month hedging strategy applied to each of the crude oils. The last row (Futures) reports some statistics on the N.Y. futures contract.
'3e choose a six-month hedging strategy since trading in longer term contacts is usually not nearly so liquid and a six-month horizon should allow the SOC and the country sufficient lead time in adjusting domestic prices.
Table 3: LONG-TERM HEDGING STRATEGIES ($/bbl)
PRICES CASH STD NET STD NET X REDUCT CASH .. .__ ___ _ CAS _ _ __ _ __ __ __ __ _ AVERAGE -0.357 1.92 0.743 0.60 68.75 DUBAI -0.361 1.91 0.792 0.46 75.92 UK BRENT -0.372 1.83 0.708 0.60 67.21 ALASKA NS -0.365 2.04 0.698 0.83 59.31 TIA JUANA -0.858 2.62 0.022 0.95 63.74 SAHARAN -0.149 1.71 0.914 0.35 79.53 KHAFJI -0.255 2.06 0.769 0.57 72.33 BONNY -0.238 1.79 0.853 0.33 81.56 ATTAKA -0.304 2.04 0.749 0.70 65.69 ARAB -0.246 2.15 0.674 0.71 66.98 ES SIDER -0.256 1.80 0.825 0.35 80.56 ISTNO -0.032 2.34 0.717 0.72 69.23 LAGOTREC 0.167 2.32 0.916 1.50 35.34 _ _ -0.034 2.39 0.714 1.09 54.39 ORIENTE 0.074 2.58 _ _0.822 0.89 65.50 CANO LINi 0.043 2.53 O0.792 0 .74 70.75 WTI I -0.050 2.31 O0.699 O0.71 69.26
UTURES
_________
_1.99
0.884In Table 3, the column "Cash" reports the average loss or gain (all figures in dollar per barrel) the SOC incurred over the eight planning periods as a result of spot oil price movements during the six-monthly period. For example, the entry -0.032 for the Istmo strategy reflects an average loss per barrel of 3.2 cents from buying Istmo at higher prices during the eight six-monthly periods. It shows that on average the SOC did not pay much higher prices over the planning period when compared to the price in the raonth when the plan was
started. The column "STD CASH" reports the standard deviation of the unexpected higher or lower cash payments and is thus a reflection of the uncertainty in the
$2.33/barrel. This indicates that the SOC experienced substantial uncertainty over the planning periods. The column "NET" represent the net results of hedging; it is thus equal to the gain or loss on the cash position minus the gain or loss on the futures positions. In the cane of Istmo, the hedging strategy led to an effective price paid for oil which was 71.7 cents per barrel lower than average
spot prices for the planning periods. The column "STD NET" indicates the riskiness of the net result: the standard deviation of the net gain or loss. The column "% REDUCT" indicates the percentage risk reduction achieved through using the futures. In the case of Istmo again, the risk reduction as a result of hedging is 69%; in other words, the SOC is able to lay off 69% of the risk of unexpected price movements during the six-month planning horizons using the long-term futures hedges. Finally, the column "MONTH" indicates the standard deviation of the monthly net gains and losses from unwinding the futures contracts and buying the crudes imports. This standard deviation is different from the standard deviation
"STD
NET" since this is a standard deviation of (48) monthly figures and the "STD NET" is a standard deviation of only eight averages.Table 3 indicates that, on average, the six-month hedging strategy achieved a risk reduction of about 69% in the case of Istmo, while also leading to a lower purchase price for oil by about US$0.72 per barrel. The gains in terms of lower import prices could, of course, have been losses if a different period was chosen, but for any period the six-month hedging strategy would have led to a
substantial decline in oil price volatility. For most crude oils, the risk reduction was between 65% and 80%. The best performers were the same as in the short-term (transactions) hedge, which is to be expected given the fact that these crudes follow the WTI contract more closeby than the others. The results indicate that long-term hedging of Lagotreco and Bachaquero (based on the N.Y. futures contract) could be problematical. However, as reported above, Lagotreco
has followed the N.Y. futures contract more closely since August 1988, and thus hedging Lagotreco in this way may be possible now.
Six-mths
Istmo
Hedges
CJuly
+
January)
Average and MonthIy Gains
S 4 -3~~~~~~~~~~~~~~~~~~~~~~~~~~~~~~~~~~~~~~~~~~~4 34- . 2 40 0~~~~~~~~~~~~~~~ Li -3 19B6 1987 1987 19813 1988 1989 1989 1990 year
0 Futures + CaSh ,> Net A Monthly Gain
Figure 2
The row "FUTURES" in Table 3 indicates the average gain on the position of the futures, $0.884 per barrel, and its standard deviation, 1.99. In this case the six-month futures led to an average gain over the period. In general, this is not to be expected and using futures will not necessarily lead to lower prices paid for imports but to more stable prices and thus less risk.
Figure 2 shows the gains and losses for the Istmo hedges over the July 1986 to January 1990 period. It shows, on a six-month cycle, the gain/loss on the futures, the cash, and the net gain/loss. It also shows the gain and loss of unwinding the futures on a monthly basis. As can be seen, the net is much less volatile than the cash figure since every time the futures offsets the cash.
Also, month by month the gains are very stable. In 1990 the gains of hedging are quite large as prices increased later in the year.
Figure 3 plots the same futures, cash, net and monthly gains and losses for hedging Lagotreco. As can be observed, there is much more volatility in the monthly net gain/loss than in Figure 2, a reflection of the fact that this strategy achieves only a 35X risk reduction.
Other risk management techniques exist to hedge long-term risk. The most applicable to a SOC is a commodity swap which allows effective long-term price insurance.' A commodity swap is a series of commodity forward contracts; however, it does not involve deliveries of physical commodities since transactions are made as pure financial transactions. Assume that a SOC wants
to 'lock-in" the price of oil imports for the next five years, and that it expects to import 2.5 million barrels a year. The SOC could arrange with a commercial bank the following commodity swap agreement.
Amount: The U.S.dollar equivalent of 2.5 million barrels of oil a year.
Fixed Price Payor: SOC.
Floating Price Payor: Commercial bank.
Maturity: 5 years, with annual, semi-annual or monthly payments. Fixed Price: US$ 20.00 per barrel (indicative).
Floating Price: The average daily closing spot price of WTI oil over the year, semester, or month preceding each payment date. Settlement: Netting-out.'5
14For details see Masuoka (1990).
15 "Netting-out" means that a settlement amount is calculated by multiplying the contracted amount by the difference between the fixed and floating prices. The floating price payor pays the calculated amount if the floating price is higher than the fixed price, and vice versa. The bank would lay off the oil price risk it takes on in this swap by undertaking an offsetting swap or by engaging in futures transactions to roll over risks. The cash flows passing through the intermediating bank would not quite offset each other thus allowing the bank to make a return for bearing the credit risk.
Six-mths
LagoTr
He d
geS
'J
u!v
+J!
e a-,I Avearaw anti Mo.rtnr, .-a nG4 3 0~~~~~~~~~~~~~~~~~~~~~
I
T\
2~~~~~~~~~~~~~~~0
1986 1987 1987 1988 1988 1989 1989 19900 FutureS + Cash Net Monthly Ga,n
Figure
3
In this
example,
the
SOC
would
buy
oil
from
any th'Lrd
party
from
time
to time
at
the spot price. However,
the SOC's expenses
for the next 5 years would
effectively
be fixed by means of the oil swap at a price of oil of US
$20.00/barrel
since
the floating
rates
payments
from
the commercial
bank will
offset
the
variable
costs
of import
payments.
For
creditworthiness
reasons,
the
SOC
may
have
to put
up some
"collateral"
to assure
lenders
of performance
under
the
terms
of the
swap
agreement.
One
way
to do this is by using a "marked-to-market"
swap which
would thus operate
similarly
to a futures
contract.
Other methods
are also possible
such as
escrowing
some
foreign
exchange
at a foreign
bank. An important
point
is that
price of oil increases to, say, $40.00/barrel, expenses will stay the same. This improved credit risk may lower the cost of financing SOC' s working capital or may give the SOC access to new lenders.
Finally, swaps do not necessarily refer to long-term coverage but can also cover shoi.ter periods such as three or six months. A SOC may prefer swaps for shorter term hedging over futures/options if liquidity for margin calls or option premiums becomes a problem. Also, futures and options can be very labor-intensive, requiring frequent monitoring of the market. Swaps require little monitoring once they are in place. Swaps for shorter periods are now commonly available in the over-the-counter market.
5. INTERNAL AND EXTERNAL CONSTRAINTS ON THE USE OF FUTURES AND OPTIONS BY A STATE-OWNED OIL COMPANY
The following major constraints and concerns regarding the use of risk management techniques such as futures and options by SOCs in developing countries are often raised:
(i) Cash Flow
Using oil futures and options requires an off-shore account to buy futures and options and, more importantly, to cover margin calls. The initial dollar amount needed to buy futures (initial margins) and options (premiums) is under the control of the SOC and can thus be planned. However, maintenance margin calls can require daily injection of funds depending on the daily fluctuations of the oil prices. For example, say that the SOC buys one oil futures contract and subsequently oil prices drop by 10%. The SOC will need to put into the margin account as much money as whpn it- hoa.lht- the contract. When prices rise, money will be deposited into the SOC's margin account if the price movements are in the same direction as the SOC's position, i.e., if the SOC is long and prices increase, the SOC will be able to withdraw from its account. However, the SOC's margin calls and funds available for withdrawal during the life of the hedge will be unknown, as this depends on the overall exposure of the SOC and the daily price movements.
To manage the cash-flow problem, a stop-loss position can be taken. That is, if prices fall below a certain level and the SOC is long, it orders the liquidation of its position. This, however, reduces the effectiveness of the hedge."6
The use of options is another way to by-pass the problem of margin calls. When buying calls and puts there are no margin calls. Buying a call or put does not involve risks associated with the buyer of the call or put since they are guaranteed through the exchange. Selling calls and puts does involve
'6Further note that margins can be put up by posting a US Treasury bill or equivalent instrument and therefore no interest is lost on margins.
credit risk (i.e., the seller may not deliver) and requires margin calls. Since the SOC is an oil buyer, it will be buying call options and no margin will be necessary. Of course, the use of options involves a cost in terms of the premium paid.
To assess the cash flow implications of a SOC executing the transactions involved in a hedging strategy, we simulated the following futures position. In each month of the year the SOC buys 100 contracts of the second nearby futures contract at the beginning of the month, e.g., in January 1991, SOC buys the March 1991 contract. 100 contracts correspond to 100,000 barrels of oil per month, which amounts on a yearly basis to 1.2 million barrels. The SOC is assumed to hold these 100 futures contract throughout e tch month and to sell them at the end of the month. The SOC is now faced with the possibility of morgin calls and margin withdrawals. It is further assumed that the initial margin is $2,000 per contract (the minimum dictated by the NYMEX, see contract terms in Annex 1) and that the maintenance margin is 75% of the initial margin, or $1,500. This implies that the SOC will need to maintain at least $1,500 per contract in its margin account. If, due to a drop in prices, futures prices are resettled and the account falls below $1,500 per contract, the SOC will face a margin call of an amount equal to that required to bring its account per contract back up to the initial margin of $2,000 per contract. If, due to a price increase, resettlement leads to the margin account rising above $2,000 per contract, the SOC can withdraw the surplus in excess of $2,000 per contract.
If the SOC would have followed this strategy over the period July 1986 to December 1990, the maximum possible margin call the SOC would have faced on any single day for a total of 100 nearby futures contracts bought would have been $400,000. This extremely large margin call would have occurred in the month of August 1990 when the futures price fell by $4 per barrel on the 18th trading day of that month (from $30.91 to $26.91). The maximum withdrawal the SOC would have been able to make over this period would have been $317,000 on the 18th trading
Max i mum anrci MI rri numr u
.h
F3,v
Secorld Nc!ar a o Cr tract
41 3*_ 2 1 IC -1 ID -\ -2 -3 1985 198W 198, 1988 1988 1989 '989 1990 1990 'wear I Mont ri
0 Max Withdlrl + Max Ca I I 0 Av Mnth
Figure 4
day of the month of October 1990 when the futures price increased by $3.17 a barrel (from $31.08 to $34.25). It is not surprising that the SOC would have had the largest margins calls and withdrawals in the fall of 1990, given the extremely large price volatility in the oil market during that period as a result of the Gulf war.
For all other months considered the maximum calls and withdrawals were considerably less. Figure 4 plots the maximum calls and withdrawals per contract
for each month between July 1986 and December 1990 (for 100 contracts the amounts need to be multiplied by 100). The lower half of the figure shows the maximum
calls in each month and in the upper half the maximi.n withdrawals in each month
are shown. The figure also shows the average daily withdrawal or margin call in each month. As can been seen, the Fall 1990 period was exceptional. On average,
the SOC would have been able to withdraw money from its account over this period as futures prices increased. The average withdrawal per day per contract over the whole period July 1986 through December 1990 was $28.44 (or 2.U8 per barrel). The largest average withdrawal over any month would have been in September 1990, $610 per day per contract, as the futures price rose from $28.56 per barrel on the first of the month to $39.51 per barrel at the end of the month--a gain of about $11 per barrel or $11,000 per contract. The largest margin call would have been in the month of June of 1988, $122 per day per contract, as prices fell over that month from $17.72 to $15.16.
It can be seen that margin calls can be substantial and the SOC therefore needs to have access to funds on very short notice. We estimate that for 100 contracts, the SOC should have access on an almost daily basis to at least $100,000. Of course, th_ need for funds for margin calls does not represent a cost to the SOC since the negative cash flow impacts on margin calls are offset by lower future oil import bills. It only implies that the SOC's cash needs will change over time.
(ii) Negative Publicity
Within governments in developing countries there is concern that the use of options and futures will lead to criticism and negative publicity. If the SOC "locks in" a price of US$30 per barrel by using futures, yet later the price falls to US$20 per barrel, there may be public criticism. However, the use of call options would allow the SOC to protect itself from price rises while allowing it to participate in the benefits of lower prices, i.e., they can set a maximum price. There is, of course, a cost to that insurance in terms of premiums paid. Premiums become more expensive the more insurance (i.e., the lower the exercise price) the SOC buys (see Figure 1). But the use of options is something to consider if the possibility of negative publicity is a concern.
The general issue here is that the objective of using futures and options should not be to make money but to guarantee a 'reasonable' price for oil purchases and reduce the exposure (risk) from oil price movements. This reasonable price should allow the SOC to avoid losses on its operations, reduce cashflow problems, and guarantee a relatively stable price for the consumer. What is this "reasonable" price? The SOC will need to determine that, on the basis of sensitivity analyses of its cash flow and profitability. Of course, the price should be attainable in the light of prevailing oil market conditions.
On this point, it is interesting to note what a senior Mexican official had to say about Mexico's recent hedging activities which resulted in locking-in a price of US$17 per barrel for its exports over a six month period. He was quoted by the Washington Post (March 27, 1991) as saying: "We said, listen, given the uncertainty and given the volatility--it can go to US$40 (a barrel) and it can drop to US$10- -we have a budget here, a budget that we have to cover. We did not do it to be ahead. The government does not speculate in that sense. Doing nothing is speculative", he said. "It does look now that we are ahead compared to doing nothing. Some days we do not do as well. But we sleep well".'7 Regarding Mexico's decision, the Wall Street Journal (March 11, 1991) quoted a Finance Ministry official as follows: "It is extremely important for us that
investors know that, no matter what happens to the price of oil, the economic program is on for 1991. Regardless of what happens, we have got US$17 a barrel.. .and there's enough in the kitty". On the importing side, Brazil and Chile have recently used futures and options to hedge part of their oil imports.
The idea of fixing a price over a relatively long period of time is not novel in developing countries. Ghana, C8te d'Ivoire and Cameroon sell forward a
large part of their cocoa crop for at least a year or more. In most years they
"7At the time of the Washington Post article the price of Mexican crude was US$15.76.
sell some or all of the crop before they harvest it.18 Furthermore, price fixing is cften done by state marketing boards (SMB) and negative publicity attached to prices received is seldom a concern or a problem. By fixing a price the SMBs are able to guarantee a price to the farmer without incurring a risk.'9
A final note on the issue of negative publicity. To avoid or overcome negative publicity, the hedging strategies adopted should have a broad governmental mandate. One way to do this would be through the establishment of a High Level Committee (HLC), consisting of representatives of the SOC, the Central Bank, the Ministry of Energy, and the Ministry of Finance. The HLC would, for example, discuss and outline the hedging strategy of the SOC, determine the financial needs of carrying out such operations, as well as oversee and control the hedging activities of the SOC.3 The advantages of the HLC structure would be to spread the responsibility for the hedging activities at the highest levels. In addition to spreading responsibility (through appropriate institutional arrangements, such as a HLC) there should be provisions that would foster dissemination of knowledge about risk management techniques (through educational seminars) within the government and to the general public.
(iii) Flexibility of Action
One of the major problems that a typical SOC faces is an inability to act fast when the situation demands. In many cases a SOC does not handle the foreign
1'This is done, however, through bilateral forward contracts rather than futures or options. The benefits of forward contracts are that both buyer and seller avoid commissions, premiums, margin calls, and extend coverage into maturities where futures markets become illiquid. The big drawback is that both buyer and seller are exposed to performance risks which can be significant.
'9SMBs in Ghana, C8te d'Ivoire and Cameroon are able to contract forward because they have established excellent reputations. However, this is a rather special case, with the rule being that performance risk is considerable in most other cases.
2The actual implementation of the general hedging strategy will have to be with the SOC which will need to establish a risk management unit (RKU) to do so. The RMU would consist of a group of staff highly skilled in the use of risk management techniques.
exchange involved. This is normally done by the Central Bank (see the case of Costa Rica in Section 3). This can lead to two difficulties: (i) in obtaining
foreign exchange to purchase futures or options, and (il) in the maintenance of a margin account. The problems could be solved by establishing a continuous, open line of communication between the SOC and the Central Bank. Staff in the Central Bank would need to be assigned as points of contact with the SOC. They should be able to qvickly authorize funds needed for the SOC's hedging activities, particularly for margin calls. The limits within Central Bank staff can act will need to be determined by the Central Bank in coordination with the SOC and
possibly the Ministry of Finance.
(iv) Legal Svstem
In many developing countries state owned companies are not allowed to use futures or options. This would need to be changed so that the SOCs could use risk management techniques; a new legal framework would have to be drawn up where the use of futures and options (and, in general, the use of foreign financial markets) is allowed. Some developing countries have such legislation (e.g., Brazil), and recently Colombia has embarked on establishing legislation to allow
the use of futures and options markets.
(v) Accountabl ity
For any risk management system to perform effectively, a system of checks and balances should be built-in. A system to record trades, financial
transactions, and all other activities related to risk management should be established in order to allow full and proper evaluation of trading performance and to ensure the accountability of the system. As an example, an experienced New York brokerage house outlined for us a system for monitoring and evaluating hedging activities (see Annex 3).
6. CONCLUDING REMARS AND QOUTLINE O POQSSBLELINES OF ACTION
The aim of this paper was to examine the applicability of risk management techniques to a typical SOC importing crude oil and to provide estimates of the gains if such techniques were implemented. We examined the relationship between the different crude oils which are imported by developing countries and the N.Y. futures contract. We found a significant relationship between all the crudes studied and the N.Y. futures contract, with the exception of Bachaquero crude. The basis risk in using the N.Y. futures contract to hedge these crudes was found to be in the range of 3-26%, and the hedge ratio was found to be not significantly different from one. The results from hedging dollar oil expenditures instead of barrels (physical hedge) are quite similar. In summary, we recommend the use of N.Y. futures contracts to hedge crude oil imports (with the exception of Bachaquero crude), particularly th- lighter crudes, with a hedge ratio of one for all crudes. This recommendation holds for either futures or options based on the N.Y. futures contract.
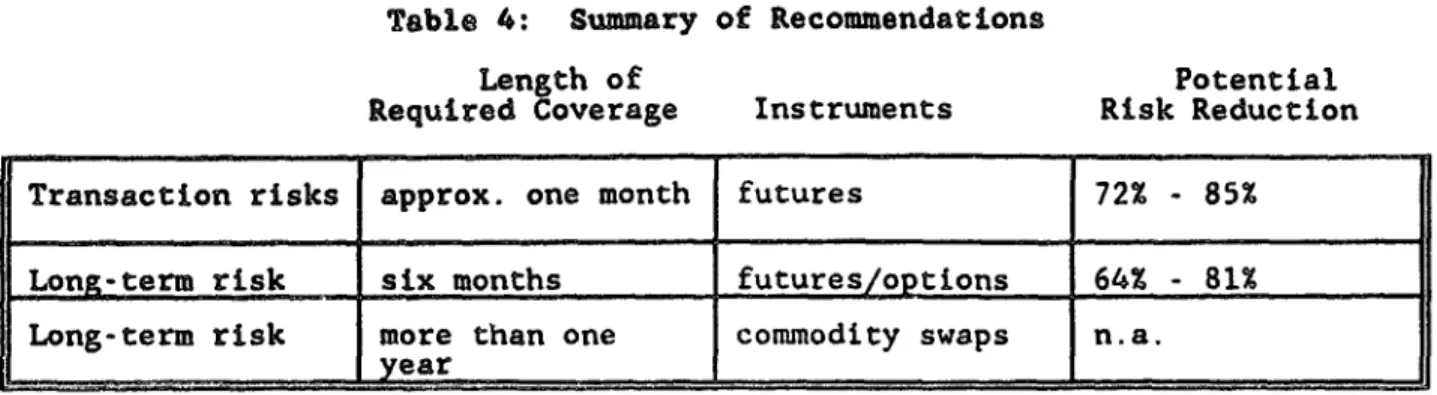
We also identified the risk exposures that a typical SOC faces. These are transactions risk, and long-term risk. Transactions risk refers to the risk from price fluctuations between ordering and shipping. Long-term risk refers to the exposure of the SOC and the national economy to longer-term trends in oil prices. Here longer term was taken to be a six-month planning horizon. Within such a period the SOC and the economy should be able to adjust smoothly to any shift in international oil prices. We recommend the use of futures and options to hedge both transactions and long-term risks. Table 4 summarizes our recommendations and major findings. If a six-month (approximate) hedge is undertaken, there is no need for additional hedging activity to cover the transactions risk.
Table 4: Summary of Recommendations
Length of Potential
Required Coverage Instruments Risk Reduction
Transaction risks approx. one month futures 72X - 85%
Long-term risk six months futures/options 64% - 81% Long-term risk more than one commodity swaps n.a.
_ _ _ ___
year.__
_ _ _ _ _ _ _ _ _ _ _In studying hedging of transactions risk we simulated a scenario where one-month exposures were hedged using the second nearby N.Y. futures contract. The potential gains from pursuing such a strategy are between 73% and 86% risk reduction for all crudes except Bachaquero. The hedging potential for Bachaquero is more limited; only about 60% risk reduction can be achieved.
For long-term risk we simulated a scenario in which the SOC buys at six-monthly intervals the six nearby futures corttracts, which it sells gradually throughout the following six-month period. We choose a six-month horizon since these futures are actively traded. The potential risk reduction gains from pursuing such a strategy are on the average about 70%. However, much less risk reduction can be achieved hedging Lagotreco and Bachaquero crude imports in this way (only about 35% to 54%). For hedging over longer periods we recommend oil
swaps as the best risk management tool.
Finally, we identified four constraints to the use of risk management techniques by SOCs. These are: (i) Cash Flow: the need for foreign funds to purchase futures, margin calls and option premiums; (ii) Negative Publicity: the possibility of criticism which could arise from the use futures. To counter this, options can be used, but at a price. Furthermore, it is advisable to distribute the responsibility for hedging across the government and spread knowledge about hedging and hedging instruments through education; (iii) Elexibility_of Action: where applicable, there is need for a close relationship between the SOC and the Central Bank to assure foreign exchange availability to
carry-out the risk management program; and (iv) Legal, Systm: where applicable, the legal restrictions that prevent SOCs from using futures and options and other financial instruments should be removed.
ANNEX 1L CONTBACI SPECIFICATIONS
Table, 1: CRUDRE OIL: OPTIONS CONTRAQ: SPECIFICATIONS
TP,ADITIUNI
One NYMEX crude oil futures contract. TRADNG HOU RS
9:45 a.m. - 3:10 p.m. (New York Time) ITRDING MONTS
Fifteen consecutive months. MINIMM PRICE; FLUCTUATION
$.01 (1 cent) per barrel ($10 per option contract). MAXIMUM DAILY LIMIT
None
LAST TRADING DbY_ (EXPIRATION DAY)
Second Friday of the month prior to the delivery month of the underlying crude oil futures contract, provided there are at least five days remaining to trade in the underlying futures contract.
SERCISE
By a Clearing Member to the NYMEX Clearing House not later than 6:00 p.m., or 45 minutes after the price of the option being exercised or the underlying futures settlement price is posted. Whichever is later, on any day up to and including the option's expiration.
2IKE PRICES
Strike prices are in increments of $1.00 per barrel. At all times at least eleven strike prices are available for puts and calls on the underlying futures contracts. The middle strike price is closest to the previous day's close of the underlying futures contract. Strike price boundaries are adjusted according to the futures price movements.
hfbl_2:
CONTRACT
SPECIFI
CATIONS CLRU-DE OIL)CONTRACT UNIT
1,000
U.S.
barrels
(42,000
gallons).
TRADING HOURS
9:45 a.m. - 3:10 p.m. (New York Time). TRADO
Trading presently is conducted in eighteen consecutive months commencing with the current calendar month (e.g., on October 6, 1989, trading occurs in all months
from November 1989 through April 1991) and some longer-dated contracts. PRICE OOTATiITON
In dollars and cents per barrel (e.g., $17.25 per barrel). MINIUM PRIC-E LUC-TUATIO
$.Ol (.01 cent) per barrel ($10 per contract).
MAXII~lM ILY IMtIT£
$1.00 (1 dollar) per barrel ($1,000 per contract). There is no maximum daily limit on price fluctuations during the month preceding the delivery month. EXPAELMI
In the event that a settlement price is established at the maximum daily limit on price fluctuations, this limit will be increased subject to a variable limits formula. The maxiw.m expanded limit is $2.00 per barrel.
DELIVERYAND GADES
F.O.B. seller's facility, Cushing, Oklahoma, at any pipeline or storage facility with pipeline access to Arco or Texaco. Par crude: West Texas Intermediate, 0.4% sulfur, 40% API gravity.
DELIVERY PERIOD
All deliveries must be initiated after the first calendar day and completed
before the last calendar day of the delivery month.
EXCHAGEL OFURES FOR.-OR IN CONNECTINWIH. PHYSICALL(KEFP)
The buyer or seller may exchange a futures position for a physical position of equal quantity by submitting a notice to the Exchange. EFPs may be used to either initiate or liquidate a futures position.
IAST TRAINg DAY
Trading terminates at the close of business on the third business day prior to the twenty-fifth calendar day of the month preceding the delivery month.
Original margin for an outright position: $2,000.
Original margin for an intermarket spread position: $1,000. Original margin for an intramarket spread position: $300.
AMNEX 2: E-STIMATION QO HEEDGE RATIOS 21
Assume that futures contracts exist for delivery at each month over the planning horizon. Currently, the New York Mercantile Exchange trades crude oil futures contracts maturing each month over an approximately 18-month horizon and some longer-dated contracts. Assume the SOC purchases futures for each maturity at the beginning of the planning horizon and holds them (without adjustment) until they are liquidated at the relevant maturity date. Further, assume that the futures markets are efficient, in the sense that the expected return from holding futures is zero.2 Under these assumptions, the SOC's cash surplus in period i can be written
Y, -
fXA
- PAQi (2.1) where:f- F1(i) - F0(i) is the difference between the futures price for
delivery in period i, F,(i), and the same futures contract quoted at the beginning of the planning horizon, F0(i);
- quantity of futures purchased (sold, if negative) at the beginning of the planning horizon for delivery at i; and
Pi - P0(i) - P*i is the difference between the actual oil price at i and that expected at the beginning of the planning horizon.
0 - Amount of oil imported (barrels).
The futures prices, quoted in US dollars, are converted to local currency using the exchange rate applicable when the transaction takes place. Notice that P*(i)
> P*. leads to a decline in the cash surplus but Fi(i) > FO(i) leads to an
increase.
With futures, the net cash surplus at the end of the planning horizon becomes: 2
Y -
SUM
(f1X
1 - PAQ)- (2.2)This cash surplus now has two random components, spot prices and future prices. The aim is to choose futures positions X; for every period to minimize the risk surrounding the net cash surplus.
The appropriate hedging ratio will depend on the relationship between spot and futures price movements. Suppose that there is a simple linear relationship between unexpected oil price shocks in the spot and futures markets:
pi - b,f1 (2.3)
where b; is a parameter that may change for different periods over the planning horizon and is therefore indexed with an i. Equation (2.3) shows that some proportion, b,, of any price sb kck in the futures market transfers into an unexpected change in the spot prLce.
'See Labuszewski and Myhoff (1988a and 1988b) for more details.
fThis assumption is for convenience and allows attention to focus
exclusively on the hedging characteristics of futures trading.
-40-Substituting (2.3) into (2.2) allows the net spot surplus to be expressed
Y SUM fi (XY - biQ1). (2.4)
If X; b1Qi for all i, then Y - 0. The appropriate hedge ratio is equal to b.
Thus we have the following result.
Result I With no quantity uncertainty and in the absence of basis risk, pi - bifi and a futures hedging rule, X; - b1Qi, ensures that the net
cash surplus is always zero. All risks surrounding the SOC's net
cash surplus have been eliminated via hedging with futures.
The problem with Result 1 is that it relies on a simple, deterministic linear relationship between spot and futures price shocks. Although spot and futures prices for oil obviously are closely related, we would not expect (2.3) to hold exactly at all times. Spot and futures prices may respond differently to the same piece of new information if it has different implications for current supply and/or demand versus future supply and/or demand. This uncertainty regarding the relationship between spot and futures prices leads to an examination of basis risk.
Assume that the relationship between spot and futures price shocks is subject to a random disturbance:
pi - b1fi + ui (2.5)
where u; is a zero mean serially uncorrelated disturbance term. The random vrariable u; represents that part of spot price shocks which cannot be predicted fully from observing movements in futures prices. It may occur as a result of exchange rate fluctuations or basis fluctuations (changing relationships between spot and futures prices).
Substituting (2.5) into (2.2) the net cash surplus becomes
Y SUM [ f(XY - b1Q1) - u1Qi] . (2.6)
Thus, the hedging rule X; b1Qi now results in a net cash surplus of:
Y - -SUM u1Q3. (2.7)
The only remaining source of risk with this hedging rule is fluctuations in u;. It can be shown that shocks to u, represent uninsurable residual risk (the basis risk' which cannot be hedged using oil futures only. Thus we have the following result. Like the case before, the appropriate hedge ratio is b.
Result 2 With no quantity uncertainty and in the presence of basis risk, pi
- bif; + u; and the futures hedging rule X; - bjQ, minimizes the risk surrounding the SOC's net cash surplus. Residual risk is uninsurable and cannot be reduced further using only the oil futures market.
Because part of the fluctuations in ui may be due to exchange rate movements, it is possible that the residual risk could be reduced further if a futures or forward foreign exchange market were available (Thompson and Bond, 1987). However, no formal futures or forward markets are available in the exchange rates for many