
econstor
Der Open-Access-Publikationsserver der ZBW – Leibniz-Informationszentrum Wirtschaft The Open Access Publication Server of the ZBW – Leibniz Information Centre for Economics
Nutzungsbedingungen:
Die ZBW räumt Ihnen als Nutzerin/Nutzer das unentgeltliche, räumlich unbeschränkte und zeitlich auf die Dauer des Schutzrechts beschränkte einfache Recht ein, das ausgewählte Werk im Rahmen der unter
→ http://www.econstor.eu/dspace/Nutzungsbedingungen nachzulesenden vollständigen Nutzungsbedingungen zu vervielfältigen, mit denen die Nutzerin/der Nutzer sich durch die erste Nutzung einverstanden erklärt.
Terms of use:
The ZBW grants you, the user, the non-exclusive right to use the selected work free of charge, territorially unrestricted and within the time limit of the term of the property rights according to the terms specified at
→ http://www.econstor.eu/dspace/Nutzungsbedingungen By the first use of the selected work the user agrees and declares to comply with these terms of use.
zbw
Leibniz-Informationszentrum Wirtschaft Leibniz Information Centre for EconomicsWolz, Axel; Buchenrieder, Gertrud; Markus, Richard
Working Paper
Renewable energy and its impact on agricultural and
rural development: Findings of a comparative study
in Central, Eastern and Southern EuropeRenewable
energy and its impact on agricultural and rural
development: Findings of a comparative study in
Central, Eastern and Southern Europe
Discussion paper // Leibniz Institute of Agricultural Development in Central and Eastern Europe, No. 130
Provided in cooperation with:
Leibniz Institute of Agricultural Development in Central and Eastern Europe (IAMO)
Suggested citation: Wolz, Axel; Buchenrieder, Gertrud; Markus, Richard (2010) : Renewable energy and its impact on agricultural and rural development: Findings of a comparative study in Central, Eastern and Southern Europe, Discussion paper // Leibniz Institute of Agricultural Development in Central and Eastern Europe, No. 130, urn:nbn:de:gbv:3:2-10852 , http:// hdl.handle.net/10419/45694
R
ENEWABLE ENERGY AND ITS IMPACT ON AGRICULTURAL AND RURAL DEVELOPMENT:
F
INDINGS OF A COMPARATIVE STUDY INC
ENTRAL,
E
ASTERN ANDS
OUTHERNE
UROPEAXEL WOLZ,GERTUD BUCHENRIEDER,RICHARD MARKUS
DISCUSSION PAPER NO.130
2010
DISCUSSION PAPER
Leibniz Institute of Agricultural Development in
Central and Eastern Europe
Theodor-Lieser-Straße 2, 06120 Halle (Saale), Germany Phone: +49-345-2928 110
Fax: +49-345-2928 199 E-mail: [email protected] Internet: http://www.iamo.de
Dr. Axel Wolz is senior research fellow at the Leibniz Institute of Agricultural Development in Central and Eastern Europe (IAMO), Division: External Environment for Agriculture and Policy Analysis, in Halle (Saale), Germany. His current work focuses on organisational and institutional change, the concept of social capital, cooperatives and renewable energy.
From January 2006 until March 2010, Dr. Gertrud Buchenrieder was the Head of the Department "External Environment for Agriculture and Policy Analysis" at the Leibniz Institute of Agricultural Development in Central and Eastern Europe (IAMO). She has moved on to the Martin-Luther-University Halle-Wittenberg, Institute for Agriculture and Food Science. Her research focus is international development theory and policy.
Richard Márkus is a PhD.-student at the University of West Hungary Faculty of Agricultural and Food Sciences, Institute of Business Economics and Management Sciences besides close collaboration with Feeding Department of the University, Mosonmagyaróvár, Hungary. The current research topic is the utilization of renewable energy as by-products (rapeseed cake, DDGS) for the sake of enhancing competitiveness in swine production
Address: Leibniz-Institute of Agricultural Development in Central and Eastern Europe (IAMO) Theodor-Lieser-Straße 2 06120 Halle (Saale) Germany Phone: ++49-345-2928-114 Fax: ++48-12-6624-199 E-mail: [email protected] Internet: http://www.iamo.de
Discussion Papers are interim reports on work of the Institute of Agricultural Development in Central
and Eastern Europe and have received only limited reviews. Views or opinions expressed in them do not necessarily represent those of IAMO. Comments are welcome and should be addressed directly to the author(s).
The series Discussion Papers is edited by:
Prof. Dr. Alfons Balmann (IAMO) Dr. Stefan Brosig (IAMO)
Prof. Dr. Gertrud Buchenrieder (IAMO) Prof. Dr. Thomas Glauben (IAMO) Dr. Daniel Müller (IAMO)
Prof. Dr. Heinrich Hockmann (IAMO) Dr. Martin Petrick (IAMO)
A
BSTRACTRising energy prices for fossil fuels, the unreliable supply of energy imports during the last winters and – concerning the 12 new members states (NMS) – the demand by the European Union (EU) for developing National Renewable Energy Action Plans have stimulated the national discussion and political action on renewable energy (RE) among all European countries. Particularly among the 12 NMS the share of RE has increased during the last years. Among the candidate and potential candidate countries (CC and PCC) the discussion on RE has just started. When looking at the impact of RE on agricultural and rural development the effects are relatively small. An expansion of rape seed cultivation and, to a smaller extent, of the production of wood pellets could be observed. But overall the impact of RE on agricultural and rural income and employment seems to be marginal up to now. Whether it will be so in the future, depends on national policies and support programme as none of the various types of RE is competitive to fossil fuels for the time being.
JEL: O52, Q10, Q28, Q42, R11
Кeywords: Renewable energy, comparative survey, agricultural and rural development, New members states of the EU, candidate and potential candidate countries.
Z
USAMMENFASSUNGDIE AUSWIRKUNGEN VON ERNEUERBAREN ENERGIEN AUF DIE LANDWIRTSCHAFTLICHE UND LÄNDLICHE ENTWICKLUNG –ERGEBNIS EINER VERGLEICHENDEN STUDIE IN MITTEL-,OST
-UND SÜDEUROPA
Die öffentliche Diskussion sowie die politischen Maßnahmen im Hinblick auf erneuerbare Energien haben im Laufe der vergangenen Jahre bei allen europäischen Staaten erheblich zugenommen. Die Gründe liegen bei den stetig steigenden Preisen für fossile Energieträger, den unzuverlässigen Lieferungen in den vergangenen Wintern sowie – besonders bei den 12 Neuen Mitgliedsstaaten (NMS) der Europäischen Union (EU) – die verbindliche Maßgabe, einen Nationalen Aktionsplan für Erneuerbare Energien zu entwickeln. Besonders innerhalb der 12 NMS hat der Anteil der erneuerbaren Energie am Gesamtenergieverbrauch zugenommen. Allerdings sind die Auswirkungen der erweiterten Nutzung von erneuerbaren Energien auf die landwirt-schaftliche und ländliche Entwicklung bis dato relativ gering. Lediglich eine Ausweitung des Rapsanbau sowie in einem geringerem Maße von Holzpellets war zu beobachten. Die Auswir-kungen auf Einkommen und Beschäftigung sind jedoch (noch) marginal. Inwieweit sich dies in der Zukunft ändern wird, hängt von den nationalen Politiken und Unterstützungsprogrammen ab, da bis jetzt keine Art der erneuerbaren Energien gegenüber den fossilen Brennstoffen konkurrenzfähig ist.
JEL: O52, Q10, Q28, Q42, R11
Schlüsselwörter: Erneuerbare Energien, vergleichende Analyse, landwirtschaftliche und länd-liche Entwicklung, Neue Mitgliedsstaaten sowie (potenzielle) Beitrittsländer der EU.
T
ABLE OF CONTENTS Abstract ... 3 Zusammenfassung ... 3 List of abbreviations ... 6 Acknowledgements... 7 1 Introduction ... 92 Overview of the use and relevance of renewable energy ... 9
2.1 Relevance of renewable energy in national energy supply... 12
2.2 Role of renewable energy in specific subsectors... 14
2.2.1 Production and share in national electricity supply ... 14
2.2.2 Production and share in national heating... 16
2.2.3 Production and share in national transport ... 17
3 Overview of the sources of renewable energy... 18
3.1 Organic sources... 19
3.1.1 Wood and wood waste... 19
3.1.2 Biogas ... 21
3.1.3 Municipal solid waste ... 22
3.1.4 Biofuel ... 22 3.2 Inorganic sources... 24 3.2.1 Hydro-energy... 24 3.2.2 Wind energy... 26 3.2.3 Solar energy ... 27 3.2.4 Geothermal energy... 28
4 National policies and concepts promoting renewable energy ... 29
4.1 National policies... 29
4.2 National concepts and programmes... 32
5 Impact of the promotion of renewable energy... 33
5.1 Impact on the agricultural and forestry sectors... 33
5.2 Impact on rural development... 37
6 Conclusions and policy recommendations ... 38
6.1 Concluding observations... 38
6.2 Policy recommendations... 40
References ... 40
L
IST OF ABBREVIATIONS ALB ALBANIABIH; B&H BOSNIA & HERZEGOVINA BUL BULGARIA
CC CANDIDATE COUNTRIES
CRO CROATIA CYP CYPRUS
CZE CZECH REPUBLIC
ECT ENERGY CHARTER TREATY EST ESTONIA
EU EUROPEAN UNION
GHG GREEN HOUSE GAS
HPP HYDROPOWER PLANTS
HUN HUNGARY
IRENA INTERNATIONAL RENEWABLE ENERGY AGENCY
KCAL KILO CALORIE
KOS KOSOVO KWH KILOWATT HOUR LTU LITHUANIA LVA LATVIA MAC MACEDONIA MLT MALTA MON MONTENEGRO MW MEGAWATT NMS NEW MEMBER STATES
PCC POTENTIAL CANDIDATE COUNTRIES POL POLAND RE RENEWABLE ENERGY ROM ROMANIA SER SERBIA SVK SLOVAKIA SVN SLOVENIA T TON(S)
TOE TONS OF OIL EQUIVALENT TUR TURKEY
A
CKNOWLEDGEMENTSThis paper is based on 20 country reports that form part of the results of a project called "Enlargement Network for Agricultural Policy Analysis" (acronym: AgriPolicy) which receives financial support from the European Commission’s 7th Framework Program. Participants are from all NMS, CC and PCC, UK, Germany, France and the Netherlands. It lasted from June 2008 to May 2010. See www.agripolicy.net for all 20 country reports, which have been drafted by national experts. The author gratefully acknowledges the contribution of the national experts: Aheron Homzo and Robert Cela, independent experts (Albania); Aleksandra Nikolic, Sabahudin Bajramović and Draguna Ognjenović, University of Sarajevo (Bosnia-Herzegovina); Ivanov Bozhidar, University of Ploviv and Rumen Popow, Institute of Agricultural Economics, Sofia (Bulgaria); Marija Cerjak, University of Zagreb (Croatia); Theodoros Ioannou and Doros Theocharides, CTS (Cyprus); Jiri Weichet, VUZE (Czech Republic); Mati Sepp, Estonian University of Life Sciences (Estonia); Dragi Dimitrievski and Ana Kostevska, University St Cyril and Methodius (FYROM); Tibor Firenczi, Csaba Forgacs and Tamas Mizik, Corvinus University of Budapest (Hungary); Menderes Ibra, independent expert (Kosovo); Agnese Krieviņa, Latvian State Institute of Agrarian Economics (Latvia); Ovidija Eicaite and Albertas Gapsys, Lithuanian Institute of Agrarian Economics (Lithuania); Sonya Sammut, independent expert (Malta); Milan Markovic, Bozidarka Markovic, Milosav Andjelic and Jelena Knezevic, University of Montenegro (Montenegro); Zbigniew Florianczyk, Anna Wasilewska, Grzegorz Kunikowski and Piotr Gradziuk, IERIGZ (Poland); Pete Istvan and Tamas Ervin, Babes Bolyai University Cluj-Napoca (Romania); Aleksandar Bogunovic and Natalija Bogdanov, University of Belgrade (Serbia); Ivan Masár, VUEPP (Slovakia); Matej Bederač and Tamaz Cunder, University of Ljubljana, (Slovenia); Dilek Bostan Budak, Cukurova University (Turkey). The country reports’ summaries and interpretations are solely the responsibility of the authors.
1
I
NTRODUCTIONThis report summarises the findings of 20 country case studies on renewable energy (RE) and its impact on rural development. The countries are the 10 new member states (NMS-10)1 that joined the European Union (EU) in May 2004, Bulgaria and Romania, which became member in January 2007, and 3 Candidate2 and 5 Potential Candidate Countries3 (CC and PCC). The CC and PCC aspire to join the EU as and when their political and economic development meets the EU membership criteria.
This report is a synthesis of the 20 background country reports. It emphasizes comparison of national strategies with regard to RE, structures and a summary of main conclusions. Yet, the issue of RE in many of these countries only recently has become a political issue. Rising energy prices for fossil fuels, the unreliable supply of energy imports during the last two winters4 and – concerning the 12 NMS – the agreement by the EU member states for developing National Renewable Energy Action Plans (NREAP) by 30 June 2010 have stimulated the national discussion on RE. Due to historical and economic reasons but also natural conditions, the importance and focus on specific types on RE have been quite different among the countries in the region. When required this diversity is indicated in the report. Yet, further details of specific country situations shall be found in the background reports.
The structure of the synthesis report is as follows. Section 2 provides an overview of the present situation. In the Chapter 3, the major organic and inorganic sources of RE are discussed in more detail. In Chapter 4 the national policies and concepts promoting RE will be analysed. In Chapter 5 it will be assessed whether RE has an impact on the agricultural sector in particular and rural development in general. The analysis concludes in providing the major comparative conclusions, including some key policy recommendations.
2
O
VERVIEW OF THE USE AND RELEVANCE OF RENEWABLE ENERGYSince early mankind people have relied on RE for their living. People made use of wood and, later on, of wind and water. However, the interest in RE started more seriously when the limits of fossil and nuclear energy became evident. In our analysis we follow the definition of EUROSTAT which defines RE as follows: Renewable energies (RE) cover hydropower, wind energy, solar energy, biomass and wastes and geothermal energy. RE is the sum of these specific forms of energies. Biomass and wastes cover organic, non-fossil material of biological origin, which may be used for heat production or electricity generation. They comprise wood and wood waste, biogas, municipal solid waste and biofuels. Liquid biofuels mainly cover bioethanol (ethanol produced from biomass) and biodiesel (diesel produced from biomass or used fried oil). Hydropower covers potential and kinetic
1 These are Bulgaria, Cyprus, Czech Republic, Estonia, Hungary, Latvia, Lithuania, Malta, Poland, Romania,
Slovakia, and Slovenia.
2 The CC are Croatia, Macedonia and Turkey.
3 The PCC are Albania, Bosnia-Herzegovina, Montenegro, Serbia, and Kosovo (although the official status
of Kosovo is still open).
4 Think for instance the gas disputes between Russia and the Ukraine, which culminated on 1 January 2006
when Russia cut off gas supplies passing through Ukrainian territory. Another dispute arose in October 2007 over Ukrainian gas debts and culminated in the gas supplies reduction in March 2008. http://en.wikipedia.org/ wiki/Russia%E2%80%93Ukraine_gas_disputes - cite_note-bbc240106-3
energy of water converted into electricity in hydroelectric plants.5 In our analysis we will distinguish – whenever possible – between more "traditional" forms of RE, like firewood and large hydropower plants and more "modern" forms of RE, like the use of wood pellets and briquettes, biogas and biofuels, wind, solar and small (micro) hydropower plants. While some of these "modern" forms were studied some decades ago already, they became popular during the 1990s and particularly since the turn of the millennium. The measurement of energy is still confusing. While the international community agreed already during the late 1960s that "Joule" should be the only accepted indicator for energy, quite a number of other energy measurement indicators are still in use, like e.g. TOE (tons of oil equivalents), kcal (kilo calorie) or KWh (kilo watt hour). Hence, it is no surprise that the 20 country reports were using different types of measuring units. EUROSTAT uses in their tables on national energy production and demand TOE. For better comparison we converted the measuring units given in the country reports into one uniform unit.
As it becomes evident in this synthesis report, there is a lack of available data with respect to RE. For better comparison we relied first on EUROSTAT data, which cover the NMS-12 as well as Croatia and Turkey. However, EUOSTAT data are not always totally consistent with the information provided by the country reports. As these data have been approved by the national authorities, they have been preferred to the ones in the country reports when applicable. In case there had not been any EUROSTAT data available we made use of the (often scarce) information given in the respective country reports.
In the synthesis report, the data on RE is differentiated along the NMS on the one side and the three CC and five PCC on the other. Annex 1 provides a summary table for each country showing the supply and share of RE in total energy demand.
2.1 Relevance of renewable energy in national energy supply
The use of RE in the various countries in total energy demand in 2007 is quite different (Table 1). Among the NMS there are Malta and Cyprus with a very small share on the one side, and Latvia with more of one third of total energy demand on the other. All the other countries rely on RE to some extent ranging from Bulgaria with a share of 4.9% and Estonia with a share of 12.4%. Hence the reliance on fossil fuels and nuclear energy is quite high. With respect to CC/PCC, the picture looks quite different. For three countries, namely Bosnia & Herzegovina, Montenegro and Albania the share of RE comes up to one fourth or, even, one third of total energy demand. With respect to the other five countries the share comes up to 7% and 10.7%. Hence, based on these comparative data a first conclusion can be drawn: RE has a certain share in total energy demand, but in most countries it is not yet very important. In addition, RE is more important in the CC/PCC than in the NMS.
5 Eurostat: The Eurostat Concepts and Definitions Database
Table 1: Share of renewable energy in total energy demand (%), 2007
NMS CC/PCC
Important: > 10% LVA (37.7), EST (12.4), ROM (11.8) BIH (32.5), MON* (25.0), ALB (24.2), KOS (10.7) Somewhat: 5-10% SVN (9.9), LTU (8.9), SVK (5.4), CZE (5.2), HUN (5.2), POL (5.1) TUR (9.5), SER (8.3), MAC** (8.1), CRO (7.9),
Modest: < 5% BUL (4.9), CYP (2.4), MLT (0.2)
Source: EUROSTAT and Country Reports 2009. Notes: * 2006; ** 2005.
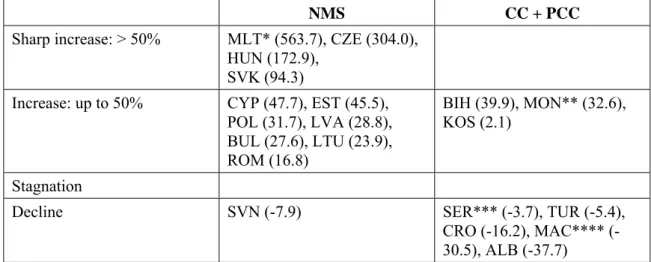
Although the share of RE in the country cases is still relatively modest, it is important to see how the supply of RE has changed during the 2000-2007 period. This perspective changes the picture. First we will look at how the supply of RE changed absolutely (Table 2) and, then, how it changed relatively (Table 3). When looking at the absolute increase in energy from RE sources, all NMS with the exception of Slovenia have increased their supply. In Slovenia, the supply of RE even declined. In the majority of countries the supply of RE increased modestly. In Romania the supply of RE increased by 16.8% and in Cyprus by 47.7% over the period. A group of four countries raised their supply of RE by almost 100% or even more. However, with respect to Malta (+ 563.7%), it has to be kept in mind that this country is starting from a very low basis.
Table 2: Change in overall production of renewable energy (%), 2000-2007
NMS CC + PCC
Sharp increase: > 50% MLT* (563.7), CZE (304.0), HUN (172.9),
SVK (94.3)
Increase: up to 50% CYP (47.7), EST (45.5), POL (31.7), LVA (28.8), BUL (27.6), LTU (23.9), ROM (16.8) BIH (39.9), MON** (32.6), KOS (2.1) Stagnation
Decline SVN (-7.9) SER*** (-3.7), TUR (-5.4), CRO 16.2), MAC**** (-30.5), ALB (-37.7) Source: EUROSTAT and Country Reports 2009.
Notes: * 2003-2007; ** 2000-2006; *** 2002-2007; **** 2000-2005.
When looking at the CC/PCC the picture is not that favourable anymore. Among more than half of them the supply of RE declined and with respect to Croatia, Macedonia and Albania very significantly. In Kosovo the supply of RE almost stagnated over this period, while in B&H and Montenegro the supply increased by about the same share as in most NMS.
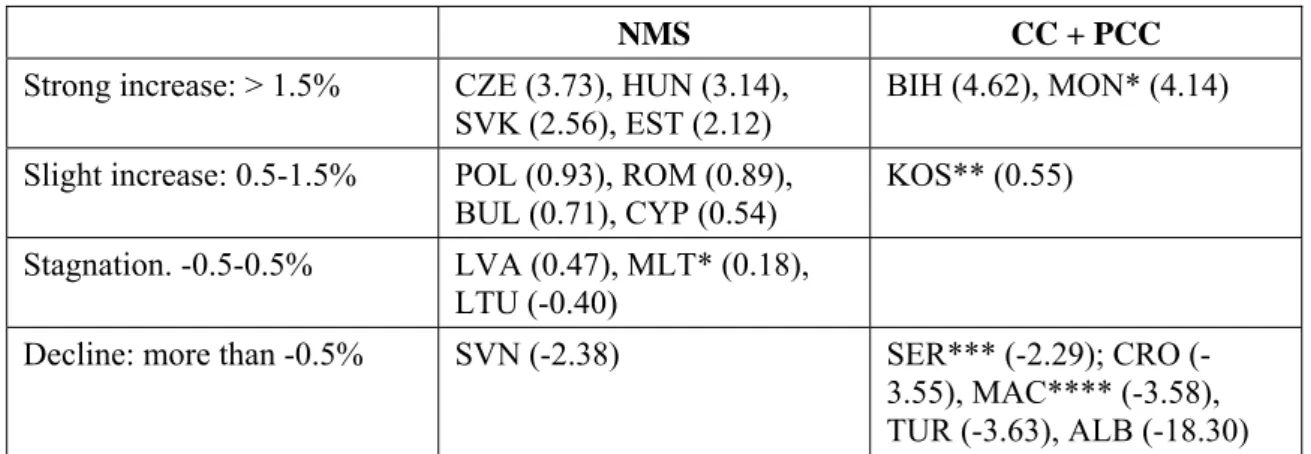
However, changes in the absolute supply of RE will not necessarily lead to higher shares in total energy demand. Due to economic development the total energy demand in all NMS and CC/PCC increased as well although with different growth rates. Whether the change in absolute supply of RE translates into an increase in the share of RE in total energy demand during the period of 2000-2007 is shown in Table 3.
Table 3: Change of the share of renewable energy in total energy demand, 2000-2007
NMS CC + PCC
Strong increase: > 1.5% CZE (3.73), HUN (3.14), SVK (2.56), EST (2.12)
BIH (4.62), MON* (4.14)
Slight increase: 0.5-1.5% POL (0.93), ROM (0.89), BUL (0.71), CYP (0.54)
KOS** (0.55)
Stagnation. -0.5-0.5% LVA (0.47), MLT* (0.18), LTU (-0.40)
Decline: more than -0.5% SVN (-2.38) SER*** 2.29); CRO (-3.55), MAC**** (-3.58), TUR (-3.63), ALB (-18.30) Source: EUROSTAT and Country Reports 2009.
Notes: * 2000-2006; ** 2003-2007; *** 2002-2007; **** 2000-2005.
A change of 1% means a respective increase of the share in the total energy demand, e.g. from 10% (2000) to 11% (2007).
Concerning the changes in the share of RE in total energy demand, the situation among the NMS is quite diverse. On the one side, there is a group of countries which managed to come up with a quite strong increase, e.g. Czech Republic by 3.7 percentage points from 1.5% to 5.2% or Hungary by 3.1 percentage points from 2.1% to 5.2%. On the other side, there are two countries in which the share of RE actually declined; in Lithuania quite modestly by -0.4% percentage points from 9.3% to 8.9% while in Slovenia quite sharply by -2.4 percentage points (from 12.3% to 9.9%). In most NMS, the share of RE in total energy demand increased modestly, i.e. less than one percent point, from 0.2 in Malta to 0.9 in Poland. In this way, it can be concluded that almost all NMS show an increase of the share of RE in total energy demand which might reflect the fact that since they started the EU accession negotiations, RE had become a political issue.
Concerning the CC/PCC the situation is even more polarised. B&H and Montenegro show a very strong increase of more four percentage points, i.e. from 27.8% to 32.4% in B&H and from 20.8% to 24.9% in Montenegro. While Kosovo shows a slight increase in their share of RE, half of the countries show a very strong decline. Particularly, Albania shows a very steep decline of the share of RE in total energy demand: While it stood at 42.5% in 2000, it just makes up 24.2% in 2007. One of reasons – as will be discussed below – is the high dependence of most CC/PCC on hydropower whose supply fluctuates strongly due to changing annual rainfall patterns. In addition, among most CC/PCC the political discussion about "modern" types of RE has just started. Summarising, the findings show that among CC/PCC, contrary to NMS, no clear trend can be deduced.
2.2 Role of renewable energy in specific subsectors
After having discussed the role of RE in total energy demand, in general, now it will be looked at its relevance with respect to the three major forms of energy demand, i.e. electricity, heating and transport.
2.2.1 Production and share in national electricity supply
The use of RE for electricity has a long tradition. Where natural conditions are suitable, dams have been constructed and hydropower has been used. In these days, other sources of RE might be applied as well. The overall situation showing the share of RE in total electricity demand is summarised in Table 4.
Table 4: Share of renewable energy in total electricity demand (%), 2007
NMS CC/PCC
Important: > 10% LVA (36.4), ROM (26.9), SVN (22.1),
MON* (77.3), BIH (63.6), ALB (52,2), SER* (39,7), CRO (25.0), MAC** (22.0), TUR (19.0)
Somewhat: 3-10% BUL (7.6), SVK (5.2), HUN (5.1), CZE (4.7), LTU (4.6), POL (3.4)
Modest: < 3% EST (1.4), MLT (0.2), CYP (0.01)
KOS (0.9)
Source: EUROSTAT and Country Reports 2009. Note: * 2006; ** 2005.
Again, among the NMS the picture is quite heterogeneous. While RE plays an important role in Latvia, Romania and Slovenia, it plays almost no role at all in Estonia, Malta and Cyprus. Concerning the other NMS the share of RE is rather modest. With respect to CC/PCC, RE plays a much more important role. In Montenegro, Bosnia and Herzegovina and Albania, RE provides more than half of the total electricity demand. Among Serbia, Croatia, Macedonia and Turkey its share is highly significant. The exception among CC/PCC is Kosovo, where RE is almost irrelevant up to now. How the share of RE in total electricity demand changed during the period 2000-2007 is shown in Table 5.
Table 5: Change of the share of renewable energy in total electricity demand, 2000-2007
NMS CC + PCC
Strong increase: > 1.5 ROM (6.1), HUN (3.9), SVK (3.6), POL (1.8), CZE* (1.8)
MAC*** (2.0)
Slight increase: 0.5-1.5 LTU (1.2), EST (0.9) Stagnation. -0.5-0.5 BUL (0.3), MLT** (0.2),
CYP (0.0)
BIH (-0.4),
Decline: more than -0.5 SVN (-9.6), LVA (-11.3) KOS**** (-1.3), SER (-1.4), TUR (-5.9), CRO (-16.8), ALB (-22.3)
Source: EUROSTAT and Country Reports 2009.
Note: * 2003-2007, ** 2000-2006, *** 2000-2005, **** 2005-2007; MON: No data.
A change of 1% means a respective increase of the share in the total electricity demand, e.g. from 10% (2000) to 11% (2007).
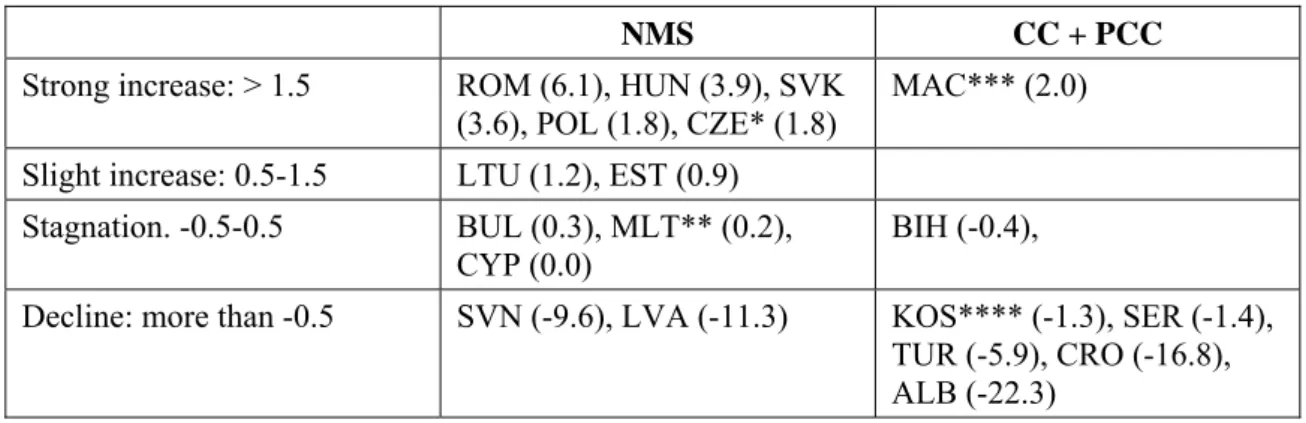
When looking at the changing shares of RE in total electricity demand among the 20 countries, the findings reflect the results from the changing shares of RE in total energy demand. Again most NMS show an increase of the share of RE while most CC/PCC show a decline. Romania recorded an increase by 6.1 percentage points. Slovenia and Latvia show a sharp decline over this period. The reason for both countries is similar as they observed a sharp increase in total electricity demand while the supply of RE stagnated (Latvia) or even declined a bit (Slovenia). In most of the CC/PCC there has been high fluctuations of the share of RE in total electricity demand during the last years. Nevertheless, a trend becomes obvious: While the demand in electricity is increasing, the supply of RE is steadily declining. In general, these countries are highly dependent on hydro energy in national electricity supply. The reason for the high fluctuations is the
annually changing water supply; the reason for the gradual decline is the fact that reinvestments and modernisation of the existing (large) hydropower plants are lacking. But it shows that most CC/PCC have a large potential in expanding the share of RE in electricity demand.
2.2.2 Production and share in national heating
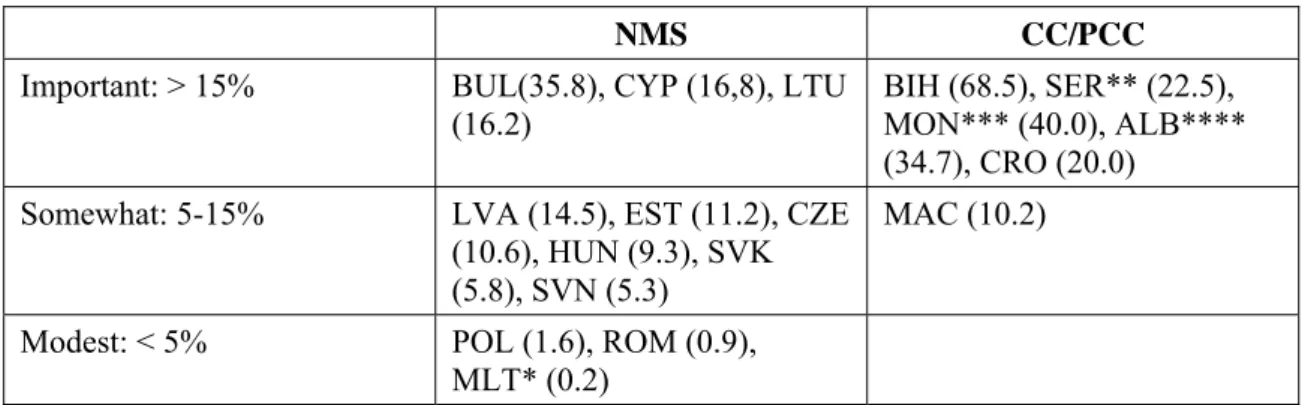
The use of fire wood for heating and cooking is closely connected with economic development and traditions. Still in these days the use of (fire) wood is a very important source of heating in the countries of the region. When looking at the figures below, it has to be kept in mind that particularly rural households make use of firewood, which is normally not statistically recorded. Hence, it can be assumed that the share of RE in heating is larger than the figures given. Nevertheless, Table 6 provides an overview of the relevance of RE in heating among the 20 countries.
Table 6: Share of renewable energy in total heating demand (%), 2007
NMS CC/PCC
Important: > 15% BUL(35.8), CYP (16,8), LTU (16.2)
BIH (68.5), SER** (22.5), MON*** (40.0), ALB**** (34.7), CRO (20.0)
Somewhat: 5-15% LVA (14.5), EST (11.2), CZE (10.6), HUN (9.3), SVK (5.8), SVN (5.3)
MAC (10.2)
Modest: < 5% POL (1.6), ROM (0.9), MLT* (0.2)
Source: EUROSTAT and Country Reports 2009.
Notes: * 2006; ** estimate; *** 2005; **** 2003; TUR, KOS: No data.
Again, there is broad variation among the NMS. While the share of RE in heating is negligible in Poland, Romania and Malta, it comes up to more than one third in Bulgaria and to about one sixth in Cyprus and Lithuania. Among the remaining countries the share of RE in heating is of a certain relevance coming up to 5.3% in Slovenia up to 14.5% in Latvia. In all countries the by far largest source of RE is wood, wood waste and other forms of biomass of wood (cellulose). The other sources of RE play no or a minor role: The exceptions are Malta which completely relies on solar energy (however the overall share of RE is very small), Cyprus where solar energy contributes about 90% of the RE, and Hungary where geothermal energy contributes about 10% of RE. In Estonia, heating with peat is of some relevance although this source of energy is not grouped as RE due to its very high GHG emissions. All other sources of RE still play a minor role in supplying heat energy.
All CC/PCC rely on wood as the major source of RE in heating. However, in B&H and Montenegro hydropower is relatively important too, which contributes about 20% of RE in heating. The reason is that national electricity prices are rather low so that people heat by using electricity. The predominant source of RE for electricity in these countries is hydropower.
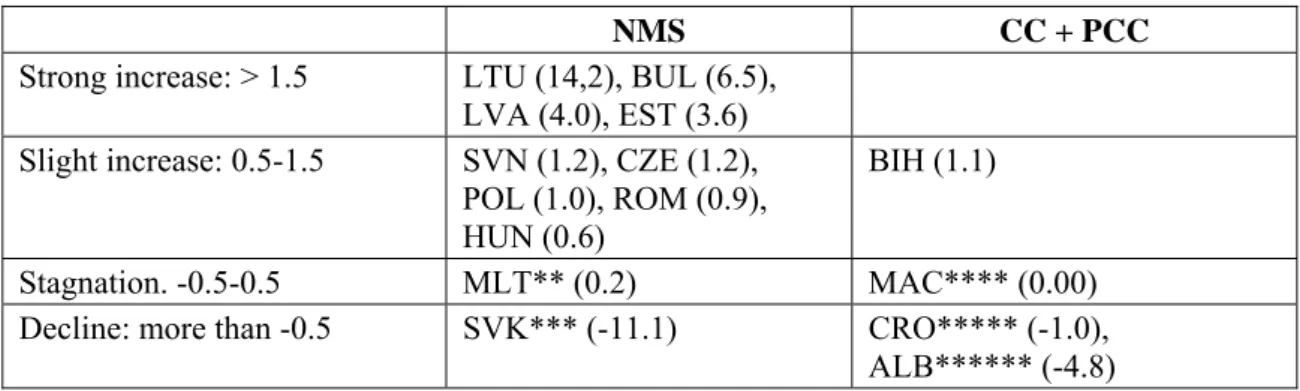
Table 7: Change of the share of renewable energy in total heating demand, 2000-2007
NMS CC + PCC
Strong increase: > 1.5 LTU (14,2), BUL (6.5), LVA (4.0), EST (3.6) Slight increase: 0.5-1.5 SVN (1.2), CZE (1.2),
POL (1.0), ROM (0.9), HUN (0.6)
BIH (1.1)
Stagnation. -0.5-0.5 MLT** (0.2) MAC**** (0.00) Decline: more than -0.5 SVK*** (-11.1) CRO***** (-1.0),
ALB****** (-4.8) Source: EUROSTAT and Country Reports 2009.
Note: * 2005-2006, ** 2001-2007, *** 2000-2006 **** 2000-2005, ***** 2004-2007, ****** 2000- 2003; no data: CYP, TUR, SER, MON, KOS.
A change of 1% means a respective increase of the share in the total heating demand, e.g. from 10% (2000) to 11% (2007).
When looking how the share of RE in heating changed during the period 2000-2007, it becomes evident that most NMS increased the share of RE in heating (Table 7). Most NMS recorded a slight increase of up to 1.2 percentage points. Four countries managed to increase the share of RE significantly, i.e. more than 3.5 percentage points. Lithuania had been most successful in increasing its share from 2.0% (2000) to 16.2% (2007). This increase is particularly worth emphasising as overall demand in heat energy increased by about 30% during this period. No reason had been given. The only decline of the share of RE in heating had been observed in Slovakia. Here, the share of RE in heating declined from 16.9% (2001) to 5.8% (2007). Unfortunately, also in this case no reason had been given. Due to lack of data no clear trend can be deduced for CC/PCC. The only conclusion which can be drawn is the fact that, while the share of RE among these countries is generally quite high, it did not change much during the last years. Only in Albania there had been a sharper decline from 39.5% (2000) to 34.7% (2003), where the major reason seems to be annual fluctuations of precipitation since not many data for the last few years are available.
2.2.3 Production and share in national transport
Most NMS started only recently with the introduction and promotion of biofuel. Most of them started in 2004/2005 with the production of biofuels. Joining the EU put this issue for most of them on the agenda. But as shown in Table 8, the share of RE in national transport is still quite low. In general, the emphasis is on biodiesel while bioethanol production and blending is lacking behind. Since most countries adopted a policy of mandatory blending in diesel and patrol, the share of biofuel will increase over the coming years.
Table 8: Share of renewable energy in total fuel demand (%), 2007
NMS CC/PCC
Important: > 2% LTU (3.0), CZE (2.4) – Somewhat: 1-2% CYP (1.8), MLT (1.1),
SVN (1.0)
–
Modest: < 1% HUN (0.9), POL (0.7), EST (0.2), LVA (0.1), SVK (0.1), BUL (0.1)
CRO (0.2), SER (0.2), TUR (0.2),
No biofuel ROM MAC, BIH, MON, KOS, ALB Source: EUROSTAT and Country Reports 2009.
When looking at CC/PCC, most of them are just starting to discuss this issue politically. Three countries have a small share of biofuel, which is biodiesel. There is no bioethanol production. So far, there are no blending requirements among these countries. There is no mentioning that Macedonia is producing any biofuel, but it is reported that 56 petrol station in the country offer biodiesel.
3
O
VERVIEW OF THE SOURCES OF RENEWABLE ENERGYAbove, it had been looked at the relevance of RE in total energy, electricity, heat and transport fuel demand and the sources of RE have been just touched briefly. In this chapter it will be analysed what sources of RE are predominant in the various countries. For a better comparison we distinguish between organic and inorganic sources of RE. In addition, we will distinguish again between "traditional" and "modern" sources as far as available data permit, as mentioned above. At a first glance it is remarkable that in most of the 20 countries under review just two sources of RE dominate and make up 90% and even more of total RE supply (Annex 2a and 2b): These two sources are (fire) wood on the one side and hydro-energy on the other. The only exceptions are Cyprus where solar energy is by far the most important source of RE, Malta, where solar energy and biofuel are the only two sources (although on a very low absolute level), Hungary where energy from municipal solid waste and geothermal energy are of some relevance and, finally, Turkey where geothermal and solar energy contribute significantly to total RE.
The findings of country reports reveal that the sources of RE are not equally relevant in all countries. As indicated above, wood and wood waste as well as hydroenergy are the most popular ones. In all NMS, with the exception of Malta, wood and wood waste are a source of RE (Annex 2a). With exception of Malta and Cyprus, all NMS rely at least to some extent on hydroenergy although its share in Estonia and Hungary is also quite modest. In 10 NMS biofuel production has been taken up (but not in Estonia and Cyprus, so far). In eight NMS (not in Malta, Cyprus, Bulgaria and Romania) biogas production has been started, but just in Czech Republic it is of some importance. Similarly, wind energy is produced in eight NMS (not in Slovenia, Malta, Cyprus and Romania), but this source is just contributing little to RE in the respective countries. In six NMS geothermal energy is processed as RE, but just in Hungary and Bulgaria it is of some relevance. Just four NMS make use of municipal solid waste, in general in form of biogas, which is of some importance in Hungary, Czech Republic and Slovakia. Similarly four NMS are making use of solar energy. As discussed above this source of RE is the major source in Cyprus and Malta, but of marginal importance in Czech Republic and Hungary.
Both CC and PCC are much more specialised in the sources of RE (Annex 2b). All of them rely on wood and wood waste as well as on hydroenergy. Solar energy is being produced in four of them, but just in Turkey this source of RE is of significance. Three countries make use of geothermal energy. Particularly Turkey and, to a smaller degree, Macedonia rely on it. Biofuel is produced by three countries, but in all of them the volume of production is still relatively small. Biogas and wind energy are just being produced by two countries of this group, only, i.e. Turkey and Croatia. So far, no country of this group has started to collect energy of municipal solid waste.
When looking at the spread of the various sources of RE which are used in the various NMS, only Hungary is relying on all major types of RE. Poland, Czech Republic and Slovakia are also well diversified; they rely on all sources except one, i.e. POL and SVK no solar energy and CZE no geothermal energy. On the other side, Malta and Cyprus seem to focus (or specialise) on just two different sources of RE. Whether this might
reflect a comparative cost advantage is open, since these two countries, like most NMS, want to make use of various sources of RE in the future. In comparison, CC/PCC are much more specialised in their sources of RE. The only exceptions are Turkey and Croatia. In general, these countries have just started to analyse their potential of the various forms of RE. Only in Serbia there had been some trials during the Balkan War, but given up later on. After having shown the importance of the various sources of RE, these sources will be discussed in more detail below.
3.1 Organic sources
Based on EUROSTAT statistics the organic sources of RE are made up by wood and wood waste, biogas, municipal solid waste (which is in general used as biogas) and biofuel. The last three groups are also characterised as "modern" types of RE. Within the group of wood and wood waste we will distinguish – whenever available data permits – between "traditional" types of RE, like fire wood and "modern" types, like pellets, briquettes and cellulose.
3.1.1 Wood and wood waste
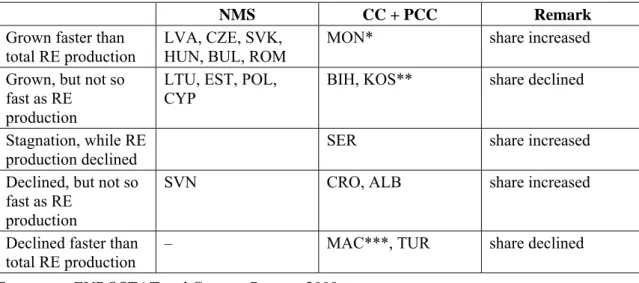
As shown above (see also Annex 2), wood and wood waste are the most important sources of RE in almost all analysed countries, with the exception of Malta and Cyprus among the NMS and Montenegro, Serbia and Albania among the CC/PCC. As discussed above (Chapter 2.2.2) the use of wood and wood waste particularly in rural areas seems to be underreported or very difficult to register statistically. Hence, it is safe to assume that the use and the share of wood and wood waste in RE are much larger. When looking at NMS, a clear pattern becomes obvious (Table 9): With the exception of Slovenia, all of them expanded their use of wood energy during the last years. Half of the NMS even showed a higher increase in the use of wood energy than in total RE. Among these countries wood as a source of RE is becoming more and more popular. Particularly, the development of three Central European countries has to be stressed, i.e. Czech Republic, Hungary and Slovakia, as these countries showed a strong increase of the overall share of RE in total energy demand (Table 3). In Slovenia, the use of wood energy declined during the last years, but not that much as the overall supply of RE. Hence, its share of RE increased.
Table 9: Changes in the production of renewable energy from wood and wood waste in relation to Total RE Production, 2000-2007
NMS CC + PCC Remark
Grown faster than total RE production
LVA, CZE, SVK, HUN, BUL, ROM
MON* share increased
Grown, but not so fast as RE
production
LTU, EST, POL, CYP
BIH, KOS** share declined
Stagnation, while RE production declined
SER share increased
Declined, but not so fast as RE
production
SVN CRO, ALB share increased
Declined faster than total RE production
– MAC***, TUR share declined
Source: EUROSTAT and Country Reports 2009.
Again, the development among CC/PCC is more diversified than among NMS. In four countries the use of wood energy increased, but just in Montenegro the use of wood energy increased stronger than the total supply of RE. The path of this country is in line with the one of the Czech Republic. In Bosnia & Herzegovina and Kosovo growth in the use of wood energy had been recorded, but its growth had not been that strong like the one of other sources of RE, hence its share declined. In Serbia the use of wood energy stagnated during the last years, while overall RE production declined. Hence, its share increased. In Croatia and Albania the use of wood energy declined, but not so much than the one of other sources. In these two countries, the share of wood energy actually increased during the last years. In Macedonia and Turkey a strong decline of wood energy had been observed, which was faster than of other sources. So, the share of wood energy declined during the last years. When looking in more detail about modern forms of wood energy production and use, the information available is rather scarce. The information given in the country reports is summarised in the following Table 10:
Table 10: Change in the production of wood pellets/briquettes in NMS and CC/PCC, 2000-2007 (tons) 2000 2007 NMS Lithuania 270,000 547,000 Latvia 287,000* 461,000 Estonia 377,000** Poland 20,000*** 350,000 Czech Republic 20,900* 102,000 Slovakia 68,000 CC/PCC Croatia ≤2,000 41,000
Bosnia & Herzegovina 3,200* 22,000
Macedonia just started
Serbia just started
Source: Country Reports 2009.
Note: * 2005, ** 2006, *** 2003; HUN, SVN, CYP, TUR: no information; MLT, BUL, ROM, MON, KOS, ALB: No production
A few countries reported that there is no pellet or briquette production from wood and wood waste. The major reasons seem to be that either there is no wood available (e.g. Malta), or no investments in this source of RE had been performed due to high costs, so far (e.g. Bulgaria, Romania, Montenegro, Kosovo and Albania). In a number of country reports no information had been given, hence it is not known whether there is any pellet/briquette production at all. Just Macedonia and Serbia report that pellet production had been taken up recently, but no figures had been given. Only a few countries provided some figures. But they show that pellet and briquette production are rapidly increasing. Particularly, entrepreneurs in the Baltic States and some Central European countries are investing in this source of RE. However, when producing wood pellets/briquettes, it does not necessarily mean than these "modern" forms of RE are used in the respective countries. Particularly, the Baltic States as well as Croatia and Serbia report that almost the total production is exported. Bosnia & Herzegovina exports about one third of the national production. In this way, it can be concluded that "modern" forms of wood energy start playing a more prominent role in the analysed countries, but this source of RE is not predominantly used in the
country of production, but is seen as an attractive export product. Due to the limited data availability, it is impossible to estimate the share of this "modern" form of wood energy in total wood energy demand or, even, total energy demand of the respective countries.
3.1.2 Biogas
The set-up of biogas plants and the use of biogas energy is a very young development in both groups of countries. The exceptions are Poland, Slovenia and Romania among NMS where biogas production started already during the 1980s, although Romania’s production completely collapsed during the 1990s. Among the CC/PCC Croatia, Macedonia and Serbia had first biogas plants running during the 1980s, but none of those had been operational anymore during the 1990s. Hence at the start of this millennium, just Poland, Czech Republic and Slovenia among the NMS and Turkey among the CC/PCC had some biogas energy production. Most other countries started with this type of RE during the last years. With the exception of Malta, Bulgaria and Romania all NMS have installed biogas plants by now. The reasons seem to be limited supply of raw material for biogas (e.g. Malta) or limited financial resources available for investments (e.g. Bulgaria and Romania). The picture is quite different in CC/PCC. Here just Croatia and Turkey have biogas plants running while all other countries did not invest in this source of RE, so far. However, the data about biogas plants is, again, rather scarce as shown in Table 11:
Table 11: Number of biogas plants, total and managed by farmers, 2007
Biogas plants, Total Biogas plants, Managed by farmers NMS
Lithuania 6 1
Latvia 3 0
Estonia n.a. 0
Poland n.a. n.a.
Czech Republic 105 20 Slovakia 5 4 Hungary 40 5 Slovenia 9 9 Cyprus 1 1 CC/PCC Croatia 13 3
Turkey n.a. n.a.
Source: Country Reports 2009.
Note: n.a. = not available; other countries: No biogas production.
With the exception of the Czech Republic the number of biogas plants operational is quite small. This reflects the data summarised in Annex 2: Just in this country biogas energy is of some relevance as a source of RE with respect to total energy demand. In all other countries of the region which have taken up biogas energy production, this source of RE is of marginal importance, so far. However, particularly among those countries with a big land size and large agricultural areas the potential seems to be very big. When looking at the major sources of raw material for biogas energy, the agricultural sector just plays a supporting role for the time being. The major sources are
• municipal waste water (LTU, LVA, POL, CZE);
• organic waste from food industry (LTU, SVK, CYP, TUR);
Those biogas plants which are run by farmers are predominantly fed with liquid manure and/or maize silage. However, almost all reports stress the fact that the potential supply of manure and energy crops is much larger. In quite a number of countries there is idle land which could be used, e.g. for cultivating energy crops. The reasons for this rather low involvement of farmers seem to be two major ones:
• There is first the financial aspect: Investment costs in biogas plants are rather high and the production of this form of energy is not competitive with respect to fossil sources of energy. Hence, investments are only done if there is financial support available. But most NMS have just started to provide such support within their national Rural Development Programmes, 2007-2013.
• The other factor seems to be a social one: Only large farms (agricultural enterprises) have enough raw materials at their disposal to run a biogas plant efficiently (i.e. but only after having received financial support). However, in most countries of the region small-scale farming, or even subsistence farming, is predominant. Hence, most of the manure on-farm is needed as organic fertilizer and, even if available for biogas energy production, collecting the raw material from a large number of farms would be very costly. These costs might be cut if farmers were better organised. But, in general, these small-scale farmers are reluctant to form self-help groups or cooperatives.
In general, the energy produced by biogas plants is supplied as electricity. Just a small share of the produced energy is used for heating. As mentioned already, most countries have a potential in expanding the production of biogas. However, where biogas production is already ongoing, it is also emphasised that public resentment is growing due to bad smells.
3.1.3 Municipal solid waste
EUROSTAT statistics differ between energy production from biogas and municipal solid waste. As shown in Annex 2a, this type of RE is of some relevance in Hungary, Czech Republic and Slovakia, while of marginal importance in Poland. The country reports do not differ between these two types. As discussed above, municipal waste water and household wastes make up an important source of biogas energy in some countries. In addition, industrial wastes and former landfills are used as a source of RE. Unfortunately, no detailed information is available.
3.1.4 Biofuel
The production of biofuel, i.e. biodiesel and bioethanol, is a very recent development in all countries analysed. There is some production in the Czech Republic during the 1990s, but given up later on. In general, biofuel became an issue on the political agenda for NMS when joining the EU. With respect to CC/PCC the use of biofuel became an issue when prices for fossil fuel sky-rocked and the discussion started to reduce the production of Greenhouse Gases in line with the Kyoto Protocol. In the following chapter, we will distinguish between biodiesel and bioethanol.
With respect to biodiesel, most NMS have started biodiesel production between 2002
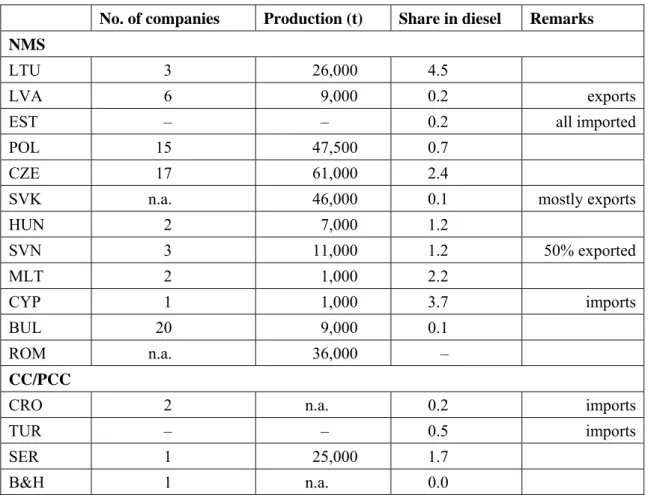
and 2004. Only Estonia reported any production at all, so far. However, it is importing some biodiesel. Among CC/PCC Croatia started in 2006 while Macedonia, Serbia and Bosnia & Herzegovina just took up production, recently. Turkey seems to import some biodiesel, while in Montenegro, Kosovo and Albania biodiesel does not play any role at all, so far. The information provided by the country reports, although very limited, is summarised in Table 12.
Table 12: Production and share of biodiesel, 2007
No. of companies Production (t) Share in diesel Remarks NMS
LTU 3 26,000 4.5
LVA 6 9,000 0.2 exports
EST – – 0.2 all imported
POL 15 47,500 0.7
CZE 17 61,000 2.4
SVK n.a. 46,000 0.1 mostly exports
HUN 2 7,000 1.2 SVN 3 11,000 1.2 50% exported MLT 2 1,000 2.2 CYP 1 1,000 3.7 imports BUL 20 9,000 0.1 ROM n.a. 36,000 – CC/PCC
CRO 2 n.a. 0.2 imports
TUR – – 0.5 imports
SER 1 25,000 1.7
B&H 1 n.a. 0.0
Source: Country Reports 2009; production figures for NMS: European Biodiesel Board, in:
Agra Europe: Agra Facts. No. 56 (2009), Bonn, p. 3.
Note: n.a. = not available.
In general, biodiesel is blended in diesel. The share is relatively small, but especially among NMS it is planned that it will increase over time due to mandatory blending. Among the CC/PCC the share of biodiesel is even smaller. In general, it is used by farmers. The major source of biodiesel production is rape seed. In addition, wastes of cooking oil (e.g. CZE, CYP, CRO, B&H) is used as raw material for this source of RE. In Macedonia imported soybean oil is used for biodiesel production where production has started in 2008. The production and use of bioethanol is still at its infancy. Due to mandatory blending
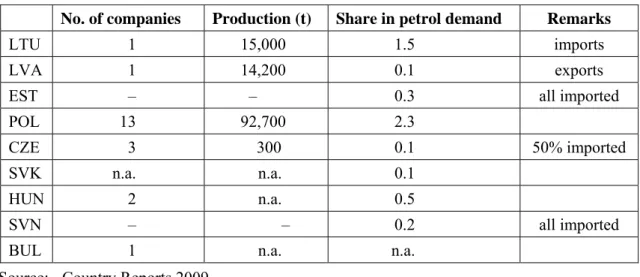
requirements within the EU it is becoming more important in NMS. Nevertheless in Malta, Cyprus and Romania is of no relevance up to now. Among the CC/PCC bioethanol is not an issue at all, so far. Based on the information available, the situation among NMS looks as follows (Table 13).
It is assumed that bioethanol production will go up in the next years due to mandatory blending requirements. Particularly, the Czech Republic recorded a big increase in national production going up from 300 t in 2007 to about 60,000 t in 2008. However, in all countries bioethanol demand (like the demand for biodiesel) depends on national blending requirements and tax incentives. Otherwise both types of biofuel are not competitive with fossil fuels.
Table 13: Production and share of bioethanol in NMS, 2007
No. of companies Production (t) Share in petrol demand Remarks
LTU 1 15,000 1.5 imports
LVA 1 14,200 0.1 exports
EST – – 0.3 all imported
POL 13 92,700 2.3
CZE 3 300 0.1 50% imported
SVK n.a. n.a. 0.1
HUN 2 n.a. 0.5
SVN – – 0.2 all imported
BUL 1 n.a. n.a.
Source: Country Reports 2009. Note: n.a. = not available.
3.2 Inorganic sources
Based on EUROSTAT statistics the inorganic sources of RE are made up by hydro-energy, wind energy, solar energy and geothermal energy. Again, the last three groups are also be characterised as "modern" types of RE. Within the group of hydro-energy we will distinguish – whenever available data permits – between "traditional" types of RE, like large and medium-sized hydro-power plants and "modern" types of RE, like micro hydro-power plants.
3.2.1 Hydro-energy
Next to wood and wood waste hydropower is the most important source of RE in most countries of the region. Among NMS it is of significant importance (i.e. its share is higher than 10% of total RE production) in Slovakia, Slovenia, Romania, Bulgaria and Latvia. In Malta and Cyprus there is no hydropower at all, while in Estonia and Hungary it is of marginal relevance (Annex 2a). With respect to CC/PCC hydropower is a very important source of RE in all countries, with the exception of Kosovo where it just makes up a small share of total RE production. In some countries, like Croatia, Montenegro and Albania it is the most important source of RE. When looking at the development of hydropower production during the last years (Table 14), the trend among both groups of countries is quite similar, i.e. among most of them an increase in hydro-energy production can be observed. However, when looking at this development, it has to be kept in mind that hydropower is highly dependent on annual rainfall patterns and power production therefore fluctuates on a year-by-year basis.
Most NMS showed an increase of hydropower production, but Estonia, Hungary and, to some extent, Lithuania and Poland started from a quite low level. Two big hydropower producing countries, i.e. Slovakia and Slovenia recorded a decline in absolute production. Among CC/PCC most countries recorded an increase in hydropower production. The exceptions are Croatia and Albania, which showed a sharp decline. The reasons seems to be that in 2007 the water supply in the dams had been rather low in these countries, but also that outdated technologies are still used which urgently need re-investments.
Table 14: Changes in the production of renewable energy from hydropower in relation to Total RE Production, 2000-2007
NMS CC + PCC Remark
Grown faster than total RE production
LTU, EST, BIH, KOS* share increased
Grown, but not so fast as RE production
POL, CZE, HUN, BUL, ROM
MON** share declined
Grown, while total RE production declined
MAC***, TUR, share increased
Declined, but total RE production grown
LVA, SVK, share declined
Declined faster than total RE production
SVN CRO, SER, ALB share declined
Source: EUROSTAT and Country Reports 2009.
Note: * 2003-2007; ** 2000-2006; *** 2000-2005; MLT, CYP: No RE from hydropower.
The traditional source of hydropower had been large dams. In many countries first dams had been built during the late 19th and early 20th centuries. In general, big hydropower plants (HPP) are predominant, but during the last years the number of small and micro-power plants increased rapidly. While large hydropower plants can be seen as the "traditional" mode of RE production, the small and micro-power plants will be seen as a "modern" form. Nevertheless, it is understood that some small HPP might have been built a long time ago. As it was out of scope for this report to check the age of the respective small HPP and the border line between small HPP and micro HPP was not always well-defined in all analysed countries, we understand in this analysis of "traditional" forms of HPP as large ones and "modern" forms as small and micro ones. The following Table 15 provides a rough overview.
With the exception of Estonia which records a very low level of hydropower production, the share of "modern" forms of HPP stands between two and about 25%. The general pattern looks like this: Those countries where hydro-energy is an important source of RE, the share of "modern" forms is relatively small. Among those countries where hydro-power is not very relevant, the share of "modern" forms is more significant. There is just one exception. In Slovenia, the share of "modern" forms comes up to about 10% of total hydropower production. The rapid installation of new micro-turbines during the last years seems to be the major reason.
All countries report that there is a big potential in expanding hydropower production. The exceptions are Malta and Cyprus where there is no hydropower at all and Estonia and Hungary where it plays a marginal role. In these countries the natural conditions are not so favourable for HPP. While most countries mention the potential in building new HPP, many also stress the need for re-investments in already existing HPP. In many Balkan countries, including Bulgaria and Romania buildings are depreciated and applied technology is, by far, outdated. But with respect to building new HPP many reports point out that the general public is not in favour of large dams anymore. Similarly, it is emphasised that environmental issues, including nature and landscape protection play a large role in these days. Hence, while the physical potential might be big, the scope for implementing schemes is rather limited. Micro-turbines and small HPP are an option which many countries in the region want to follow in the years to come.
Table 15: Number of large and small and micro hydropower plants and their share in total hydropower production, 2007
Large hydropower plants
Small, micro hydropower plants
Share of small, micro HPP in total hydropower production (%) NMS LTU 1 80 20 LVA 3 150 2.4 EST – n.a. 100 POL n.a. 69 3 CZE 9* 1,300 25 HUN 4 36 25 SVN 18 424 10 BUL 14 121 n.a. ROM 15 395 n.a. CC/PCC CRO 17 13 1.1 MAC 7 23 8 TUR 9 50 2 SER 9** 10 0.2 B&H 14 30 2 MON 2 7 n.a. KOS 1 2 25 ALB 11 37 1
Source: Country Reports 2009.
Note: * Plus 51 medium sized HPP; ** plus 6 medium sized HPP; n.a. = not available; MLT, CYP: no hydropower; SVK: No data.
3.2.2 Wind energy
The use of wind energy for electricity is a relatively young phenomenon in the region. First trials were reported in Latvia in 1996 and Estonia in 1997, respectively. In general, countries just started a few years ago. When looking at the present situation, almost all NMS have started in building up wind energy plants while just Croatia and Turkey from the CC/PCC have started with this type of RE production (Table 16):
Table 16: Significance of wind energy in NMS and CC/PCC, 2007
Starting year No. of wind parks Energy supply (MW) NMS LTU 2002 36 52.3 LVA 1996 15 25.2 EST 1997 1 4.8 POL 2001 160 ~250.0 CZE 2004 30 113.8 HUN 2001 13 n.a. SVN (2008) 2 2.5 BUL 2001 26 40.7 ROM 2006 5 n.a. CC/PCC CRO 2005 2 17.2 TUR 2000 10 146.4
Source: Country Reports 2009.
Note: n.a. = not available; MLT, CYP, MAC, SER, B&H, MON, KOS, ALB: No wind energy; SVK: No data.
When looking at the absolute figures of energy supply by this source of RE, Poland, Turkey and Czech Republic are the leading countries. All reports stated that there is a big potential in installing and/or expanding wind parks in the respective country. In general, it is anticipated that the supply of this form of RE will grow during the coming years. Just the reports on Slovakia, Slovenia and Bulgaria had been a bit restraint in the potential of this form of RE in their respective countries. While there is large potential in using this form of energy, most country reports also stated that there are strong limitations which have to be assessed first when investing in this source of RE. The major ones look as follows:
• instability of wind power;
• spoiling the natural landscape;
• noise emittance;
• affecting animals (birds) in their natural habitat;
• competing with environmentally protected areas.
In general, many reports highlight the strong local opposition against wind parks close to their living areas. Hence it is often difficult to find prospective areas for wind energy which do not affect the local population and are not touching natural reserve areas. In addition, there is a strong volatility in power supply by the wind plants due to irregular natural wind power. This requires large investments in the national power grids in absorbing this volatility. Most countries are starting to do these necessary investments. Hence, the maximum capacity of wind parks in most countries is still limited. Similarly, many prospective areas for wind energy are not connected at all with the national power grid. Again, this requires big investments in the years to come.
3.2.3 Solar energy
The production of solar energy is again a very recent development in NMS and CC/PCC. As discussed above, the installation of solar energy plants is not fairly well spread over the region. Just four countries of the NMS (i.e. Cyprus, Malta, Czech Republic and Hungary) and four of CC/PCC (i.e. Turkey, Croatia, Albania and Kosovo) produce solar energy of a certain quantity which is statistically recorded (Annex 2a and 2b). However,
the country reports reveal more countries are already starting in experimenting with this source of RE. While the information is rather sketchy it is summarised in the following Table 17:
Table 17: Significance of SOLAR ENERGY IN NMS and CC/PCC, 2007
Starting year Installations Energy supply
(MW) NMS
POL 2002 households 0.6
CZE 2004 households, public buildings n.a.
HUN 2001 16 parks 44.5
SVN 2002 65 households < 5.0 MLT n.a. 4 parks, households, public buildings 381.0 CYP 1980s no park, 90% of households, 50% of
hotels
n.a.
BUL n.a. 4 parks, 30,000 households 0.9
CC/PCC
CRO n.a. 4 parks 45.5
MAC n.a. n.a. 12.0
TUR n.a. 11,500 installations (households, public buildings)
n.a.
SER n.a. 28,000 installations in 1998, no actual information
n.a.
KOS 2003 2 parks n.a.
ALB 2001 private households, 3 parks n.a. Source: Country Reports 2009.
Note: n.a. = not available; LTU, LVA, EST, POL, SVK, SVN, ROM, B&H: First trials with solar energy; MON: No solar energy.
The production of solar energy is steadily growing. In general, private households and public buildings are the leaders in installing this technology for getting hot water and for heating. Solar parks are installed in just a few countries; Hungary seems to be leading in this respect. Among the countries with a significant supply of solar energy, Cyprus and Turkey use it exclusively for heating. The use of photovoltaic solar energy, i.e. for electricity, is in most countries in the starting/trial phase. Only Malta reports a significant supply of electricity through this source.
Most countries plan to expand the use of this source of RE. Since this technology is relatively expensive, it is mostly started with public buildings. Similarly, private households mostly in urban areas are encouraged to install solar collectors. Due to lower number of sunshine hours per year the Northern countries have a certain disadvantage compared to those in the Southern part of Europe in using this technology. In general, it can be concluded that solar energy is just at its infancy and its broader prospects will be in the Southern countries.
3.2.4 Geothermal energy
Geothermal energy is a just a marginal source of RE in the region, so the information about this RE is very small. Just six NMS record a supply by this source, but it is of significance only in Hungary and Bulgaria (Annex 2a). However, in Hungary there had been no additional investments in this source of RE during the last years, anymore, so its
share is gradually declining. Among CC/PCC it is recorded in three countries (Annex 2b). Particularly Turkey relies on this source of RE, to a small extent also Macedonia. In general, geothermal energy is used for heating. The reports on Turkey, Macedonia and Serbia emphasise that much of this form of RE is used for heating green houses. Only from Serbia it is reported that it want to expand its reliance from this source of RE. Therefore, it can be concluded that, overall, this source of RE is of marginal relevance now and will be so in the future.
4
N
ATIONAL POLICIES AND CONCEPTS PROMOTING RENEWABLE ENERGY The rapid repercussions of climate change and limits of traditional energy sources have become more and more evident since the 1990s. Within the United Nations Framework Convention of Climate Change (UNFCCC) most countries of the world committed themselves to reduce greenhouse gas emissions which was particularly specified in signing the Kyoto Protocol. All countries under analysis support the objectives of the Kyoto Protocol. In addition, all NMS and CC/PP have joined two additional international bodies which aim at increasing energy efficiency and promoting environmental friendly sources of energy, i.e. the Energy Charta Treaty (ECT) on the one side and the International Renewable Energy Agency (IRENA) on the other. The ECT, established in the early 1990s, is a multilateral framework with the objective to develop, promote and increase energy performance standards of all types of energy demanding devices. IRENA, established in 2009, aims at promoting a rapid transition towards a widespread and sustainable use of renewable energy worldwide. Almost all NMS, CC and PCC have joined ECT and IRENA (see Table A3 in the Annex)6.In this chapter, it will be looked at the national policies and concepts with respect to the promotion of RE. As most sources of RE, particularly the "modern" ones, are not competitive with other forms of energy for the time being, they were and still are supported by financial incentives which have to be decided politically at national and EU levels.
4.1 National policies
The discussion about RE has a long tradition within the EU. Hence, all NMS were confronted with this issue when they started negotiations about accession. Since having joined the EU, all of them have adopted the policy targets of RE in line with the EU directives. All NMS have legally committed themselves to achieve certain mandatory targets of RE shares with respect to (a) total energy demand, (b) electricity demand, and (c) in national transport. These targets have to be met by 2010 and 2020, respectively. Depending on the natural and economic conditions these targets might differ from country to country. Concerning CC/PCC most of them have committed themselves to adopt a mandatory target with respect to the share of RE in total energy demand. Only, Turkey, Serbia and Albania have not defined any targets, so far. Croatia is the only country among CC/PCC which has adopted also mandatory targets for electricity demand and national transport. The need to harmonise national energy policies with EU requirements, but also EU financial support to achieve them had been important reasons for many countries to adopt the mandatory targets, like Latvia, Estonia, Hungary, Cyprus, Bulgaria and Romania among NMS and Macedonia, Serbia, Bosnia & Herzegovina and Montenegro among CC/PCC. In addition, almost all countries of the region have adopted the Kyoto Protocol which commits them to reduce Green House Gas (GHG) emissions during the next years.
Hence, almost all of the countries are politically committed to follow these two interrelated objectives.
In a nutshell, the objectives of the countries in the region can be summarised as follows:
• promote energy security (reduce dependency from energy imports);
• reduce GHG-emissions, and
• increase the share of RE in energy demand.
These objectives have been endorsed, in general, although in many countries an increase in energy efficiency seems to be even more important at this stage. This issue is particularly of relevance among NMS in Lithuania, Slovakia, Malta, Bulgaria and Romania. Among most of the CC/PCC this point has been mentioned as a very important one. Within NMS public debate has started during the last years, but in general it is a debate between insiders and experts. The awareness among the general public is, in general, weak. So there was only in some countries a debate whether an increase of RE might negatively affect national food security, e.g. in the Czech Republic. Only Macedonia and Kosovo decided not to focus on bioenergy, but on other forms of RE in order to ensure national food security.
In each country up to 10 national experts on RE were asked about their opinion with respect to national RE policies. In particular, it had been assessed about guiding principles of RE policies and the major policy strategies. The opinions of the experts were summarised by the national author(s) into a six-step scale, ranging from 0 (= not relevant at all) to 5 (= highly relevant). Since these statements are not based on structured guidelines and the experts could be selected by will, their statements just provide a glance and should be seen like that. These statements are summarised in Table 18 for the NMS and Table 19 for CC/PC, respectively.
Table 18: Relevance of selected political issues by national experts from NMS
Relevant (4-5) Somewhat relevant (2-3) Not relevant (0-1) Guiding principles
National independence
from imports BUL (5), LVA (5), SVN (5), SVK (5), LTU (4), HUN (4), MLT (4), EST (4)
CZE (3), POL (3), ROM (2), CYP (2)
Need for substituting
fossil fuels LTU (5), EST (5), ROM (5), CZE (5), SVK (5), MLT (4), BUL (4),
HUN (3), SVN (3) CYP (1), LVA (1), POL (1)
Strategies
Development of national RE concept
EST (5), CZE (5), HUN (5), SVN (4), MLT (4), CYP (4)
LTU (3), POL (3), SVK (3), BUL (3), ROM (3)
LVA (1) Focus on organic RE LVA (5), EST (4), POL
(4), HUN (4) LTU (3), CZE (3), SVK (3), SVN (3), ROM (3), MLT (2), CYP (2)
Focus on inorganic RE CYP (5), LTU (4), MLT
(4), ROM (4) EST (3), CZE (3), SVK (3), HUN (3), SVN (3), BUL (3), LVA (2), POL (2) Financial support in
promoting RE
LTU (5), LVA (5), EST (5), CZE (5), CYP (5), ROM (5), HUN (4), SVN (4), BUL (4) MLT (3), POL (2), SVK (2) Stimulating private sector
LTU (4), POL (4), HUN (4), SVN (4), CYP (4)
LVA (3), EST (3), CZE (3), MLT (2), BUL (3), SVK (2)
ROM (1)
The experts stress the fact that national policies promoting RE are primarily motivated by the objectives of achieving national independence from foreign fossil fuel supplies and of reducing their dependence on fossil fuels in general. However, the objective of substituting traditional fossil fuels was not that strong among all countries. Particularly experts from Poland, Latvia and Cyprus did not endorse that need. With the exception of Latvian experts, all saw the need for a more focused national concept promoting RE. Most experts supported the need to promote organic and inorganic sources of RE in their respective countries. Just Cyprus and Malta focused strongly on the inorganic sources, while Latvia and Hungary saw more potential in promoting organic sources. Almost all experts emphasized the need for financial support in promoting RE because of the limited competitiveness of RE with fossil fuels. Although the private sector is actively investing in RE production plants, the experts did not see a strong role by it. This might reflect the fact that the private sector is only investing if state support is provided.
Concerning the CC/PCC experts’ opinions show a slightly different focus as shown in Table 19 below.
Table 19: Relevance of selected political issues by national experts from CC/PCC
Relevant (4-5) Somewhat relevant (2-3) Not relevant (0-1) Guiding principles National independence from imports
CRO (4), SER (4) BIH (3), ALB (3), MAC (2), TUR (2)
Need for substituting fossil fuels
SER (5), CRO (4), TUR (3), ALB (3), MAC (2), BIH (2) Strategies Development of national RE concept CRO (5), MAC (5), SER (5), ALB (5), TUR (4), BIH (4)
Focus on organic RE TUR (4) CRO (3) MAC (1), ALB (1), SER (0), BIH (0) Focus on inorganic RE MAC (5), TUR (5), SER (4), BIH (4), CRO (4), ALB (4) Financial support in promoting RE SER (5), BIH(5), CRO (4), MAC (4) TUR (3) ALB (0) Stimulating private sector
CRO (5), BIH (4) MAC (3), TUR (3), SER (3), ALB (2) Source: Country Reports 2009.
Note: MON, KOS: No data.
With respect to the guiding political principles only Croatia and Serbia among CC/PCC seem to be motivated by the objectives of achieving a higher energy independence and the need of substituting traditional fossil fuels. All experts are of the opinion that a national concept for the promotion of RE is of high relevance, but in general it is missing. The focus seems to be very strongly on inorganic sources of RE. Just the Turkish experts also saw good prospects in promoting organic sources of RE. Again, like their colleagues from NMS, the strong need for financial support in promoting RE production had been stressed. The role of the private sector had only been stressed by the Croatian and Bosnian experts.
Figure


Related documents
Đặc iệt trong lĩnh vực Y học, các hợp chất này đã và đang đƣợc nghiên cứu làm thuốc nhƣ thuốc kháng sinh, thuốc chữa cúm A, thuốc tim mạch…Nhiều hợp
(5) A One Person Company, small company and dormant company shall be deemed to have complied with the provisions of this section if at least one meeting of the Board of Directors
actors like age, monthly savings, expected average readiness score of 52 – a long way short etirement age, guaranteed retirement of the 100 that would ensure people get the
It is performed, con- servatively, every time a player submits an update, although with an optimistic approach: when an update is received, the server consults its subscription
Condiments Products Business (¥bn) 11/14 Plan Increase (Decrease) Net Sales 156.0 10.6 Operating Income 11.9 0.4 Operating Income Ratio 7.6% (0.3)%. Increase in gross profit due
For this purpose this research sets out to examine the connections between the Egyptian long-feature films of the selected period and the socio-historical and cultural
“The program must prepare graduates to apply knowledge of mathematics through differential equations, calculus-based physics, chemistry, and at least one additional area of
The small proportion of CHE found with methods re- lated to capacity to pay are likely to reflect the fact that in those slum areas, poor households have little income left after
