Leads
and
Spatial
Vectorcardiograms,
Using
the
Panoramic
Vectorcardiograph
By WILLIAM R. MILNOR, M.D., SAMUEL A. TALBOT, PH.D., AND ELLIOT V. NEWMAN, M.D. The extent to which precordial and other unipolar leads are influenced by the proximity of the
exploringelectrodetoone part oranother of the heart is the subject of considerable debate. One
approachtothe problem istodeterminehow closelyprecordial leadscanbepredictedfromspatial
vectorcardiograms recorded by leads relatively remote from the heart. The panoramic vectors cardiograph described below provides a convenient way of doing this, since itautomatically
re-cordsscalar derivations from thevectorcardiogram foranyspatial axis. Results indicate that local
effectsarenotthepredominant factor in determining the form of the complexes in precordial leads.
ALTHOUGH "unipolar" chest and ex-tremity leads are now widely used in clinical electrocardiography, there is still considerable diversity of opinion about just what part of the electrical activity of the heart is recorded
by
such leads. Two more orless conflicting theories have been
proposed:
(1) that unipolar leads are "semidirect" leads, influenced principally by theelectrical state of the
myocardium underlying
the exploring elec-trode, (2) that they represent summations of the electrical activity in all parts of theheart. The first theory was introduced by Wilson and hisco-workers,"'
12 on the basis ofexperi-ments indogswhichshowed that thecomplexes recorded byunipolar leads from the chestwall closely resembled those recorded
by
direct unipolar leads from theunderlying
epicardial
surface. They concluded that
unipolar
leads provideda way ofisolating to someextent the electrical activity of different parts of the heart. Thistheoryhas beenwidelyaccepted
in the current literature, and has been used in clinical electrocardiography as the basis for the concept of "electricalposition
of theheart,"'2
and in the electrocardiographic de-termination of anatomicposition
and rotation of the heart.4FromtheDepartment ofMedicine,JohnsHopkins University School of Medicine and Hospital. This investigationwassupportedbyagrant (H-328) from the National Heart Institute, National Institutes ofHealth, U. S. Public Health Service.
545
The second theory is essentially that em-ployed by Einthoven in his calculation of mean electrical axes from the standard extremity
leads.'
Einthoven's hypothesis. included only the frontal plane, but Duchosal andSulzer,'
as a result of their work in spatial vector-cardiography, concluded that this
hypothesis
wasvalid foranyplane,andfor any lead on the body surface. Accordingto thisview, the com-plex spread of electrical activity through the heart can be represented at any instant as a single equivalent dipole, and the voltage re-corded by a precordial or other lead will be determined by the relation between the axis of the lead and the axis of the dipole, as well asthe distancebetweenthe lead electrodes and the dipole. Since the spatial
vectorcardiogram
is a record of the variations in potential and direction of this single equivalent dipole, the form of the complexes in a precordial lead
de-pends
on the angle from which the lead"views,"
so to speak, the spatial vectorcardio-gram. Ifthis hypothesis is true, then it should be possible to predict the precordial electro-cardiogram from a properly recorded spatial vectorcardiogram. Duchosal found it possible to do this in most cases, although there were occasional marked discrepancies.2Although any complex electrical generator resembles a single dipole source when viewed from a sufficiently great distance, it has been generally supposed that precordial leads were too close to the heart for the Einthoven hy-pothesisto apply. Duchosal's resultssuggested Circulation, VolumeVII,April,1953
UNIPOLAR LEADS AND SPATIAL VECTORCARDIOGRAMS that this may not be true, and that further
investigation wasindicated.
The comparison of the electrocardiograms actually recorded from the precordium with
thecomplexes predictedfromthespatial
vector-PROJECTION O F E CG S F R O M T H E S P A T I A L V C G -30O
0
G)~~~~~~~~~~~~~~430*
TRANSV+R0E SECTION +60 oF THORAX, SHoW1"N\, ORIEmrTION vF AND VARIOUS AXES / \/OF PROJECTION.
\~~~~+30O
+12 Ag+9o- +60O
MI6L1SEC0ONDS
(D DL,EIVT10 T~r *
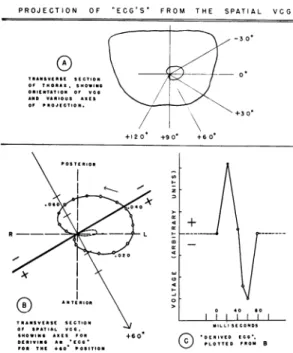
FIG. 1. Method of predicting the scalar electro-cardiograms at points on the body surface fromthe vectorcardiogram. In A an arbitrary locus for the nullpoint has been selected, and the orientation of
the transversevectorcardiogram with respectto the
thoracic wall is shown. B shows in more detail the relation of the loopstothe+60degree axis. TheQRS loop is shownas asolid linewithopencircles indicat-ing time intervals of4.0milliseconds,and isinscribed inacounter-clockwisedirection.TheTloop is shown as a broken line, and the P loop hasbeen omitted. Theheavylinethrough thenullpoint atright angles
tothe+60degreeaxis divides theelectrical fieldinto areasofpositivity andnegativityfor thisparticular axis. Thepartsofthevectorcardiogramwhichlie in
the positive half of the field will be recorded by a scalar unipolar lead along this axis as positive
de-flections,and thoseparts inthenegativehalf of the
fieldasnegative deflections.ThescalarQRS complex whichwould beexpectedatthepointwhere the +60 degreeaxis intersectsthe chestwallcanthereforebe plottedasshowninC.
cardiogram is a good method of testing these hypotheses, forifthe precordial leadsare dom-inatedby local effects, these local characteristics shouldnotbe apparent intherelativelyremote
leads from which the vectorcardiogram is
re-corded. The complexes predicted for the pre-cordial areafrom the spatial vectorcardiogram would then differ from those actually recorded by precordial leads. In practice, however, this approach presents several difficulties. First, in order to predict from the
vectorcardiogram
the variations in potential at a given point it is necessary to define the spatial position of that point with respect to the nullpoint of the vectorcardiogram, that is, with respect to the electrical nullpoint in the body. Although the postulated existence of an electrical zero point in the body is a useful theoretic concept, the criteria for establishing its anatomic position are open to question, and most investigators have resorted to some arbitrary location such as the center of the ventricular mass de-termined
radiologically.'
*Second, since the spatial vectorcardiogram is usually recorded in terms of its projection on three planes (frontal, sagittal, and
trans-verse),
it is possible to calculate the predictedelectrocardiograms only
forpoints
which lie in these planes. For all other points either measurements on a three-dimensional model of the spatial vectorcardiogram, or lengthy mathematiccalculations,
are needed.Third, the accurate calculation of predicted potential variations from even a plane
vector-cardiogram
is anexacting
and time-consuming operation. The method is discussed in detail byDuchosal,'
and an example is given in figure 1, which shows the relationship between a transverse plane vectorcardiogram and the scalar* electrocardiogram to be expected in a specified direction in the electrical field.To overcome some of these difficulties, we have adopted a method described by Schmitt in 1947 for the cathode-ray presentation of three-dimensional data.8 His paper presents the mathematic transformations needed to
convert three-dimensional data into any de-sired planeprojection, and shows that this can be
accomplished
electrically by theuse of sine-cosinepotentiometers.
These are simplyrotat-*The term
"scalar"
is used to distinguishcon-ventional electrocardiograms, which measure the magnitude of the potential difference between two electrodes, fromvectorcardiograms, which deal with spatial direction as well asmagnitude.
ing variable resistors, which attenuate the voltages reaching them proportionatelyto the sine or cosine of the angle through which they arerotated.
Using the principles he outlined, we have designed an instrument, shown in figure 2, which makes it possibletodisplayon acathode ray oscilloscope any "view" of the spatial vectorcardiogram, or the scalar derivations from the vectorcardiogram along any axis drawn from the nullpoint in any direction in space. Because this machine enables one to
AMPLIFIERS
axillary line on the right and left back. The
elec-trodesoplacedonthe patient's right side iscommon to all three leads, and is paired with an electrode
directly anteriortoit, onthe ventral surface ofthe right shoulder, for the anterior-posterior lead. The common electrode is paired with one vertically below it on the right lower back to make up the
vertical lead. The lower right back electrode is
placed so thatthe length of the vertical lead is the
same asthat of the horizontal lead. Standardization is the same in all three leads, no correction factor
being used. Many other lead systems are currently
usedinvectorcardiography,andacomparative study of their various theoretic and practical merits will be published subsequently.
FIG. 2. Blockdiagram ofpanoramicvectorcardiograph.The panoramicunit oscilloscopesare shown in thephotographontheright.
"view" the spatial vectorcardiogram from any
angle, we have called it the "panoramic" vectorcardiograph.
TECHNIC
Figure2showsablockdiagram of the panoramic
vectorcardiograph, with a photograph of the pano-ramic unit and its oscilloscopes. The vectorcardio-graph (VCG) lead system used in this study isan orthogonal, bipolar system withacommonelectrode onthe backof theright shoulder.The horizontal and
anterior-posterior leads lie in the transverse plane passing through the junction of the second rib and the sternum. The electrodes of the horizontal lead
areplacedatthis level, just medialtothe posterior
and itscathode ray
As shown, the three vectorcardiograph leads
(vertical, horizontal, and anterior-posterior) from the patient are connected to separate amplifiers.
Theamplifiersweredesignedandbuilt inour
labora-tory,and theirresponsehasbeen showntobe linear
over a frequency range of 0.5 to 150 cycles per
second. Their response to a continuous 1.0 mv.
direct current signal shows less than 3 per cent
decrement 0.2 second after the introduction of the signal, and falls to 33 per cent of the original re-sponse in 2.7 seconds. These amplifiers together
with the direct-coupled amplifiers of the Dumont
304-H cathode ray oscilloscope give a maximum
sensitivity of 10 inchespermillivolt on the face of the oscilloscope.
UNIPOLAR LEADS AND SPATIAL VECTORCARDIOGRAMS
FIG. 3. Blockdiagram ofpanoramic unit
FIG. 4. Schematic diagramof thepanoramic unit componentsshown in figure3
548
UNIT 'A" UNIT UGH UNIT D
UNIT
NAN
+150V - 1O 120 K 120 K -150V 1 UNITODO
470 K 0-^,_~~ 470K UNIT ( O4*
a _____________ F150 V. UNIT 3! INPUT OUTPUTx, vertical = y, anterior-posterior = z) are fed to
the circuits of thepanoramic unit, shown in figures
3and4. This unit is essentiallya calculator, which carriesoutadditionand subtractionby unity
ampli-fiers,9 and performs the mathematic
transforma-tions8:
EXE = E.cos0- E,sin+
Eyt
= En cos0+ sinO(E,sin - E,coso)The single-ended outputs of the panoramic unit
(x" andy")areconnectedtotheplates ofaDumont 304-H oscilloscope throughitsdirectcoupled
ampli-fiers.
Vectocardiograms are photographed on 70 mm.
photographic paper (Eastman Kodak Linagraph
No. 1127), using a "Varitron" camera, Model E,*
(not shown in fig. 2) witha Carl Zeiss Tessar f/3.5 lens. Time intervalsin the vectorcardiograph loops
areindicated by modulating the beam intensityso
that the trace is blanked every 0.004 second for a
period of 0.002 second. The timing signal is not a square wave, but is peaked by a capacitor,so that the dashes which make up the loops are
wedge-shaped, and pointin the direction ofrotation. Three plane projections of the vectorcardiogram
are recorded consecutively: frontal, sagittal and
transverse.Thesagittalviewwhichweuseroutinely
isthe view of thespatial vectorcardiogramfromthe
patient's right side. Thetransverse view isrecorded
so that the patient's right side lies to the reader's left, and the patient's chest lies toward the bottom ofthe page.
The y" output ofthe panoramic unit is also dis-playedon asecond cathoderayoscilloscope, against
a linear time sweep. This scope is used only as a monitor,andthey"outputis recordedonone chan-nel ofa Hathaway S-14 C oscillograph.t The out-putsoftheamplifiersarerecordedonother channels of this oscillograph. The galvanometers used are
Hathaway Type OC-2, and have an undamped
naturalfrequency of500cycles persecond. Apaper
speedof50 mm.persecond isused,andan
independ-ent timer registers time lines at intervals of 0.01
second, with heavier lines at 0.05 second and 0.10 second intervals.
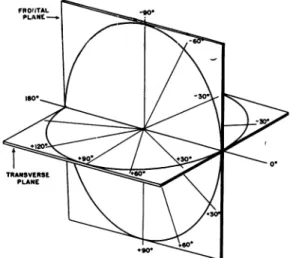
Todescribe three-dimensional datasomearbitrary conventions must be adopted, and the spatial
co-ordinate system wehave used is shown infigure 5.
The zero axis inthis system is atthe line of inter-section of the frontal and transverseplanes, on the patient's left side. Position above or below the horizontal plane is termed "elevation" (o), and is
described by theanglebetweenthetransverseplane
and a line connecting the nullpoint with the point being designated, in a plane perpendicular to the
transverse plane. Angles above the horizontal are
*Photographic Products Inc., Hollywood, Calif.
tHathaway Instrument Company, Denver, Colo.
designatedasnegative, and those belowaspositive. Position dorsal or ventral to the frontal plane is termed "azimuth"
(o),
andis described intermsof projection on the transverse plane. Axes lyingan-teriorly, that is,ventrally,aredesignatedaspositive, and those posteriorly as negative. An observer, for example, whose position was at elevation = 0
de-grees,azimuth = +90degrees wouldseethe frontal planevectorcardiogram.
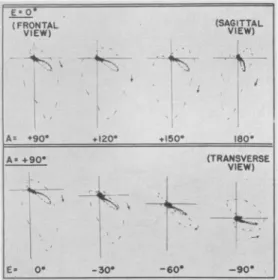
Anyview of the spatialvectorcardiogram canbe
displayed by adjustment of two controls on the panoramic unit, whicharecalibrated intermsof the elevation and azimuth of the observer. This is illustrated in figure6. The firstvectorcardiogramin the top line in this figure is the standard frontal view ofthe spatial vectorcardiogram. If we remain
atthesameelevation, andchangethe azimuth
con-trol through successive intervals such as the 30
degree intervalsillustrated,the correspondingviews
FIG. 5. Spatial coordinate system
ofthe vectorcardiogram appear onthe oscilloscope, sothatwe move around toward thepatient's right
side until we see the sagittal view. In the lower
line of this same figure, we start again with the
frontal view, but this time maintain a constant
azimuth andmove tosuccessively higherelevations
untilwe look downonthe spatialvectorcardiogram
fromabove. In thisway, byadjusting azimuth and
elevation,we canview the spatialvectorcardiogram from any angle, making its characteristics from all aspects accessible without the construction of wire
models orthe use ofstereoscopy.
In addition, the projection of the spatial
vector-cardiogramalong any single axis can be shown as a scalarelectrocardiogram byusing only they"output of the panoramic unit. As can be seen in figure 2,
the verticalcomponent ofwhateverloop appears on
the first oscilloscope will appear as a scalar record onthesecond,and can atthesame time be recorded
oscil-UNIPOLAR LEADS AND SPATIAL VECTORCARDIOGRAMS
lograph. For example, when the frontal plane
vec-torcardiogram is being displayed on the first scope,
the vertical vectorcardiographlead willappear as a scalarelectrocardiogramonthe second. (The polarity
of the electrocardiograph lead will be inverted in
this case, since the frontal vectorcardiogram is
recorded with positivity downward, or footward, on
the scope; by rotating the elevation control 180 degrees the polarity can be made to conform with
the electrocardiographic convention of recording
FIG. 6. Views of thespatial vectorcardiogramofa
normal subject, showinghowthe panoramic
vector-cardiographcanbeused to displayanyprojection of
thespatial loops.Thefourvectorcardiograms inthe
upperlineshow views of thespatial vectorcardiogram
fromfour different positionsin the horizontalplane
(elevation = 0degrees). Theview onthe left is the
usual frontal view (azimuth = +90 degrees). By
changing the azimuthsettingonthe panoramic unit
30degreesat atime, the observermoves around
to-ward the patient's right side, finally reaching the
sagittal view, at azimuth = 180 degrees in our
co-ordinate system. In the lower line of records the
firstview isagainthe frontalview,but this timethe
azimuth is kept constant, and the elevation of the
observer is changed. At elevation = -60 degrees
theloopsareseen almostonedge.
positivity by upward deflections.) Similarly, when thetransverse view of thevectorcardiogramisshown
onthe first scope, the anterior-posterior component of the vectorcardiogram will appear on the second
scope. It will be apparentthat there is a difference
of 90 degrees between the derived scalar lead and the position of the observer viewing the loop, so
that it is convenient to have separate scales onthe
azimuth and elevation controls for these purposes.
In using the panoramic vectorcardiograph
to predict from the vectorcardiogram the
po-tential variations to be expected at various points on the body surface, the assumption is made that the electrical field of the heart in the body resembles that of a relatively small dipole source in a homogeneous conducting medium. Clearly, thisis at best an approxima-tion, but the point in question is whether it is a sufficiently close approximation to explain the form of the complexes recorded from the precordium and elsewhere, and if not, what discrepancies appear? This can be investigated by comparing complexes recorded by unipolar leads from the body surface, with scalar records, correspondingtothesamearea, derived by the panoramic unit from the spatial vectorcardio-gram. Comparisons of this kind can be only approximate since the location of the null-pointinthe bodyis not knownwith any exact-ness and we cannot therefore define a given point on the body accurately in terms of our coordinatesystem. We havetriedto avoidthis difficulty by taking electrocardiograms from alargenumber ofpointsonthe chest and back, and comparing them with a group of vector-cardiographic derivations corresponding to ap-proximately the same area, rather than at-tempting a point-by-point comparison. A large number of axes through the
vectorcardiograph
were explored, using the cathode ray oscillo-scope as a monitor; the coordinates at which complexes similar to the actual electrocardio-grams occurred were noted, and the complexes recorded. The over-all amplitude of the actual and
predicted
complexes are not comparable, since the amplitude of all the predicted com-plexes were arbitrarily adjusted to approxi-matelythe samesize.RESULTS
Fifty-two patients with heart disease, in-cluding cases of myocardial infarction, bundle branch block, and ventricular "strain," have been studied, as well as six subjects with no evidence ofheart disease. The results obtained canbest be shown by describingthree illustra-tive cases. In these three cases, as in all cases studied to date, the actual body surfaceleads andthe appropriate scalarderivationfromthe
vectorcardiogram
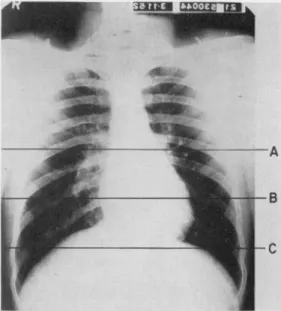
resemble each other veryclosely, provided the approximate position of the electrical nullpoint is taken into account. Case 1.Thispatientwas awhitemale, 21 years of age, with no evidence of cardiac or other disease. Figure 8 shows some of the electrocardiograms
re-cordedfromthis subject, and scalarderivations from
his vectorcardiogram corresponding to
approxi-mately the same area. The upper three lines of
records in figure 8 are unipolar (V) leads taken at
the three different transverse levels, A, B, and C, indicated in figure7.Thevertical alignment ofthese leads corresponds to the standard precordial
posi-tions and their counterparts on the right chest. Several features of this series of leadsareofinterest. First, atall three levels the Rwave becomes larger and the Swavesmalleraswego from the rightside ofthe chesttotheleft,justasinthe normalroutine precordial leads. Second, along each vertical line, the R wavebecomes larger and the Swave smaller as we move from the upper part of the chest down-ward. In other words the transitional complexes, in which R and S are roughly equal, are displaced further to the patient's right as we go downward
from one level to the next. Third, at level A lead
V6Risamirror
image
ofleadV6,
andV6hasthesame form asstandard lead I. Thisisnot trueatlevel B or C, and suggests that the electrical nullpoint lies nearthe transverse plane indicated by levelA. All of these characteristics are also found in the scalar vectorcardiograph derivations. The electro-cardiograms from level A correspond quite closelytothe derivations fromthetransverse
vectorcardio-gram (elevation = 0degrees),aswouldbeexpected ifthezeropointwere atthis level.Incomparing the vectorcardiograph derivations with leads at other levels it isimportant torealize that the leads taken
atanyone transverse level arenot all at the same
angle of elevation with respect to the nullpoint in our spatial coordinate system. This is due to the
eccentricity of the nullpoint in the body, so that
points along a given horizontal level on the body
surfacearenotequidistant from it. Ifthenullpoint
liesonthe left side of thebody,whichseems
proba-ble, then leads onthe left side of the chest will be
at a greaterangle below itthan leads on the right
side. At the horizontal level passing through the nullpoint thisdoesnot apply.
Forthisreasononewouldnotexpect allthe vector-cardiograph derivations corresponding to
electro-cardiograph leadsatlevelsB orCtobe foundatthe
sameelevationsettings,butwould expect the
great-est angles of elevation for leads on the left chest.
This is borneoutby the derivations shown infigure
8. To find the scalar vectorcardiograph derivation corresponding to V6 at level C, for example, it is
necessary to move down to elevation = +65 de-grees, while the derivation corresponding toV6Rat
thislevelappears atelevation = +50 degrees, and that corresponding to V2 is at elevation = +30
degrees. Leads V8, V8R, and VML, taken at the angles ofthescapulaeand in themidline ofthe back, also have their counterpart in vectorcardiograph deri-vations, as shown at bottom right in figure 8.
Inthiscase the P and T waves in the scalar
vec-torcardiograph derivations resemble those in the actual leads fairly closely. In many cases this is not true, as Jouvel and Duchosall have pointed out,
and it seems probable that the electrical nullpoint
assumes a different position for each of the three
electricaleventsrepresented by the P, QRS, and T
deflections.
FIG. 7. Case 1. Chest x-ray film showing the three levels at which the unipolar electrocardiograms in the first three lines of figure 8 were taken.
Case2. The records from this case, a 30 year old
white female with classic signs and symptoms of
mitral stenosis, are shown in figure 9. The
vector-cardiogram shows changes frequently seen in this condition. TheP loop is large andnotched, and the frontal QRS loop is tilted far to the right. In the
sagittal view the QRS isdisplaced toward the chest and in the transverse view the QRS loop rotates
clockwise, which is almost never seen normally.
In theelectrocardiogram, precordialleads VRto V6,takenatthelevel ofthe fifth anteriorintercostal
space, show the pattern frequently seen in right ventricular strain. There is a large R wave in the right-sided leads, an RS in the midprecordials, and
a large R with little or no S in the left-sided pre-cordial leads. As others have pointed out, 2, ` this
kind of QRS transition cannot be reconciled with
thetransversevectorcardiogram, orindeedwithany
single plane through the spatial vectorcardiogram, since predominantly positive deflections appear on
both sides of the chest. If, however, we record V6
UN IPOLAR LEADS ANI) SPATIAL VIECTORCARDIOCRAMS
FIG.8. Case1. The records inthe first three linesareunipolar (V) electrocardiograms takenatthe levels indicatedinfigure7.Thenextthree linesshow comparable scalar derivations from thespatial vectorcardiogram.The form ofthecomplexesis very similar in thetwo setsof records. The over-all amplitude of the complexes is notcomparable, since the scalar vectorcardiograph derivations were
calculated asifallwereequidistantfrom acentral dipole. Standardelectrocardiograph leads I, II, andILLareshown lower left. The paperspeed and standardization indicatedapplyalsoto the chest leads.Inthe lowerright three unipolarelectrocardiogramsfromthe backareshown, again with
com-parablescalarvectorcardiographderivations. V8 and V8Rweretakenattheanglesof the left andright scapulas,respectively, atlevel"B" (fig. 7). VMLwastaken intheposteriormidlineatthesamelevel.
of the second anterior intercostal space it has the same form as lead I, suggesting that the electrical nullpoint lies at this relatively high level in the
chest,just as incase 1. It seemsprobable, therefore,
that these precordial leads were well belowthelevel ofthe nullpoint, and should not be compared with the transverse plane vectorcardiogram. When we usethepanoramic unit to record scalar
vectorcardio-graphderivations for angles below the nullpoint, we find the same QRS transition as in the precordial leads (fig.9).
Case3. Thispatient was a 40 year old white male whohad shownclinicalevidence of acutemyocardial
infarction six weeks before the records shown in figure 10 weremade. According tothe"semidirect" theory, thedeep Q waves andinverted T wavesin
leads V2 to V6 would be regarded as local effects attributable totheproximityof the exploring
elec-trodetothe injured myocardium. The same
deflec-tions,however,arereproduced inscalar derivations from the spatial vectorcardiogram, although the
vectorcardiogram was recorded by leads nowhere near theprecordium.
DISCUSSION
1. Precordial Leads and the Transverse Projec-tion of the Spatial Vectorcardiogram Discrepancies between the precordial electro-cardiogram and the transverse vectorcardio-gram havebeen
reported
by severalinvestiga-tors,"'
2, 5andhave beeninterpreted
indifferent
ways. Duchosal2 has offered the explanation that there is a continuous displacement of the nullpoint during the QRS complex. Although it seems
probable
on theoreticgrounds
that this does occur to some extent, the fact that theprecordial
leads do notusually
lie in the same transverse plane asthenullpoint appears in our cases tobe amuchmoreimportant factor inproducing
thesediscrepancies.
When this factor istaken intoaccount, itisnotnecessaryto assume a
changing
locus for thenullpoint
duringthe
QRS.
In many of our cases, as in the three
illus-trated,
theQRS nullpoint appeared
to lie much higher in the chest than the anatomic center of theventricles,
and the standard precordial positions were therefore below it. This is in accord with the observation fre-quently madeintheroutinereading
of electro-cardiograms, that lead V6 does not have the sameform aslead I,butmorecloselyresembles lead II, or a lead along an axis between leadsI and II. Similar findings have been reported by Jouve and his
co-workers,5
who state that thezero pointin normalsubjectsissituated to the left of the midline, in a horizontal plane between the third and fifth rib, and that in cases of right ventricular hypertrophy it is higher in the chest.From our preliminary observations in this regard it seemsthattheremaybe acorrelation between the location of the nullpoint and the mean QRS axis. In the three cases illustrated, the mean
QRS
axis lies below the horizontal,and
thenullpointisrelatively
highinthechest. Inleftbundle
branch blockand left ventricular hypertrophy, where the mean QRS axis lies above the horizontal, the nullpoint in the few cases we havestudied with this point in mind has been lower, at about the level of fifth an-terior intercostal space. Furtherinvestigation
of the position of the nullpoint in various cardiacabnormalitiesis indicated.
2. The"Semidirect" Hypothesis
The Wilson central terminal and unipolar V
leads
wereintroduced
because itwasthought
desireable
to know the "absolute" variations in potential(measured
with reference to an "indifferent"point)
at various points on thebody.'0
Bipolar leads such as standard leadsI,
II, and III wereconsidered
tobe "mixtures" of electrical information because they were measurements of the difference in potential betweentwopoints, both of which showed wide changes ofpotential during
the cardiac cycle. Aside fromthe question of whether the poten-tial variations of the central terminal are in factnegligible
forpractical
purposes, the elec-trical informationrecorded
by unipolar leads would be more useful than that recorded bybipolar
leadsonly
if the cardiac electrical field were grossly irregular, withpreferential
con-duction
pathways
from certain parts of the heart to particular parts of the body surface.If,
however, thefieldwereapproximately sym-metric, like that of a simple dipole, then there would be no essentialdifference
between uni-polar and bipolar leads,provided
thebipolar
electrodes were equidistant from the source.
The wave form recordedby eithertype oflead would depend on the axis of the lead in the
UNIPOLAR LEIADS AND SPATIAL VECTORCARDIOGRAMS
A.
SPATIAL
VCG P.1. 597300 2-20-52FRONTAL VIEW SAGITTAL VIEW TRANSVERSE VIEW
.~~~~~~I
.
'1.0MV. .___._.
T .T
P
0.2 MV
SCALAR DERIVATION$ FROM V CB ___ ___
~s*3()* 120 +200 +2001 200 *We0 +40*01
As .0' +1200. 100 00 o +400qF 300 +I0. 00
C.
LOBaVCO LEADS VOG ECBV.
100
r~~~~~~~
0.2 it.00 4,miAn
2 :1
Fi. 9. Case 2. A 30 veatu old female waith clinictal evidence of rheumatic mitra..l stenosis. (A)
Spattaetr The (letails ofthe P and T loopsareshowathigheramlificationbelow
each view.Thesaittt ii viewisshowinas ifviewedfromnthepattlenit,'s right side.Thetrsvseview
isor~ienit,olSo th.t thecpatietnt's right,sidle liesto the reader'sleft,and thechiest walltowardi thelbot
-toml of the pae rosindicate (lirectioni ofrotation of theQRS1001). Thecathodle ray beam is
inl-ternluptelat1 intervalstolprovileatimescale,sothat 4 mnillisecondselapse fromthe beginning ofonie
(lashto thebeg"innlingyofthecnext. (B)ComlparisonlofUnlilolar1)t~ecoIr(lia.lleadlcs w~ith dclt(erivations5
froil thevl to criorm Allprecordial lead~sweretakenat theclevel of the fifthanterior Inttercost al
electrical field, the axis of unipolar leads
being
the line from the exploring electrode to the electrical nullpoint.
In the cases illustrated, and in our other cases, it appears that the complexes in uni-polar leads from the precordium or any other point on the body canbe interpreted in terms
of a relatively symmetric electrical field. The relative proximity of the exploring electrode
FIG.10. Case3.Unipolar precordial electrocardio-gramandscalarprojections ofthespatial vectorcar-diogramfromapatientwho hadclinicalevidence of acute myocardial infarction six weeks prior to this record. The characteristic Q and T waves appear inbothsetsofrecords,althoughthevectorcardiogram
wasrecorded fromleads distantfromtheprecordium.
to one part of the
myocardium
seems to be comparativelyunimportant
indetermining
the
general
form of thecomplexes.
The fact that the form ofprecordial
and otherunipolar
leads can be predicted from a spatial
vector-cardiogram which is recorded
by
leads at adistance from the
heart,
seems to us incom-patiblewiththe concept,foundinmanymodern textbooks ofelectrocardiography,
that the complexes inunipolar
precordial
leads repre-sent the electricalactivity
of the nearestportion of the heart.
This concept has arisen from an interpreta-tion, which we believe to be erroneous, of the experiments published by Wilson and his
co-workers.'1 These investigators showed in dogs that the potential variations recorded by uni-polar (V) leads atanypoint ontheprecordium were approximately the same as those re-corded by directunipolar leadsfromthe under-lying epicardium. From this they concluded that ". . . the potential variations of a pre-cordial electrode are determined to a very large extent by the potential variations of the elements of ventricular surface nearest it."'l2 This is somewhat misleading, for it implies that the electrical events in the nearest ele-ments of the myocardium are the principal factor in determining the complexes recorded byunipolarepicardial orprecordial leads. This was not the authors' intention, for they point out that even in direct epicardial unipolar leads the truly local effects are represented only by the "intrinsic deflection," and add "... although the excitation of the muscle in contact with the exploring electrode pro-duces a much larger and much more sudden fluctuation in the potential of this electrode thanthe excitation of any equal mass of muscle
at a greater distance from it, every unit of ventricularmuscle,without exception, produces action currents which contribute to the form of these
complexes."'2
Unquestionably, the contribution of each part of the myocardiummust be inversely proportional to its distance fromthe exploring electrode; the problem is to identify, in the complexes recorded from the body surface, the local contribution. Our data indicate that the effects contributed locally must be very small, since the general form of the complexes is the same as if they were distant projections of a single dipole.
It might be supposed that the slurring and notching frequently seen in precordial leads
space.Pwaveshave beenomitted. (C) Standardelectrocardiographleads. (D) Leads used to record thevectorcardiogram.The lead systemusedconsistsofbipolarleads withacommonelectrodeonthe back of therightshoulder. (E)Comparisonofthreeunipolar leads,taken inthe left midaxillary line
atdifferentlevels,withappropriatescalarderivations from thevectorcardiogram.Atthe level of the second anterior intercostal space theQRScomplexhas theconfigurationwhich thetheory of "semi-direct" leadsregardsascharacteristic of therightventricle,whileatthe level of the fifth intercostal space,itsform is that saidto occur inunipolar leads "facing" the leftventricle.4Ascanbe seen in the scalar vectorcardiograph derivations, these deflections can equally well be explained as pro-jections ofthe electrical activity of thewhole heart.
UNIPOLAR LEADS AND SPATIAL VECTORCARDIOGRAMS recorded by instruments with good
high-frequency response might be local effects, and would be absent from the vectorcardio-gram. This has not proved to be true in our cases, for in all instances the same slurring and notching appeared in scalar vectorcardio-graph derivations. This is consistent with the observations of Kossmann andhis co-workers,7 who found that notches in the complexes re-corded by intracardiac leads corresponded to
simultaneous notches orpeaks inall precordial and extremity leads. It is of interest that in our cases the timing of the notches within the QRS complex was occasionally slightly different in the precordial lead and in the vectorcardiogram, and discrepancies of this kindneed to bestudied more closely.
3. Clinical Interpretation of Unipolar Leads The clinical interpretation of unipolar pre-cordial leads rests on empiric foundations which have been gradually builtup from clini-cal and postmortem correlations. The theory that they are semidirect, or local, leads has been fitted into this empiric background with-out serious incompatibilities, but the validity of most current criteria for interpretation rests on empiric observations and does not depend on the validity of the "semidirect"
hypothesis.*
For this reason the demonstra-tion thatprecordial
leads actually represent summations of electrical activity in all parts of theheart,
rather thanpredominantly
local effects, would have little effect on their clinical interpretation.In case 3, for example, the pattern in the precordial leads is that which has been shown
empirically
to occur when there is infarction*One exception is themeasurement of thetiming
of the "intrinsicoid deflection" in precordial leads. Inexperimentalwork the intrinsic deflectionrecorded bycontiguousbipolarelectrodes incontact withthe myocardium is avalid indication of the time of
ar-rival ofexcitation, but the applicabilityof this
con-cepttounipolar leads from thebodysurface is open
toseriousquestion. IftheQRScomplexinthese leads represents a summation of events from all parts of theheart, then thepeakoftheR wave simply
indi-cates the time at which this summation reaches a
maximumpositivevalue. Itseemsdoubtful that this gives any useful information about theextentof the
wave ofdepolarization atthat instant.
of
the
anterior wall of the ventricles. We have learned torecognize the changes in the cardiac electrical field which infarcts in this location produce by the presence of characteristic Q waves and T waves in precordial leads, but it can be seen from the spatial vectorcardiogram and the scalar derivations from it that these electrical changes are not restricted to the precordium. The Q waves, therefore, are simply one aspectof the changes inthe electrical field throughout thebody,
and cannot beregarded
as a "view" of the electrically negative ven-tricular
cavity
through
a "window" of necrotic myocardium.The interpretation ofthe unipolar extremity leads, on the other hand, and their supposed advantagesover bipolarleads, havebeenbased largely on the semidirect hypothesis. Their use to determine anatomic rotation of the heart around various axes4 is a pertinent example. Ithas beendifficult totestthe valid-ity of this practice because there is no reliable method for determining anatomic rotation of the heartin vivo. However, strict adherenceto
thetheory leadsinsome cases tomostunusual conclusions, making it necessary, for example, to assume that the left ventricle lies to the right of the right ventricle.6 Our results sug-gest thatthe
unipolar
extremity leads are pre-dominantly influenced, not by the particular chamberthey
"face,"
butby
the axis of the lead in the electrical field of the heart. In this respect,therefore,
unipolar
extremity leads offer noadvantage
overbipolar
extremity leads.SUMMARY
1. A "panoramic
vectorcardiograph"
is described, which will present any desired view of the spatial vectorcardiogram on a cathode-ray oscilloscope. Theviewpoint ofthe observer may be changed at will by adjusting two con-trols calibrated in terms of his azimuth and elevation with respect to the nullpoint of thevectorcardiogram.
This instrument will also calculate and make scalar electrocardiograms representing projections of the spatial vector-cardiogram on any single axis.2. This device eliminates some of the prob-lems previously encountered in deriving scalar electrocardiograms from the spatial
cardiogram, since the necessary calculations are made automatically, and for any spatial axis.
3. In58 subjectsunipolarelectrocardiograms recorded from the precordium and other points
onthebody surfaceshowedaclose resemblance
to appropriate scalar derivations from the spatial vectorcardiogram. This was true even in cases of myocardial infarction, where the precordial leads showed changes previously thought to be "local effects" due to the prox-imity of the exploring electrode and the in-jured portion of myocardium.
4. Some of the previously reported dis-crepancies between precordial leads and the transverse vectorcardiogram can be shown to
be due to the fact that the electrical nullpoint lies relatively high in the thorax, so that the precordial lead positions lie in a plane which
cannot be compared directly with the trans-verse vectorcardiogram.
5. These results support the general hy-pothesis of Duchosal that for all body surface leads the electrical field of the heart
approxi-mates that of a single relatively small dipole in a homogeneous conducting medium. The form of the complexes in precordial and other unipolar leads appears to depend more onthe axis of the lead in the cardiac electrical field than on preferential conduction from one part of the heart to the exploring electrode.
ACKNOWLEDGMENTS
It is apleasure to acknowledge the contributions
ofMrs. R. A.Hess,who recordedandprocessed the
vectorcardiograms and electrocardiograms in this work, of Mr. Thomas G. Arnold, who designed
de-tails of the computing circuits and intermediate amplifiers,ofMXr.JohnHarper, whoconstructed the
electronic equipment, and of AL. L. W. Reynolds,
who built the coupled mounts of the sine-cosine
controls.
SUMARIO ESPAROL
A laextension que tomasprecordiales y otras unipolares son influenciadas por la proximidad del electrodo explorador a una porcion o la
otra del corazon es topico de considerable de-bate. Una aproximacioln al problema es de-terminar cuan cerca se pueden predecir las
tomas precordiales por medio de vectorcardio-gramas espaciales
registrados
contomas
rola.-tivamenteremotasdel corazon. El vectorcardio-grafo panoralmico ya citado provee un metodo
conveniente de demostrar esto, puesto que
automafticamente registra derivaciones
nutmeri-cas del vectorcardiograma para
cualquier
eje espacial. Los resultados indican que los efectos locales no son el factor predominante en la determinacion de la forma de los complejos precordiales.REFERENCES
1DUCHOSAL, P.
M.,
ANDSULZER,
R.: LaVecto-cardiographie. Basle, S. Karger, 1949.
2
DUCHOSAL,
P.W.,
AND GROSGURIN, J. R.: Thespatial vectorcardiogram obtained by use of a
trihedron and its scalar comparisons. Circula-tion 5:237, 1952.
3EINTHOVEN, W., FAHR, G., AND DE MVAART, A.: Uber die Richtung und _Manifeste Grosse der
Potentialscliwankungeninmenschlichen Herzen unduber denEinfluss der Herzlage aufdie Form des Elektrokardiogramnms. PflIgers Arch. ges. Physiol. 150: 275, 1913. Translated by Hoff, H. E., and Sekelj, P.: Am. Heart J. 40: 163, 1950.
GOLDBERGER, E.: Unipolar lead
electrocardiogra-phy, ed. 2. Philadelphia, Lea & Febiger, 1949. 5JOUVE,A., BUISSON, P., ALBOUY, A., VELASQUE, P., AND BERGIER, G.: La vectocardiographie
en clinique. Paris,Masson etCie, 1950. 6KoSSMANN, C. E., BERGER, A. R., BRUMLIK,J.,
AND BRILLER, S. A.: An analysis of causes of right axisdeviationbased partly onendocardial potentials of the hypertrophied right ventricle.
Am. HeartJ. 35: 309, 1948.
7-, ,RADER, B., BRUMLIK, J., BRILLER, S. A., AND DONNELLY, J. H.: Intracardiac and intra-vascular potentials resulting from electrical
ac-tivity of the normal human heart. Circulation
2:10, 1950.
8SCHMITT, 0. H.: Cathode-ray presentation of three-dimensional data. J. Applied Physics 18: 819, 1947.
-: Personal communication.
10WILSON, F. N., JOHNSTON, F. 1)., MACLEOD,
A. G., BARKER, P. S.: Electrocardiograms that
represent the potential variations of a single electrode. Am. Heart J. 9: 447, 1934.
1 -, ANDHILL, I. G.W.: Theinterpretationof
the galvanometric curves obtained when one electrode is distant from the heart and the
other near or in contact with the ventricular surface. II. Observations on the mammalian
heart. Am. Heart J. 10: 176, 1934.
12 , , ROSENBAUM, F. F.,ERLANGER, H.,
Koss-MANN,C. E., HECHT, H., COTRIM,N.,MENEZES
DE OLIVEIRA, R., SCARSI, R., AND BARKER, P.:
The precordial electrocardiogram. Am. Heart .. 27: 19, 1944.