Enhancing Confusion Entropy (CEN) for binary
and multiclass classification
Rosario Delgado1, J. David Nu´ñez-Gonza´lez ID2*
1 Department of Mathematics, Universitat Autònoma de Barcelona, Campus de la UAB, Cerdanyola del Vallès, Spain, 2 Department of Mathematics, University of the Basque Country (UPV/EHU), Leioa, Spain
Abstract
Different performance measures are used to assess the behaviour, and to carry out the comparison, of classifiers in Machine Learning. Many measures have been defined on the literature, and among them, a measure inspired by Shannon’s entropy named the Confusion Entropy (CEN). In this work we introduce a new measure, MCEN, by modifying CEN to avoid its unwanted behaviour in the binary case, that disables it as a suitable performance measure in classification. We compare MCEN with CEN and other performance measures, presenting analytical results in some particularly interesting cases, as well as some heuristic computational experimentation.
Introduction
Machine Learning is the subfield of Computer Science, as well as the branch of Artificial Intel-ligence, whose objective is to develop techniques that allow computers to learn. It has a wide range of applications, such as search engines or pattern recognition. Examples are: medical diagnosis, fraud detection, stock market analysis, classification of DNA sequences, recognition of speech and written language, images, games and robotics.
Machine learning tasks are typically grouped into two broad categories: Supervised and Unsupervised Learning. Classification falls in the former, since it deals with some input vari-ables (features or characteristics) and an output variable (the class), and uses an algorithm to infer the class of (that is, to classify) a new case from its known features. Different models are used to build classifiers. Decision Trees (J48, Random Forest), Rules (Decision Table, JRip, ZeroR), Neural Networks (Multilayer Perceptron, Extreme Learning Machines, RBFN), Sup-port Vector Machines, and Bayesian Networks (Naive Bayes, TAN) are some, although not the only ones, approximations to supervised classification.
Once a classifier is built, a performance measure is needed in order to assess its behaviour and to compare it with other classifiers. In the binary case, in which the class variable has only two labels or classes, there are several classical measures that have been widely used: Accuracy, Sensitivity, Specificity and F-score, only to mention some of the most commonly used. Not of all them allow a natural extension to the multi-class case (more than two labels), and only few measures have been specially designed for multi-class classification, which is a more complex scenario. Accuracy, by far the simplest and widespread performance measure a1111111111 a1111111111 a1111111111 a1111111111 a1111111111 OPEN ACCESS
Citation: Delgado R, Nu´ñez-Gonza´lez JD (2019) Enhancing Confusion Entropy (CEN) for binary and multiclass classification. PLoS ONE 14(1): e0210264.https://doi.org/10.1371/journal. pone.0210264
Editor: Francesco Ciccarello, Universita degli Studi
di Palermo Dipartimento di Fisica e Chimica, ITALY
Received: April 19, 2018 Accepted: December 15, 2018 Published: January 14, 2019
Copyright:©2019 Delgado, Nu´n˜ez-Gonza´lez. This is an open access article distributed under the terms of theCreative Commons Attribution License, which permits unrestricted use, distribution, and reproduction in any medium, provided the original author and source are credited.
Data Availability Statement: All relevant data are
within the paper and its Supporting Information files.
Funding: This work was supported by Ministerio
de Economı´a y Competitividad, Gobierno de España, MTM2015 67802-P to R.D. The funders had no role in study design, data collection and analysis, decision to publish, or preparation of the manuscript.
Competing interests: The authors have declared
in classification, extends seamlessly its definition in the binary case to multi-class classifica-tion. Another well known performance measure, formerly introduced in the binary case but that extends without problems, is Matthew’s Correlation Coefficient (MCC), introduced by Matthews in [1].
In this work, whose seed is [2], we focus on a different performance measure, named Con-fusion Entropy (CEN), which measures the uncertainty generated by classification, and has been recently introduced by Wang et al. in [3] as a novel measure for evaluating classifiers based on the concept of Shannon’s entropy. CEN measures generated entropy from misclassi-fied cases considering not only how the cases of each fixed class have been misclassimisclassi-fied into other classes, but also how the cases of the other classes have been misclassified as belonging to this class, as well as entropy inside well-classified cases. Given a set of non-negative num-bers, say {n1,. . .,nr}, the Shannon’s entropy generated by the set can be defined as the sum Pr
i¼1 pi logðpiÞ, withpi ¼ ni nifn¼
Pr
i¼1ni, where log can be, as usual, the logarithm in
base 2.
CEN is compared in [3] with Accuracy and other measures, showing a relative consistency with them: higher Accuracy tends to result in lower Confusion Entropy. This performance measure, which is more discriminating for evaluating classifiers than Accuracy, specially when the number or cases grows, has also been studied in [4], where the authors show the strong monotone relation between CEN and MCC, and that both, MCC and CEN, improve over Accuracy.
There are some works in the recent literature using Confusion Entropy. For example, in [5] the authors propose a novel splitting criterion based on CEN for learning decision trees with higher performance; experimental results on some data sets show that this criterion leads to trees with better CEN value without reducing accuracy. The authors of [6] and [7] use CEN, among other performance measures, to compare several common data mining methods used with highly imbalanced data sets where the class of interest is rare. Other works propose modi-fications of this measure, as [8], in which a Confusion Entropy measure based on a probabilis-tic confusion matrix is introduced, measuring if cases are classified into true classes and separated from others with high probabilities. A similar approach to that of [8] is followed in [9] to analyze the probability sensitivity of the Gaussian processes in a bankruptcy prediction context, by means of a probabilistic confusion entropy matrix based on the model estimated probabilities. In the context of horizontal collaboration, the system global entropy is intro-duced in [10] analogously to CEN (see also [11] and [12]), and it is used in the collaborative part of a clustering algorithm, which is iterative with the optimization process continuing as long as the system global entropy is not stable.
It is remarkable that CEN shows to have a weakness in the binary case that invalidates it as a suitable performance measure: in some situations CEN gets values larger than one, unlike what happens in the multi-class case, in which CEN ranges between zero and one. CEN is a measure of the “overall” entropy associated to the confusion matrix, that can be thought as generated by two sources: entropy within the main diagonal, and the one gener-ated by the values outside it, corresponding to misclassification. We will show that CEN is more sensible to the later. A second but not least important point in the weakness of the behaviour of CEN is its lack of monotonicity when the overall entropy does increase (or decrease) monotonously. Along the paper we will show different situations to stand out these items.
Our aim is to introduce an enhanced CEN measure, that we denote by MCEN, and com-pare it with CEN, MCC and Accuracy. This new measure will show to be highly correlated with CEN. Two aspects deserve to be highlighted:
1. definitions of probabilities involved in the construction of CEN have been modified in MCEN to improve interpretability as real probabilities,
2. weakness of CEN in the binary case (out-of-range and lack of monotonicity) are overcome with MCEN.
The paper is structured as follows: first we introduce the Modified Confusion Entropy MCEN and deal with the multi-dimensional perfectly symmetric and balanced case, which is deeply studied, performing a cross comparison between CEN, MCEN, Accuracy and MCC. The general binary case is treated next, focusing on different families of matrices and carrying out the corresponding cross comparisons. Next part is devoted to study theZAfamily of
confu-sion matrices. Then, we compare CEN, MCEN, Accuracy and MCC with two recently intro-duced measures: the Probabilistic Acuracy PACC ([13]) and the Entropy-Modulated Accuracy EMA ([14]). Finally, some experiments performed in the binary setting to compare CEN with MCEN through four real database sets are included in the Supporting Information file. These experiments show that their behaviour is mostly analog, but when it is not the case, MCEN is the one that behaves more according to entropy generated by misclassification. The paper fin-ishes with a conclusion section.
Methods
Given a multi-class classifier learned from a training dataset, withN�2 classes labelled {1, 2,. . .,N}, we apply it in order to classify cases from a testing dataset, that is, to infer the class of the cases from their known features or characteristics. Since for the cases in the testing dataset we actually know the class to which they belong, we can construct theN×Nconfusion matrix C= (Ci,j)i,j=1,. . .,N, which collects the results issued by the classifier over the testing dataset.Ci,j
is the number of cases of classithat have been classified as belonging to classj. We denote byS the sum of values of the matrix, that is, the total number of cases in the testing dataset,
S¼PNi¼1PNj¼1Ci;j.
We introduce notations OUT(C) and IN(C), respectively, to denote the Shannon’s entropy generated by the elements of outside (respectively, inside) the main diagonal of matrixC. That is, while IN is the entropy generated by the well classified cases, OUT is generated by misclassification.
In [3] the misclassification probability of classifying class-icases as being of classj“subject to classj”, denoted byPji;j, is introduced as:
Pji;j¼
Ci;j PN
k¼1ðCj;kþCk;jÞ
; i;j¼1; :::;N;i6¼j; ð1Þ
that is,Pji;jis “almost” the relative frequency class-icases that are classified as being of classj
among all cases that are of classjor that have been classified as being of classj. But not exactly. The reason is that class-jcases that have been correctly classified, whose number isCj,j, are
counted twice in the denominator.
Analogously, the misclassification probability of classifying class-icases as being of class-j “subject to classi”, with analogous interpretation, denoted byPi
i;j, is defined in the same paper
by: Pi i;j¼ Ci;j PN k¼1ðCi;kþCk;iÞ ; i;j¼1; :::;N;i6¼j: ð2Þ
Then, the Confusion Entropy associated to classjis defined in [3] by: CENj¼ XN k¼1;k6¼j ðPjj;klog2ðN 1ÞðP j j;kÞ þP j k;jlog2ðN 1ÞðP j k;jÞÞ ð3Þ
with the conventionalogb(a) = 0 ifa= 0. Finally, the overall Confusion Entropy associated to
the confusion matrixCis defined as a convex combination of the Confusion Entropy of the classes as follows:
CEN¼X
N
j¼1
PjCENj; ð4Þ
where the non-negative weightsPj, summing 1, are
Pj ¼ PN
k¼1ðCj;kþCk;jÞ 2PNk;‘¼1Ck;‘
: ð5Þ
Note that CEN is an invariant measure; if we multiply all elements of the confusion matrix by a constant we obtain the same result. The same convenient and useful property holds with Accuracy, MCC and the modified Confusion Entropy measure MCEN, that we will introduce below. As MCC lives in [−1, 1] while Accuracy, CEN and MCEN range in [0, 1], we scale MCC and introduceMCC�
¼1 MCC
2 2 ½0;1�. Besides, since Accuracy usually has an inverse
relationship with both CEN and MCEN, we choose to consider ACC�= 1–Accuracy instead of Accuracy itself.
ForN>2, CEN ranges between 0 and 1, 0 is attained with perfect classification (the off-diagonal elements of matrixCbeing zero), while 1 under complete misclassification, symmetry and balance inC, that is, if all diagonal elements inCare zero, and the off-diagonal elements take all the same value. In the binary case (N= 2), although CEN remains to be 0 with perfect classification, and is 1 under complete misclassification with symmetry, in intermediate sce-narios we can also obtain CEN = 1 and even higher values. That is, in some cases CEN is out-of-range. See, for example, the confusion matrices inTable 1, which have already been consid-ered in [4]. The lack of monotonicity when the situation monotonously goes from perfect clas-sification to completely symmetric and balanced misclasclas-sification, as showed by the sequence of matrices inTable 1, represents a great inconvenience of CEN in the binary case, and is our main motivation for introducing a modified version of it.
Definition
Instead of (1), we propose to introduce the probability of classifying class-icases in classj “sub-ject to classj”, as ~ Pji;j¼ Ci;j PN k¼1ðCj;kþCk;jÞ Cj;j ; i;j¼1; :::;N; i6¼j:
Table 1. Examples in the perfectly symmetric and balanced binary case withS= 12. Only CEN values.
6 0 0 6 ! 5 1 1 5 ! 4 2 2 4 ! 3 3 3 3 ! 2 4 4 2 ! 1 5 5 1 ! 0 6 6 0 ! CEN = 0.0000 0.5975 0.8617 1.0000 1.0566 1.0525 1.0000 https://doi.org/10.1371/journal.pone.0210264.t001
that is, we overcome the fact that in (1) correctly classified class-jcases are counted twice in the denominator. With this definition,P~ji;jis really the relative frequency of class-icases
classi-fied as belonging to classjamong all cases that are of classjor that have been classified as being of classj. Analogously, we modify definition (2) in the same sense:
~ Pi i;j¼ Ci;j PN k¼1ðCi;kþCk;iÞ Ci;i ; ;i;j¼1; :::;N;i6¼j; andP~i
i;jis really the relative frequency of class-icases classified in classjamong all cases that
are of classior that have been classified as being of classi.
Next, we modify definition of the weights in (5) in the following way:
~ Pj ¼ PN k¼1ðCj;kþCk;jÞ Cj;j 2PNk;‘¼1Ck;‘ a PN k¼1Ck;k ; where a¼ 1=2 ifN¼2 1 ifN>2: (
Then, we define the Confusion Entropy associated to classjas in (3) by
MCENj¼ XN k¼1;k6¼j ðP~jj;klog2ðN 1ÞðP~ j j;kÞ þP~ j k;jlog2ðN 1ÞðP~ j k;jÞÞ;
and the modified Confusion Entropy as in formula (4), that is,
MCEN¼X
N
j¼1
~
Pj MCENj: ð6Þ
Note that whenN>2; PNj¼1P~j¼1, so the modified overall Confusion Entropy is also
defined as a convex combination of the modified Confusion Entropy corresponding to the classes, while in the binary case (N= 2), it is just defined as a conical combination since although the weightsP~jare non-negative, they do not necessarily sum up to 1 (indeed, their
sum is 1 if and only if all the diagonal elements of the confusion matrixCare zero, that is, if all cases have been misclassified).
We see from (4) and (6) that both measures CEN and MCEN, are decomposable along clas-ses, which makes it easy to assess the effect on the behaviour of the classifier of a simple modifi-cation affecting just one class.
We can start performing a preliminary comparison of the behaviour of ACC�, MCC�, CEN
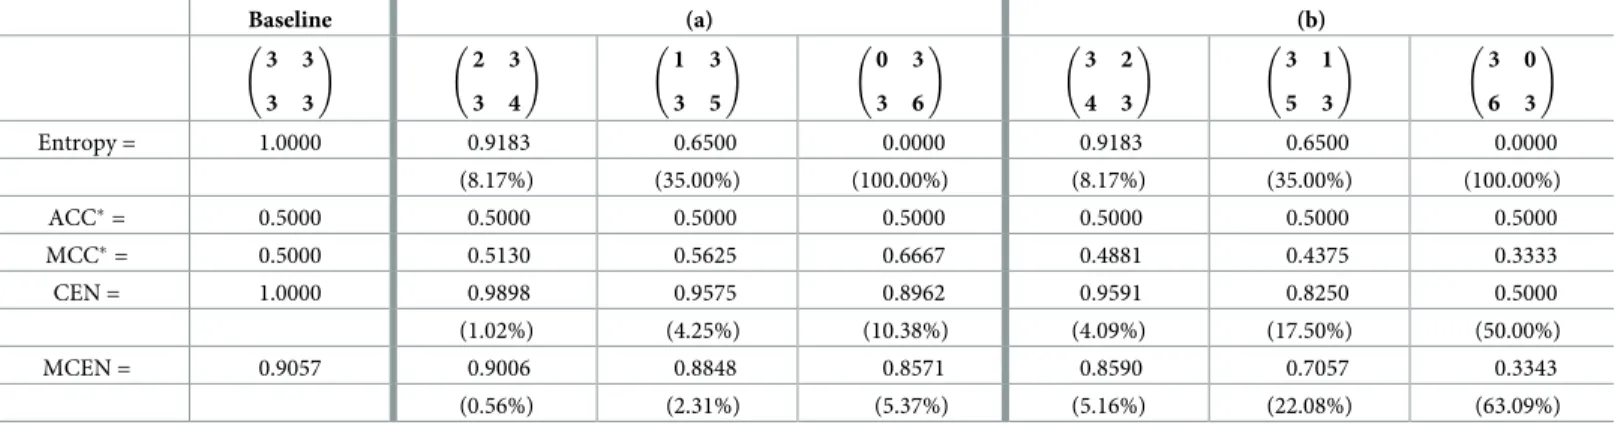
and MCEN in the toy example in dimension 2 ofTable 2. In this example, the baseline confu-sion matrix is constant with all its entries equal to 3. First, maintaining the total sum equal to S= 12 and the out-diagonal invariant, we reduce the entropy IN inTable 2(a). In the baseline case, the diagonal elements are the set {3, 3}, whose entropy is 1 (maximum value). The corre-sponding values of IN in case (a) are consigned inTable 2, in a decreasing order. Analogously forTable 2(b)but in this case changes have been introduced outside the main diagonal. We observe that while ACC�remains insensitive to changes in the arrangement of the elements of
the matrix, since the sum of the main diagonal remains constant, MCC�only decreases with decreasing entropy OUT, while when IN decreases, its value increases. As far as their interpre-tation is concerned, both CEN and MCEN measure the overall entropy of the confusion
matrix, giving less weight to the IN entropy, that is, that generated by the well classified cases, than to OUT entropy, corresponding to misclassification. In this example we observe how their values are reduced when IN decreases, maintaining its constant sum, or when the one that is reduced is OUT, but in this second case the reduction is much more drastic, both for CEN and MCEN, and more sharply for the second. The main difference between CEN and MCEN in this sense is that the former is more sensitive to changes of IN entropy than MCEN, while less than CEN to that of OUT (observe the percentages in brackets inTable 2, which are the relative reduction in the measure with respect to that of the baseline case).
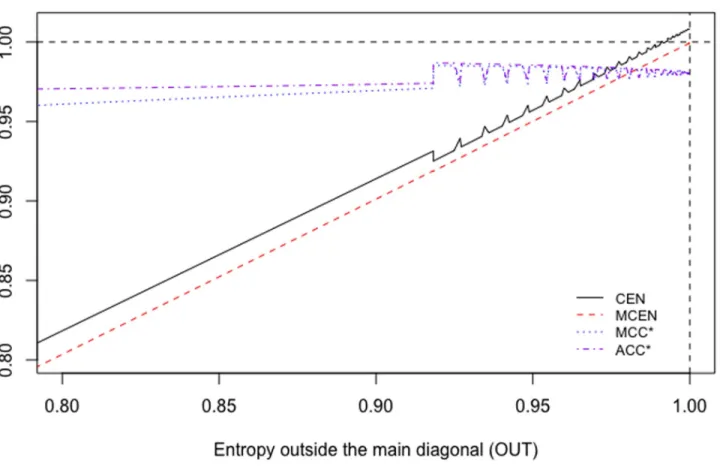
We can extend this comparison to matrices of typeMA¼
1 50
A 1 !
, withA= 1,. . ., 100, for example. Their main diagonal stays constant.Fig 1shows the behaviour of CEN, MCEN, ACC�and MCC�as OUT increases. We can observe that indeed, CEN is less correlated with this entropy than MCEN. The same can be observed from the correlations matrix given in
Table 3.
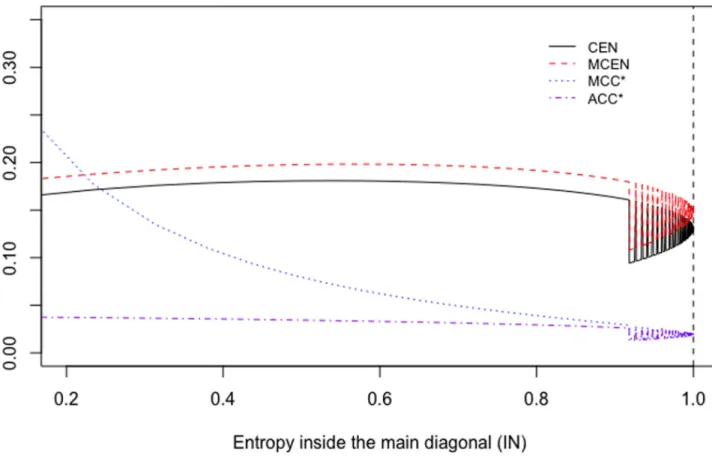
Instead, if we consider matricesWA¼
50 1
1 A
!
, withA= 1,. . ., 100, the values outside the main diagonal stay constant.Fig 2shows the behaviour of CEN, MCEN, ACC�and MCC� as IN increases. CEN shows more correlation with this entropy than MCEN (seeTable 4), although IN is less correlated (and in an inverse sense that could not be appreciated in the toy example ofTable 2) than OUT, both with CEN and MCEN.
The perfectly symmetric and balanced case
In this section we consider the case in whichCi,j=Ffor alli,j= 1,. . .,N,i6¼jandCi,i=T,
withT�0,F>0, that is,C¼
T F . . . F F F T . . . F F .. . .. . . . . ... ... F F . . . T F F F . . . F T 0 B B B B B B B B @ 1 C C C C C C C C A .
Table 2. Toy example: Binary case withS= 12. (a): Entropy reduction within the main diagonal, IN. (b) Entropy reduction outside the main diagonal, OUT. In brackets
the relative reduction in each measure with respect to the baseline case. Entropy refers to IN in (a) and to OUT in (b).
Baseline (a) (b) 3 3 3 3 ! 2 3 3 4 ! 1 3 3 5 ! 0 3 3 6 ! 3 2 4 3 ! 3 1 5 3 ! 3 0 6 3 ! Entropy = 1.0000 0.9183 0.6500 0.0000 0.9183 0.6500 0.0000 (8.17%) (35.00%) (100.00%) (8.17%) (35.00%) (100.00%) ACC�= 0.5000 0.5000 0.5000 0.5000 0.5000 0.5000 0.5000 MCC�= 0.5000 0.5130 0.5625 0.6667 0.4881 0.4375 0.3333 CEN = 1.0000 0.9898 0.9575 0.8962 0.9591 0.8250 0.5000 (1.02%) (4.25%) (10.38%) (4.09%) (17.50%) (50.00%) MCEN = 0.9057 0.9006 0.8848 0.8571 0.8590 0.7057 0.3343 (0.56%) (2.31%) (5.37%) (5.16%) (22.08%) (63.09%) https://doi.org/10.1371/journal.pone.0210264.t002
Proposition 1In the perfectly symmetric and balanced case, If N>2; CEN¼2ðN 1Þ
d log2ðN 1ÞðdÞ; MCEN¼2ðN 1Þ~dlog2ðN 1ÞðdÞ~; If N¼2; CEN¼ 1 1þg log2ðdÞ; MCEN¼ 1 1þ3 4g log2ð~dÞ; ð7Þ where g¼T F�0; d¼2ðN 1Þ þ2g>0 and ~d¼2ðN 1Þ þg>0; ACC� ¼ N 1 gþ ðN 1Þ and MCC � ¼ N 2ðgþ ðN 1ÞÞ¼ N 2ðN 1ÞACC � : Fig 1. CEN, MCEN, ACC�and MCC�for matrixMA, as function of entropy outside the diagonal.
https://doi.org/10.1371/journal.pone.0210264.g001
Table 3. Correlation matrix (Pearson) for the measures of the family of matricesMA,A= 1,. . ., 100.
CEN MCEN MCC� ACC� OUT
CEN 1.0000000 0.9999334 0.9229026 0.7783573 0.9999320 MCEN 1.0000000 0.9233945 0.7855300 0.9999963 MCC� 1.0000000 0.7340543 0.9241870 ACC� 1.0000000 0.7852756 OUT 1.0000000 https://doi.org/10.1371/journal.pone.0210264.t003
Note that ACC�, MCC�, CEN and MCEN depend on the matrix valuesTandFonly
through its ratioγ. In (7) (caseN>2), CEN and MCEN have the same expression except that CEN depends onδ, which is function of 2γ, while MCEN does ond~¼d g, which is the same function but ofγ. Therefore,
ifN>2; MCENð2gÞ ¼CENðgÞ;
where in the notation we highlight the dependency of CEN and MCEN onγ.
Corollary 1In the perfectly symmetric and balanced case, we have that:
Fig 2. CEN, MCEN, ACC�and MCC�for matrixWA, as function of entropy inside the diagonal.
https://doi.org/10.1371/journal.pone.0210264.g002
Table 4. Correlation matrix (Pearson) for the measures of the family of matricesWA,A= 1,. . ., 100.
CEN MCEN MCC� ACC� IN
CEN 1.0000000 0.9995962 0.5499231 0.9672182 -0.6062876 MCEN 1.0000000 0.5355098 0.9609698 -0.5857654 MCC� 1.0000000 0.7340543 -0.9241870 ACC� 1.0000000 -0.7852756 IN 1.0000000 https://doi.org/10.1371/journal.pone.0210264.t004
• For any N>2, CEN, MCEN, ACC�andMCC�are monotonically decreasing functions ofγ�
0,with
lim
g!þ1CENðgÞ ¼g!þ1limMCENðgÞ ¼g!þ1limACC
�
ðgÞ ¼ lim
g!þ1MCC �
ðgÞ ¼0;
CENð0Þ ¼MCENð0Þ ¼ACC�
ð0Þ ¼1; MCC� ð0Þ ¼ N 2ðN 1Þ! 1 2as N! þ1; and ifγ>0, MCC� <ACC� <CEN<MCEN.
• Nevertheless, when N= 2,we have that althoughMCENandACC�= MCC�remain to be
monotonically decreasing as functions ofγ�0, CENdoes not.Indeed, CENachieves its global maximum wheng¼e 2 1,which isCEN e 2 1 � �1:06148>1.More specifically,
CENð0Þ ¼CENð1Þ ¼1; CENðgÞ>1; for all 0<g<1; lim
g!þ1CENðgÞ ¼0; MCENð0Þ ¼1; lim g!þ1MCENðgÞ ¼0; ACC� ð0Þ ¼MCC� ð0Þ ¼1; lim g!þ1ACC � ðgÞ ¼ lim g!þ1MCC � ðgÞ ¼0:
Moreover, there existsγ0�5.78such that MCC�
¼ACC�
<MCEN<CEN if 0<g<g0;
MCC�
¼ACC�
<MCEN¼CEN if g¼g0; and
MCC�
¼ACC�
<CEN<MCEN if g>g0:
Proof 1The proofs of both Proposition 1 and Corollary 1 are straightforward, and then
omitted. However, it is worth mentioning that in order to proveCEN<MCENin case N>2 we use that function fðxÞ ¼1
x logbðxÞis strictly decreasing for any base b>1(in our case, b=
2(N−1)�4),and x>e.We apply that fact to see that f(x0)>f(x1)with x0= 2(N−1) +γ<
x1= 2(N−1) + 2γ,since x0�4>e.
The same property of function f allows to prove that bothCENand MCEN are monotonically decreasing as functions ofγ, with x=δ= 2(N−1) + 2γand x¼d~¼2ðN 1Þ þg,respectively, being both>e for anyγ�0.Note that since for N= 2the expression ofCENas function ofδis as in case N>2,the monotonous decrease fails since x=δ= 2 + 2γ<e forg<e
2 1.
The rest of proofs are also omitted.
Remark 1Note that if N= 2, CENexhibits the unwanted behaviour, not showed byMCEN,
of being out-of-range[0, 1],which despairs for N>2(seeFigs3and4).
Remark 2Consider the particular case in which T=F, that is,γ= 1.In other words, the
con-fusion matrix is constant, say
1 1 . . . 1 .. . .. . . . . ... 1 1 . . . 1 0 B B @ 1 C C
A.Then,ACC� ¼NN1andMCC� ¼
1 2. More-over,δ= 2N and~d¼2N 1. If N>2,CEN¼ 1 1 N �
log2ðN 1Þð2NÞandMCEN¼ 1
1 2N 1
�
log2ðN 1Þð2N 1Þ: If N= 2, CEN = 1andMCEN¼4
7 log2ð3Þ<1:
As a consequence, we can easily check that if N>2, MCC�<ACC�<CEN<MCEN,with limN!+1ACC�= limN!+1CEN = limN!+1MCEN = 1,while if N= 2, MCC�= ACC�<
Fig 3. The symmetric case. CEN, MCEN, ACC�and MCC�forγ2[0, 10], withN= 2.
https://doi.org/10.1371/journal.pone.0210264.g003
Fig 4. The symmetric case. CEN, MCEN, ACC�and MCC�forγ2[0, 10], withN= 3.
https://doi.org/10.1371/journal.pone.0210264.g004
The particular pathological case of matricesZAwill be studied in the multi-class setting, but
before we consider in some detail the binary case.
The general binary case
The binary case (N= 2) can be studied in more detail. We will use the following notation for the confusion matrix in the most general setting, taking class 1 as reference:
C¼
TP FN FP TN
!
; ð8Þ
whereTPis the true positive or number of class-1 cases that have been correctly classified, and the same for the true negative number of casesTNwith class 2. On the other hand,FPdenotes false positives or number of class-2 cases that have been miscllassified, andFNfalse negatives.
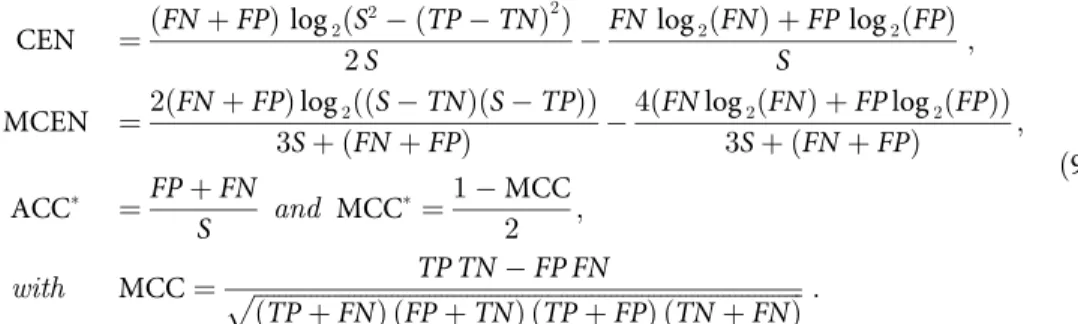
Proposition 2If the confusion matrix C is given by(8),we have that with S=TP+TN+FP
+FN, CEN ¼ðFNþFPÞlog2ðS 2 ðTP TNÞ2 Þ 2S FN log2ðFNÞ þFPlog2ðFPÞ S ; MCEN ¼2ðFNþFPÞlog2ððS TNÞðS TPÞÞ 3Sþ ðFNþFPÞ 4ðFNlog2ðFNÞ þFPlog2ðFPÞÞ 3Sþ ðFNþFPÞ ; ACC� ¼FPþFN S and MCC � ¼1 MCC 2 ; with MCC¼ ffiffiffiffiffiffiffiffiffiffiffiffiffiffiffiffiffiffiffiffiffiffiffiffiffiffiffiffiffiffiffiffiffiffiffiffiffiffiffiffiffiffiffiffiffiffiffiffiffiffiffiffiffiffiffiffiffiffiffiffiffiffiffiffiffiffiffiffiffiffiffiffiffiffiffiffiffiffiffiffiffiffiffiffiffiffiffiffiTP TN FP FN ðTPþFNÞ ðFPþTNÞ ðTPþFPÞ ðTNþFNÞ p : ð9Þ
To carry out a deeper study, we have to consider particular situations; is what we do in the subsections below, where different particular scenarios have been introduced and developed.
The perfectly symmetric and balanced case. Table 5below shows some examples of
2×2 confusion matrices of type T F F T
!
, that is, in whichTP=TN=TandFP=FN=F. All of them correspond toS= 12 and have already been considered in [4]. This is a particular case of the previously considered setting, and Proposition 1 and Corollary 1 apply here. We can observe again the anomalous behaviour of CEN, in contrast with the other measures.
The symmetric but unbalanced familyUA. Consider the particular case of a confusion
matrix of typeUA¼
1 A
A 0 !
, withA>0. Both class-1 and class-2 cases are mainly misclas-sified ifA>1. Entropy out of the main diagonal is 1 and within the diagonal is 0, regardless of the value ofA. When 0<A<1, say for example thatA= 1/BwithB>1, then matrixUAis
equivalent to B 1
1 0
!
, that is, corresponds to an unbalanced scenario in which class 2 is Table 5. Examples in the perfectly symmetric and balanced binary case withS= 12.
6 0 0 6 ! 5 1 1 5 ! 4 2 2 4 ! 3 3 3 3 ! 2 4 4 2 ! 1 5 5 1 ! 0 6 6 0 ! ACC�= MCC�= 0.0000 0.1667 0.3333 0.5000 0.6667 0.8333 1.0000 CEN = 0.0000 0.5975 0.8617 1.0000 1.0566 1.0525 1.0000 MCEN = 0.0000 0.5910 0.8000 0.9057 0.9614 0.9891 1.0000 https://doi.org/10.1371/journal.pone.0210264.t005
underrepresented and class-1 cases are mainly well classified. We can observe some properties of CEN, MCEN, ACC�
and MCC�
(seeFig 5) in Proposition 3, which is derived from Proposi-tion 2.
Proposition 3For confusion matrix UAwith A>0,we have:
CENðAÞ ¼Alog2ðð2Aþ1Þ 2
1Þ 2Alog2ðAÞ
2Aþ1 ;
MCENðAÞ ¼4Alog2ð2Að2Aþ1ÞÞ 8Alog2ðAÞ
3ð2Aþ1Þ þ2A ; ACC� ðAÞ ¼ 2A 2Aþ1; MCC � ðAÞ ¼ 2Aþ1 2ðAþ1Þ: As a consequence:
CEN(A)<1if A<1, CEN(1) = 1, CEN(A)>1if A>1, MCEN(A)<1andACC�(A)< MCC�(A)<1,for all A>0, MCEN, ACC�andMCC�are monotonically increasing functions
of A>0, CENis not, and achieves its global maximum when A�2.54,which is>1,
lim
A!0CENðAÞ ¼limA!0MCENðAÞ ¼limA!0ACC
� ðAÞ ¼0<lim A!0MCC � ðAÞ ¼0:5, lim
A!þ1CENðAÞ ¼A!þ1lim MCENðAÞ ¼Alim!þ1ACC �
ðAÞ ¼ lim
A!þ1MCC �
ðAÞ ¼1:
Fig 5. FamlilyUA. CEN, MCEN, ACC�and MCC�forA2(0, 10].
https://doi.org/10.1371/journal.pone.0210264.g005
Moreover, there exists A02(0, 1)(indeed, A0�0.24) such that MCENðAÞ<CENðAÞ if A>A0;
MCENðA0Þ ¼CENðA0Þ;
MCENðAÞ>CENðAÞ if 0<A<A0:
The overall entropy associated to the four elements of the confusion matrix, which results to be 2A
2Aþ1 log
A
2Aþ1
� �
, increases to 1 whenA!+1and decreases to 0 whenA!0, and both CEN and MCEN, are sensible to this fact. Note that the lack of monotonicity of CEN(A) asA(and then, as the overall entropy) monotonically increases, is an anomalous behaviour that MCEN has managed to overcome. Moreover, MCEN ranges between 0 and 1. We can also observe this phenomenon in the examples inTable 6.
The asymmetric familyVA. Consider the particular case of confusion matrices of type
VA¼
1 A
1 0
!
, withA>0. This is an asymmetric and unbalanced case in which class 2 is systematically misclassified and is underrepresented ifA>1. Class 1 is also mainly misclassi-fied ifA>1. AsA!+1, entropy out the diagonal, which is A
Aþ1 logð
A
Aþ1Þ, decreases to
zero. Entropy within diagonal is zero, while the overall entropy of the elements of matrixVAis logðAþ2Þ A
Aþ2 logðAÞ, which tends to 0 asA!+1. When 0<A<1 withA= 1/B,
B>1, matrixVAis equivalent to
B 1
B 0 !
, which corresponds to an almost balanced but asymmetric scenario in which class 1 is mainly well classified but class 2 is not. AsBincreases (A!0), entropy out the diagonal also drops to zero. Some properties of CEN, MCEN, ACC� and MCC�are given in Proposition 4 (see alsoFig 6).
Proposition 4For confusion matrix VAwith A>0,we have:
CENðAÞ ¼ðAþ1Þlog2ððAþ2Þ 2
1Þ 2Alog2ðAÞ
2ðAþ2Þ ;
MCENðAÞ ¼2ðAþ1Þlog2ððAþ1Þ ðAþ2ÞÞ 4Alog2ðAÞ
3ðAþ2Þ þ ðAþ1Þ ; ACC� ðAÞ ¼Aþ1 Aþ2; MCC � ðAÞ ¼ 1þ ffiffiffiffiffiffiffiffiffiffiffi A 2ðAþ1Þ q 2 :
As a consequence, there exists A12(1, 2) (A1�1.414)such that:
CEN(A)>1if1<A<A1, CEN(1) = CEN(A1) = 1, CEN(A)<1if A2=[1,A1], MCEN(A)
<1, ACC�(A)<1, MCC�(A)<1andMCEN(A)<CEN(A)for all A>0, Table 6. Examples in the binary case for famlilyUA.
103 1 1 0 ! 102 1 1 0 ! 10 1 1 0 ! 1 1 1 0 ! 1 10 10 0 ! 1 102 102 0 ! 1 103 103 0 ! A = 1/103 1/102 1/10 1 10 102 103 ACC�= 0.00200 0.01961 0.16667 0.66667 0.952381 0.995025 0.9995002 MCC�= 0.50050 0.50495 0.54545 0.75000 0.954545 0.995050 0.9995005 CEN = 0.01194 0.08488 0.45495 1.00000 1.017859 1.002167 1.0002210 MCEN = 0.01459 0.09964 0.48263 0.93999 0.997778 0.9998483 0.9999856 https://doi.org/10.1371/journal.pone.0210264.t006
lim A!0MCC � ðAÞ ¼lim A!0ACC � ðAÞ ¼1 2>limA!0CENðAÞ ¼ log2ð3Þ 4 >limA!0MCENðAÞ ¼ 2 7, lim A!þ1ACC � ðAÞ ¼1> lim A!þ1MCC � ðAÞ ¼2þ ffiffiffi 2 p
4 >Alim!þ1CENðAÞ ¼Alim!þ1MCENðAÞ ¼0: Note that as in previous cases, CEN(A) does not stay always (that is, for anyA>0) restricted to [0, 1], while MCEN does. SeeFig 6and some examples inTable 7.
Apart from the fact that CEN is out-of-range for some values ofA, its behaviour is similar to that of MCEN, both decreasing with entropy, while nor ACC�nor MCC�are sensitive to
the decrease of entropy whenA!+1. Fig 6. FamilyVA. CEN, MCEN, ACC�and MCC�forA2(0, 10].
https://doi.org/10.1371/journal.pone.0210264.g006
Table 7. Examples in the binary case for famlilyVA.
103 1 103 0 ! 102 1 102 0 ! 10 1 10 0 ! 1 1 1 0 ! 5 6 5 0 ! 1 10 1 0 ! 1 102 1 0 ! 1 103 1 0 ! A = 1/103 1/102 1/10 1 1.2 10 102 103 ACC�= 0.5002 0.5025 0.5238 0.6667 0.6875 0.9167 0.9902 0.9990 MCC�= 0.5112 0.5352 0.6066 0.7500 0.7611 0.8371 0.8518 0.8535 CEN = 0.4019 0.4361 0.6217 1.0000 1.0041 0.5133 0.0934 0.0128 MCEN = 0.2921 0.3309 0.5387 0.9400 0.9429 0.4702 0.0866 0.0121 https://doi.org/10.1371/journal.pone.0210264.t007
The symmetric but unbalanced familyXA,r. Now we introduce the family of confusion
matricesXA;r¼
A r A r A 1
!
, withA,r>0. Both class-1 and class-2 cases are mainly misclassi-fied ifA,r>1. Overall entropy ofXA,ris ð2rþ1AÞAþ1 logð
A ð2rþ1ÞAþ1Þ 2r A ð2rþ1ÞAþ1 logð r A ð2rþ1ÞAþ1Þ,
which drops to 0 whenA!0, and whenA!+1converges to logð2rþ1Þ 2r
2rþ1 logðrÞ,
which in turn converges to 1 asr!+1. FixedA>0, overall entropy converges to 1 as r!+1, and asr!0, it converges to A
Aþ1 log
A Aþ1
� �
, which in turn converges to 0 both when A!0 and whenA!+1.
When 0<A<1,A= 1/BwithB>1, matrixXA,ris equivalent to
1 r
r B
!
. We have some properties of CEN, MCEN, ACC�and MCC�in Proposition 5 below. Moreover, for r= 0.5, 5 Figs7and8show how the measures evolve as function ofA, while Figs9and10
show their plots as function ofr, fixedA= 0.5, 10.
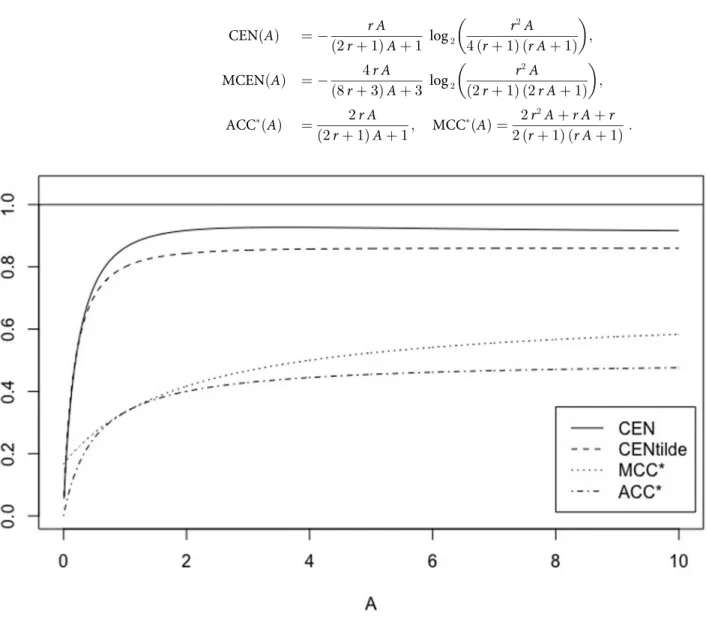
Proposition 5For confusion matrix XA,rwith A,r>0we have:
CENðAÞ ¼ r A ð2rþ1ÞAþ1 log2 r2A 4ðrþ1Þ ðr Aþ1Þ � � ; MCENðAÞ ¼ 4r A ð8rþ3ÞAþ3 log2 r2A ð2rþ1Þ ð2r Aþ1Þ � � ; ACC�ðAÞ ¼ 2r A ð2rþ1ÞAþ1; MCC � ðAÞ ¼ 2r 2A þr Aþr 2ðrþ1Þ ðr Aþ1Þ:
Fig 7. FamilyXA,r. CEN, MCEN, ACC�and MCC�as function ofA>0 forr= 0.5.
As a consequence,‘CENðrÞ ¼limA!þ1CENðAÞ ¼ r 2rþ1 log2 4ðrþ1Þ r �
>0,and there exists r0<1
(r0�0.8)such that for any r>r0,there exists Ar>0such thatCEN(A)<1if A<Ar, CEN
(Ar) = 1, CEN(A)>1if A>Arand ‘CENðrÞ >1 if r>1; ¼1 if r¼1; <1 if r0 <r<1: 8 > > > < > > > :
If r�r0, CEN(A)�1for any A>0and ℓCEN(r)<1.
On the other hand, for any r>0,
MCEN(A)<1, ACC�(A)<1andMCC�(A)<1,for all A>0, MCEN, ACC�andMCC�
are monotonically increasing functions of A, CENis not, and has a global maximum, which is> 1if r>r0,lim
A!0CENðAÞ ¼limA!0MCENðAÞ ¼limA!0ACC
� ðAÞ ¼0; lim A!0MCC � ðAÞ ¼ r 2ðrþ1Þ, 0< lim A!þ1ACC � ðAÞ ¼ 2r 2rþ1<Alim!þ1MCC � ¼ 2rþ1 2ðrþ1Þ¼‘MCC�ðrÞ<1, 0< lim A!þ1MCENðAÞ ¼ 4r 8rþ3log2 2ð2rþ1Þ r � � ¼‘MCENðrÞ<1; lim r!þ1‘MCENðrÞ ¼1. Fig 8. FamilyXA,r. CEN, MCEN, ACC�and MCC�as function ofA>0 forr= 5.
https://doi.org/10.1371/journal.pone.0210264.g008
Moreover, there exist0<r3<r2<r1<r0<1 (r3�0.13,r2�0.15,r1�0.23)such that: ‘MCCðrÞ> ‘MCENðrÞ> ‘CENðrÞ if 0<r<r3; ‘MCCðrÞ ¼‘MCENðrÞ> ‘CENðrÞ if r¼r3; ‘MCENðrÞ> ‘MCCðrÞ> ‘CENðrÞ if r3 <r<r2; ‘MCENðrÞ> ‘MCCðrÞ ¼‘CENðrÞ if r¼r2; ‘MCENðrÞ> ‘CENðrÞ> ‘MCCðrÞ if r2 <r<r1; ‘MCENðrÞ ¼‘CENðrÞ> ‘MCCðrÞ if r¼r1; ‘CENðrÞ> ‘MCENðrÞ> ‘MCCðrÞ if r>r1: 8 > > > > > > > > > > > > > > > > > > < > > > > > > > > > > > > > > > > > > :
Finally, for any fixed, A>0,while MCEN, ACC�andMCC�are monotonically increasing func-tions of r, CENis not, as can be seen inFigs9and10,for two values of A.Given A>0,there exists rA>r0such thatCEN(A)>1for all r>rA.
Note that although we do not specify it in the notations so as not to complicate them, the performance measures depend on bothAandrin the case of this doubly indexed familyXA,r.
The asymmetric familyYA,r. Finally, we consider another particular doubly indexed
family of confusion matrices in the binary case, with the same overall entropy asXA,r,
denoted byYA,r, withA,r>0. We define this family byYA;r ¼
r A r A A 1
!
. Class-2 is Fig 9. FamilyXA,r. CEN, MCEN, ACC�and MCC�as function ofr>0 forA= 0.5.
underrepresented and mainly misclassified ifA,r>1, while class-1 cases are classified “at ran-dom”, that is, a class-1 case has the same probability to be classified into any of the two classes. Although entropy is as forXA,r, we will see that performance measures behave in a different
way for this family of confusion matrices. When 0<A<1,A= 1/BwithB>1, then matrix YA,ris equivalent to
r r
1 B
!
. In Proposition 6 we give some properties of CEN, MCEN, ACC�and MCC�. See inFig 11forr= 0.1, inFig 12forr= 0.8, and seeFig 13for a plot of them as function ofr, fixedA= 10.
Proposition 6For confusion matrix YA,rwith A,r>0we have:
CENðAÞ ¼ðrþ1ÞAlog2ðððrþ1ÞAþ2Þð3rþ1ÞÞ þ ðr 1ÞAlog2ðAÞ 2rAlog2ðrAÞ
2ðð2rþ1ÞAþ1Þ ;
MCENðAÞ ¼2ððrþ1ÞAlog2ðððrþ1ÞAþ1Þð2rþ1ÞÞ þ ðr 1ÞAlog2ðAÞ 2rAlog2ðrAÞÞ
3ðð2rþ1ÞAþ1Þ þ ðrþ1ÞA ; ACC� ðAÞ ¼ ðrþ1ÞA ð2rþ1ÞAþ1; MCC � ðAÞ ¼ 1 ffiffiffiffiffiffiffiffiffiffiffiffiffiffiffiffiffiffiffiffiffiffiffiffiffiffiffiffiffiffiffirð1 AÞ 2rðAþ1Þ ðrþ1Þ ðr Aþ1Þ p 2 :
As a consequence, LCENðrÞ ¼limA!þ1CENðAÞ ¼
1
2ð2rþ1Þ log2ð
ðð3rþ1Þ ðrþ1ÞÞrþ1
r2r Þ>0,and there
exists R0<1(R0�0.71)such that LCENðrÞ
>1 if R0 <r<1; ¼1 if r¼R0;1; <1 if r<R0or r>1: 8 > < >
: Moreover, there exist0
Fig 10. FamilyXA,r. CEN, MCEN, ACC�and MCC�as function ofr>0 forA= 10.
https://doi.org/10.1371/journal.pone.0210264.g010
<R1<R0<1<R2(R1�0.5,R2�1.4)such that
if r2 ½R0;1�; there exists Ar>0such thatCENðAÞ<1if A<Ar; CENðArÞ ¼1;CENðAÞ>1if A>Ar;
if r2 ðR1; R0Þ [ ð1;R2Þ; there exist0<Ar <Brsuch thatCENðAÞ<1if A<Ar
orA>Br; CENðArÞ ¼CENðBrÞ ¼1;
CENðAÞ>1if A2 ðAr;BrÞ;
if r2 ð= R1;R2Þ; CENðAÞ �1for any A>0:
8 > > > > > > > > > > > > > > < > > > > > > > > > > > > > > :
On the other hand, for any r>0,
MCEN(A)<1, ACC�(A)<1andMCC�(A)<1,for all A>0, ACC�andMCC�are
mono-tonically increasing functions of A, CENis not, and MCEN is or not, depending on the value of r,
lim
A!0CENðAÞ ¼limA!0MCENðAÞ ¼limA!0ACC
� ðAÞ ¼0;lim A!0MCC � ðAÞ ¼ 1 ffiffiffiffiffiffiffiffiffi r 2ðrþ1Þ q 2 , lim A!þ1ACC � ðAÞ ¼ rþ1 2rþ1¼LACC�ðrÞ;Alim!þ1MCC � ¼ 1þ ffiffiffiffiffiffiffiffiffi1 2ðrþ1Þ p 2 ¼LMCC�ðrÞ,LMCENðrÞ ¼ lim A!þ1MCENðAÞ ¼ 2 3ð2rþ1Þ þ ðrþ1Þlog2ð ðð2rþ1Þðrþ1ÞÞrþ1 r2r Þ<1;LMCEN(r)<LCEN(r) for all r>0.
Fig 11. FamilyYA,r. CEN, MCEN, ACC�and MCC�as function ofA>0 forr= 0.1.
Note that LACC�(r)<LMCC�(r)if and only if r> 1þ ffiffi
5
p
4 >0.
Improving classification of the minority class while maintaining the imbalance between the classes. Up to now, we have evaluated binary confusion matrices with different balances
of the two classes but not different classification results. Now let’s do just the opposite. To help clarify the utility of MCEN in the evaluation of improvements in classification of the minority class while maintaining the same amount of imbalance, we consider two different examples.
Example 1: We introduce the family of confusion matricesXa
50;2¼
50 100
101 a a
!
, withα= 1, 2,. . ., 101. Note that whenα= 1, the corresponding matrix belongs to the family {XA,r} withA= 50 andr= 2. Imbalance in classes stays fix. Whenα= 1, the minority class is
classified very badly, improving classification asαincreases and reaching the perfect classifica-tion whenα= 101. Is MCEN able to detect this behaviour? Yes, it is. Unlike what happens with CEN, MCEN (as well as ACC�and MCC�) monotonically decreases when classification of the minority class improves (αincreases). CEN incongruously first increases up toα= 18 and then starts to decrease and behave like the other performance measures (seeFig 14).
Example 2: A similar phenomenon can be observed with familyYb
100;1¼
100 100
101 b b
!
, withβ= 1, 2,. . ., 101 (withβ= 1 the corresponding matrix belongs to the family {YA,r} with
A= 100 andr= 1. As in Example 1, imbalance in classes is constant and whenβ= 1, the Fig 12. FamilyYA,r. CEN, MCEN, ACC�and MCC�as function ofA>0 forr= 0.8.
https://doi.org/10.1371/journal.pone.0210264.g012
minority class is classified very badly, improving classification asβincreases up to 101, when perfect classification is reached. MCEN as well as ACC�and MCC�, monotonically decrease whenβincreases, while CEN increases up toβ= 14 and then starts to decrease and behave like the other performance measures (seeFig 15).
The
Z
Afamily
As noted in [4], the behaviour of the Confusion Entropy CEN is rather diverse from that of MCC�and ACC�for the pathological case of the family of confusion matrices
ZA= (ai,j)i,j= 1,. . .,N, defined byai;j¼
A ifi¼N;j¼1 1 otherwise;
(
, withA>0. That is,
ZA¼ 1 1 . . . 1 1 1 . . . 1 .. . .. . . . . ... 1 1 . . . 1 A 1 . . . 1 0 B B B B B B B B @ 1 C C C C C C C C A
. We want to study how MCEN behaves when applied to elements of
this family.
Fig 13. FamilyYA,r. CEN, MCEN, ACC�and MCC�as function ofrforA= 10.
Proposition 7 If N>2;CENðZAÞ ¼ 1 N2þA 1 � ðN 1Þ ðN 2Þlog2ðN 1Þð2NÞ þð2NþA 3Þlog2ðN 1Þð2NþA 1Þ Alog2ðN 1ÞðAÞ � ; MCEN ¼ 2 2ðN2þA 1Þ N � N 1 ð ÞðN 2Þlog2ðN 1Þð2N 1Þ þð2NþA 3Þlog2ðN 1Þð2NþA 2Þ Alog2ðN 1ÞðAÞ � ; if N¼2;CENðZAÞ ¼ 1 Aþ3ððAþ1Þlog2ðAþ3Þ Alog2ðAÞÞ; MCEN ¼ 2 2Aþ5ððAþ1Þlog2ðAþ2Þ Alog2ðAÞÞ: In general (N�2), MCC� ðZAÞ ¼NðN 2þ2ðA 1ÞÞ ðN2þ ðA 1ÞÞ 2ðN 1Þ ðN2þ2ðA 1ÞÞ ; ACC� ðZAÞ ¼ N2 Nþ ðA 1Þ N2þ ðA 1Þ As a consequence, Fig 14. FamilyXa
50;2withα= 1, 2,. . ., 101. CEN, MCEN, ACC
�and MCC�as function ofα. https://doi.org/10.1371/journal.pone.0210264.g014
• If N= 2,
MCEN<CEN(ZA)for allA>0,
MCEN<1for allA>0,and there existsA32(1, 2)(A3�1.85)such that CENðZ1Þ ¼CENðZA3Þ ¼1;
CENðZAÞ>1ifA2 ð1;A3Þ and CENðZAÞ<1if A2 ½1= ;A3�;
lim A!0MCC � ðAÞ ¼1 4<limA!0ACC � ¼1 3<limA!0MCENðAÞ ¼ 2 5<limA!0CENðAÞ ¼ log2ð3Þ 3 ; lim
A!þ1CENðAÞ ¼Alim!þ1MCENðAÞ ¼0<Alim!þ1MCC �
¼3
4<Alim!þ1ACC �
¼1:
• If N= 3(we take this case as example of what happens with N>2),
lim A!0MCC � ðAÞ ¼13 28<limA!0ACC � ¼5 8< <lim A!0CENðAÞ ¼ 2log4ð6Þ þ3log4ð5Þ 8 <limA!0MCENðAÞ ¼ 2 13ð2log4ð5Þ þ3Þ<1; lim
A!þ1CENðAÞ ¼Alim!þ1MCENðAÞ ¼0<Alim!þ1MCC � ¼5 8<Alim!þ1ACC � ¼1: Fig 15. FamilyYb
50;2withβ= 1, 2,. . ., 101. CEN, MCEN, ACC
�and MCC�as function ofβ. https://doi.org/10.1371/journal.pone.0210264.g015
In Figs16and17we can observe this behaviour whenN= 2 andN= 3, respectively.
Table 8shows some examples of confusion matrices of the familyZA, first withN= 2, and
secondly withN= 4.
Note that CEN and MCEN exhibit a very different behaviour comparing with ACC�and MCC�, since the former are sensitive to the overall entropy associated to the elements of the
matrix, which islogðN2þA 1Þ A
N2þA 1 logðAÞ. Entropy decreases to log(N
2
−1) when A!0, and drops to 0 whenA!+1.
Comparing with other performance measures
Several works have considered the question of the introduction and comparison of different performance measures for classification, inspired, in one way or another, by Shannon’s entropy. For example, in [13] the authors introduce a novel measure called PACC (Probabilis-tic Accuracy) in the multi-class setting, making a comparative study of it with other measures as Accuracy, MCC and CEN, among others.
Besides, Entropy-Modulated Accuracy (EMA), introduced in [14], is a performance mea-sure of classification tasks based on the concept ofperplexity, the latter being defined as the effective number of classes a classifier sees. The authors also introduce NIT (Normalized Infor-mation Transfer) factor, which is a correction of EMA. They compare both EMA and NIT fac-tor with Accuracy and CEN, rejecting rankings of classifiers based in Accuracy and choosing more meaningful and interpretable classifiers. They show in some examples that MCC is Fig 16. FamilyZA. CEN, MCEN, MCC�and ACC�as function ofA>0 forN= 2.
https://doi.org/10.1371/journal.pone.0210264.g016
highly correlated with Accuracy, while rankings obtained with CEN, EMA and NIT factor are comparable in some cases but disagree in others.
Although PACC, EMA and NIT factor are useful measures to assess classifiers, in our opin-ion none of them is completely satisfactory in grading the effectiveness of the classifier learning process, since all reflect some concrete feature of the classification process, being insufficient for covering all the aspects of this complex task, so they should be used cautiously and in a complementary way. That is, all the measures suffer from certain weaknesses that are evident in specific, more or less gimmicky situations. This comment extends also to both CEN and MCEN, although it should be noted that the latter solves the problems showed by CEN in the binary setting, as well as to MCC and Accuracy, the last one having been widely treated (see, for example, the Introduction section in [14]).
Let us exemplify this fact by going back to the toy example inTable 2. InTable 9we add the calculated values of PACC�= 1-PACC and 1/NIT to that ofTable 2. We use NIT factor
(inverted to make it comparable with the other measures) instead of EMA since the probability distribution of classes in the validation set is not uniform. Note that our confusion matrices are transposed with respect to that in [14], and also that for the NIT factor we use formula (4). We have used the corrected definition provided by the authors, which had already acknowl-edged an erratum inEq (4)in the comments ofhttps://www.researchgate.net/publication/ 259743406_100_Classification_Accuracy_Considered_Harmful_The_Normalized_ Information_Transfer_Factor_Explains_the_Accuracy_Paradox/.
The behaviour of PACC�showed inTable 9is consistent with that of MCC�, increasing
when IN entropy decreases (a) and decreasing when OUT decreases (b). However, the Fig 17. FamilyZA. CEN, MCEN, MCC�and ACC�as function ofA>0 forN= 3.
behaviour of 1/NIT is consistent with that of CEN and MCEN, decreasing in both cases. Nev-ertheless, unlike what happens with CEN and MCEN, NIT factor does not distinguish among scenarios (a) and (b). This is because both EMA and NIT factor are invariants to permutations of the columns.
Another example is that of theMEG mind reading challengeorganized by the PASCAL (Pat-tern Analysis, Statistical modeling and ComputAtional Learning) network in [15], already considered in [14]. We restrict our comparison to the group of the four most outstanding sys-tems, denotedC1(Huttunen et al.),C2(Santana et al.),C3(Jyla¨nki et al.) andC4(Tu & Sun),
since for them, unlike what happens with the rest, we could access to the confusion matrices in [15]. The results are inTable 10, and from them we see that the most comparable rankings are that given by the NIT factor, CEN and MCEN, showing clusters {C4,C2} and {C1,C3}, with
very small differences inside the clusters, specially the second. The authors of the report [15] were specially interested in comparisonC1vs.C4, and 1/NIT factor, as well as CEN and
MCEN, give the same ordering:C4is better (lower value) thanC1, in concordance with
interpretability given in [14]. Table 8. Examples with different matricesZAin casesN= 2 andN= 4.
10 10 1 10 ! 2 2 1 2 ! 1 1 1 1 ! 1 1 2 1 ! 1 1 10 1 ! A = 1/10 1/2 1 2 10 ACC�= 0.3548 0.4286 0.5000 0.6000 0.8462 MCC�= 0.2955 0.4167 0.5000 0.5833 0.7045 CEN = 0.6864 0.9174 1.0000 0.9932 0.5758 MCEN = 0.5806 0.8276 0.9057 0.8889 0.4972 ZA= 102 102 102 102 102 102 102 102 102 102 102 102 1 102 102 102 0 B B B B B @ 1 C C C C C A 10 10 10 10 10 10 10 10 10 10 10 10 1 10 10 10 0 B B B B B @ 1 C C C C C A 1 1 1 1 1 1 1 1 1 1 1 1 1 1 1 1 0 B B B B B @ 1 C C C C C A 1 1 1 1 1 1 1 1 1 1 1 1 10 1 1 1 0 B B B B B @ 1 C C C C C A 1 1 1 1 1 1 1 1 1 1 1 1 102 1 1 1 0 B B B B B @ 1 C C C C C A A = 10−2 10−1 1 10 102 ACC�= 0.7335 0.7351 0.7500 0.8400 0.9652 MCC�= 0.4882 0.4894 0.5000 0.5441 0.5771 CEN = 0.8284 0.8391 0.8704 0.7132 0.2068 MCEN = 0.8883 0.9001 0.9309 0.7338 0.2016 https://doi.org/10.1371/journal.pone.0210264.t008
Table 9. Toy example ofTable 2revisited, adding PACC and the NIT factor.
Baseline (a) (b) 3 3 3 3 ! 2 3 3 4 ! 1 3 3 5 ! 0 3 3 6 ! 3 2 4 3 ! 3 1 5 3 ! 3 0 6 3 ! ACC�= 0.5000 0.5000 0.5000 0.5000 0.5000 0.5000 0.5000 MCC�= 0.5000 0.5130 0.5625 0.6667 0.4881 0.4375 0.3333 CEN = 1.0000 0.9898 0.9575 0.8962 0.9591 0.8250 0.5000 MCEN = 0.9057 0.9006 0.8848 0.8571 0.8590 0.7057 0.3343 PACC�= 0.5000 0.5071 0.5312 0.5833 0.4929 0.4687 0.4167 1/NIT = 2.0000 1.9992 1.9840 1.8371 1.9992 1.9840 1.8371 https://doi.org/10.1371/journal.pone.0210264.t009
One more example to show the variability when performance measures are compared: in
Table 11we see that the NIT factor (equivalently, EMA), unlike the other measures, is not able to distinguish between classifiers whose confusion matrices areAandBin the binary case, nor betweenCandDin multi-class classification.
Supporting information file: Experiments and results
The advantages of using Modified Confusion Entropy MCEN measure against CEN have been tested on different binary classifiers, constructed from four available datasets from the UCI ML Repository (https://archive.ics.uci.edu). From each dataset we construct and assess eight different classifiers, five of which are Bayesian networks, while the rest are other standard machine learning procedures used in supervised classification problems.
Because of the comparisons carried out previously with different examples, we have to rec-ognize the impossibility of deciding what measure of behaviour, of the considered ones, can allow to decide in the case that the rankings of classifiers obtained with CEN and MCEN were different. We decided, then, to use OUT entropy as such a reference when there is disparity; in case of a tie, we will use IN entropy to break it. This is what we will call “the criterion of entropy”.
To compare rankings obtained from CEN and MCEN and that obtained by the criterion of entropy, we use both the Hamming distance and the degree of consistency indicatorc(see [16]).
The results obtained with all the considered datasets heuristically reinforce that MCEN is more correlated with entropy than CEN. (seeS1 Fileand Tables A-F inS1 File).
Conclusion
We introduced MCEN as a modification of the original Confusion Entropy performance mea-sure CEN introduced in [3], both for binary and multi-class classification, proving some Table 10. Results for the first four systems of theMEG mind reading challenge. Confusion matrices have been
obtained from [15].
System ACC� MCC� CEN MCEN PACC� 1/NIT
C1 0.3201 0.2010 0.4360 0.5694 0.3230 2.5877
C2 0.3675 0.2286 0.4043 0.4981 0.3668 2.4715
C3 0.3721 0.2319 0.4483 0.5645 0.3667 2.6151
C4 0.3783 0.2369 0.4213 0.5279 0.3737 2.4545
https://doi.org/10.1371/journal.pone.0210264.t010
Table 11. Two toy examples. WithS= 30 forN= 2, and withS= 40 forN= 3.
A¼ 10 0 10 10 ! B¼ 0 10 10 10 ! C¼ 10 0 0 10 10 0 0 0 10 0 B B @ 1 C C A D¼ 10 0 0 0 10 10 10 0 0 0 B B @ 1 C C A ACC�= 0.3333 < 0.6667 0.2500 < 0.5000 MCC�= 0.2500 < 0.7500 0.1500 < 0.3500 CEN = 0.5283 < 1.0000 0.1981 < 0.3231 MCEN = 0.4000 < 0.9400 0.2000 < 0.3333 PACC�= 0.2917 < 0.7083 0.1944 < 0.5000 1/NIT = 1.6799 = 1.6799 1.5000 = 1.5000 https://doi.org/10.1371/journal.pone.0210264.t011
properties. We compared this measure with CEN, MCC and Accuracy, showing that in the binary case, MCEN overcomes the unreliability of CEN in a twofold sense: the departure of the range where it should be (the interval [0, 1]), and the lack of monotonicity when the entropy increases or decreases. These features made CEN an inappropriate measure in the binary case, proving MCEN to be a good alternative, and we study different scenarios to high-light this fact. Moreover, while nor Accuracy nor MCC can distinguish among different mis-classification distributions of cases in the confusion matrix, MCEN and CEN have an high level of discrimination.
First, we show that in the binary case (seeTable 2), both CEN and MCEN are sensitive to the decreasing in the entropy within the main diagonal IN, an also to that outside the diagonal OUT, but while CEN is more sensitive than MCEN to IN, the opposite occurs with OUT. By contrast, ACC is insensitive as long as the sum of the diagonal and the total sum remain con-stant. Secondly, we consider the multi-class perfectly symmetric and balanced case in which the main diagonal elements are equal toTand the elements outside the diagonal are equal to F, which is analytically studied in detail, showing the output-of-range of CEN in the binary case whenγ=T/F2(0, 1).
After that, se consider different particular situations in the binary setting, through the study of some families of confusion matrices. FamilyUAis symmetric and unbalanced, showing the
out-of-range of CEN for anyA>1, and in addition a lack of monotonicity that contrast with the behaviour of the overall entropy associated to the elements of the matrix. FamilyVAis
asymmetric and unbalanced, and also shows the out-of-range of CEN but only forAin the interval (1,A1), whereA1�1.4.
Two doubly indexed families have been considered in the binary case. CEN has an anoma-lous behaviour for familyXA,r, which is symmetric but unbalanced, forr>r0(withr0�0.8)
since it is not only out-of-range from a certain value ofA, but its limit whenA!+1is>1 if r>1, showing lack of monotonicity. The same happens from a certain value ofr, fixedA. FamilyYA,ris also unbalanced but asymmetric. Whenris in the interval (R0, 1) withR0�0.71,
CEN is not only out-of-range from a certain value ofA, but its limit whenA!+1is>1 if r>1, showing lack of monotonicity. But there are other two intervals of values forrin which CEN>1 forAliving in a certain bounded interval.
Besides evaluating binary confusion matrices with the same classification results for the minority class but different balances of the two classes, we compare through two examples the behaviour of MCEN with that of CEN, ACC�and MCC�, in evaluating improvements in
clas-sification of the minority class while maintaining the same amount of imbalance. We show that CEN is the only one that does not show a monotonous decrease as the classification improves, for which MCEN proves, also in this sense, that it outperforms CEN.
Finally, we also consider the multi-class familyZA, which is asymmetric and unbalanced,
and observe that in the binary case, CEN is out-of-range forA2(1,A3), withA3�1.85.
In all of these examples, MCEN behave appropriately. Comparing with the overall Shan-non’s entropy associated to the set of elements of the confusion matrix, both CEN and MCEN are sensitive to it but CEN sometimes does not show the same behaviour in terms of monoto-nicity than entropy. With respect to Accuracy and MCC, conveniently scaled, they show some-times a behaviour in contradiction with Shannon’s entropy, as for familiesVAandZA.
A further comparison has been carried out with the Probabilistic Accuracy (PACC) intro-duced in [13], and the Entropy-Modulated-Accuracy EMA and the Normalized Information Transfer (NIT) factor, both introduced in [15]. We consider different examples in which sometimes PACC�= 1–PACC behaves consistently with MCC�, increasing when IN entropy
decreases and decreasing when OUT decreases, while 1/NIT behaves in accordance with CEN and MCEN, decreasing in both cases, but with the handicap that unlike what happens with

![Fig 4. The symmetric case. CEN, MCEN, ACC � and MCC � for γ 2 [0, 10], with N = 3.](https://thumb-us.123doks.com/thumbv2/123dok_us/803963.2601615/10.918.154.869.607.1061/fig-symmetric-case-cen-mcen-acc-mcc-γ.webp)
![Fig 5. Famlily U A . CEN, MCEN, ACC � and MCC � for A 2 (0, 10].](https://thumb-us.123doks.com/thumbv2/123dok_us/803963.2601615/12.918.153.864.115.580/fig-famlily-u-cen-mcen-acc-mcc.webp)