Reliability Prediction and Web Service
Selection using Soft Computing
Techniques for Service-Oriented Systems
Sachin Arora
Department of Computer Science and Engineering
National Institute of Technology Rourkela
769008, India
Reliability Prediction and Web Service
Selection using Soft Computing
Techniques for Service-Oriented Systems
Thesis submitted in partial fulfillment of the requirements of the degree of
Master of Technology
in
Computer Science and Engineering
(Specialization: Software Engineering)
by
Sachin Arora
(Roll Number: 214CS3150)
based on research carried out under the supervision of
Prof. Santanu Kumar Rath
May, 2016
Department of Computer Science and Engineering
Department of Computer Science and Engineering
National Institute of Technology Rourkela
Prof. Santanu Kumar Rath
Professor
May 23, 2016
Supervisor’s Certificate
This is to certify that the work presented in the dissertation entitledReliability Prediction and Web Service Selection using Soft Computing Techniques for Service-Oriented Systems
submitted bySachin Arora, Roll Number 214CS3150, is a record of original research carried out by him under my supervision and guidance in partial fulfillment of the requirements of the degree of Master of Technology in Computer Science and Engineering. Neither this thesis nor any part of it has been submitted earlier for any degree or diploma to any institute or university in India or abroad.
Dedication
Declaration of Originality
I, Sachin Arora, Roll Number 214CS3150 hereby declare that this dissertation entitled
Reliability Prediction and Web Service Selection using Soft Computing Techniques for Service-Oriented Systemspresents my original work carried out as a postgraduate student of NIT Rourkela and, to the best of my knowledge, contains no material previously published or written by another person, nor any material presented by me for the award of any degree or diploma of NIT Rourkela or any other institution. Any contribution made to this research by others, with whom I have worked at NIT Rourkela or elsewhere, is explicitly acknowledged in the dissertation. Works of other authors cited in this dissertation have been duly acknowledged under the section “Reference”. I have also submitted my original research records to the scrutiny committee for evaluation of my dissertation.
I am fully aware that in case of any non-compliance detected in future, the Senate of NIT Rourkela may withdraw the degree awarded to me on the basis of the present dissertation.
May 23, 2016
Acknowledgment
First of all, I am obligated to my dear parents for their support and endowments.
I am thankful to Almighty for showing me the silver lining in the dark clouds at the time of crises.
I would like to express my deep sense of respect and gratitude towards my supervisor Professor Santanu Kumar Rath, Department of Computer Science and Engineering, National Institute of Technology, Rourkela, (Odisha) for his capable direction, inspiration and priceless help amid my Master of Technology studies. His extraordinary knowledge, insight, delicate conduct and experience have impacted my whole life. It has been an awesome benefit and fortune for me to work under his supervision. I appreciatively recognize my profound feeling of appreciation towards him for acquainting me with the field of Service Oriented Architecture and giving me the chance to work under him. His unified confidence in this topic and capacity to draw out the best of diagnostic and viable aptitudes in individuals has been important in extreme periods. Without his precious exhortation and help it would not have been workable for me to finish this thesis. I am incredibly obligated to him for his steady support and priceless exhortation in each part of my scholarly life. I think of it as my favorable luck to have a chance to work with such a brilliant individual.
I convey my sincere thanks to Mr. Lov Kumar, Research Scholar, Department of Computer Science and Engineering, National Institute of Technology, Rourkela, for his intellectual and moral support during my study.
I should acknowledge the scholarly assets that I have from NIT Rourkela. I might want to thank authoritative and specialized staff individuals from the Department who have been sufficiently caring to exhort and help in their separate parts.
May 23, 2016 NIT Rourkela
(Sachin Arora)
Abstract
Building a wide variety of distributed systems is a complex task these days. Since, service oriented architecture (SOA) is a major framework for distributed systems, it’s reliability is the major concern while developing a related software. The assessment of reliability in service-oriented systems (SOS) mainly depends on the accessibility of web-services, which leans on different parameters i.e. unpredictable internet, communication links and the location of web services. Hence, reliability needs to be predicted for the better functioning of a system.
Selection of an optimal web-service is also an important concern in SOS. Since, for an abstract task to perform in SOS, a large number of functionally equivalent web service candidates are available. The same web service candidate can perform differently with different users. So, a technique is required for building the personalized web service ranking framework for designers.
Hence, for predicting the reliability of SOS and for selection of an optimal web service candidate from functionally equivalent set of web service candidates a most effective approach is desired. In this work, a novel methodology is proposed for predicting the reliability of web service candidate which basically uses the past failure experience of similar service users and a personalized framework for selection of an optimal web service candidate from functionally equivalent candidates’ set which basically is associated with the past web service usage experience of similar users. In this work, no additional invocation of web service is required. The experimental results are compared with many other techniques proposed by other authors in literature which shows the effectiveness of proposed approach.
Keywords: Service Oriented Architecture; Reliability; Ranking; Collaborative Filtering;Web Service.
Contents
Supervisor’s Certificate ii Dedication iii Declaration of Originality iv Acknowledgment v Abstract vi List of Abbreviations ix List of Figures x List of Tables xi 1 Introduction 1 1.1 Web Service . . . 21.1.1 Web Service Description Language (WSDL) . . . 4
1.1.2 Universal Description Discovery and Integration (UDDI) . . . 5
1.1.3 Simple Object Access Protocol (SOAP) . . . 5
1.2 Collaborative Filtering . . . 6
1.3 Reliability Prediction . . . 7
1.4 Web Service Selection . . . 9
1.5 Problem Statement . . . 9
1.6 Motivation . . . 10
1.7 Contribution . . . 10
1.8 Thesis Organization . . . 11
2 Literature review 12 3 Reliability Prediction Framework using Collaborative Filtering 15 3.1 Introduction . . . 15
3.3 Proposed Work . . . 17
3.3.1 Reliability Prediction . . . 17
3.4 Experiments . . . 22
3.4.1 Experimental Setup . . . 22
3.4.2 Performance Evaluation Parameters . . . 23
3.5 Comparison of Prediction Accuracy . . . 23
3.6 Results and Analysis . . . 24
3.7 Summary . . . 26
4 Web Service Selection using Collaborative Filtering 27 4.1 Introduction . . . 27
4.2 Architecture of Service Oriented System . . . 27
4.3 Sharing of Web Service Usage Experience . . . 29
4.4 Proposed Work . . . 29
4.4.1 Quality Ranking Framework . . . 29
4.5 Experiments . . . 32 4.5.1 Dataset Description . . . 32 4.5.2 Evaluation Metric . . . 33 4.5.3 Performance Metric . . . 33 4.5.4 Comparison of Performance . . . 34 4.6 Impact of Parameter . . . 35
4.6.1 Impact of Matrix Density . . . 35
4.7 Summary . . . 35
5 Conclusion 37
References 38
Dissemination 40
List of Abbreviations
SOA Service Oriented Architecture
SOS Service Oriented System
WSDL Web Service Description Language
SOAP Simple Object Access Protocol
UDDI Universal Description Discovery and Integration
MAE Mean Absolute Error
RMSE Relative Mean Square Error
CBF Content-Based filtering
CF Collaborative filtering
COTS Components Off The Shelf
QoS Quality of Service
PCC Pearson Correlation Coefficient
LR Linear Regression
PR Polynomial Regression
SRCC Spearman rank correlation coefficient
List of Figures
1.1 Design issues addressed by Service-Orientation. . . 1
1.2 Service Oriented Architecture . . . 2
1.3 Web service as a service provider. . . 3
1.4 Web service as a service requestor. . . 3
1.5 Web service as an intermediary. . . 4
1.6 WSDL document. . . 5
1.7 SOAP message format. . . 6
1.8 Encapsulation of different logic in different services. . . 8
3.1 Service Oriented System. . . 16
3.2 Procedure for Prediction of Reliability for SOS. . . 17
3.3 Failure Probability Aggregation. . . 21
3.4 Impact of failure probabilities (A) MAE of Sim Values 0.5 to 1 (B) RMSE of Sim Values 0.5 to 1 (C) MAE of Sim Values 0.1 to 1 (D) RMSE of Sim Values 0.1 to 1 . . . 25
4.1 Architecture of Service Oriented System. . . 28
4.2 Procedure for predicting ranking of Web Services. . . 30
List of Tables
2.1 Web service/component selection for software system. . . 13
2.2 Reliability Prediction for software system. . . 14
3.1 Comparison Of Previous Prediction Approaches . . . 23
3.2 Prediction Performance Accuracy whenSimP CC values are between 0.5 to 1 24 3.3 Prediction Performance Accuracy whenSimP CC values are between 0.1 to 1 24 4.1 Dataset Summary . . . 32
4.2 Summarization of previous approaches . . . 34
4.3 Comparison of NDCG values based on Response Time. . . 34
Chapter 1
Introduction
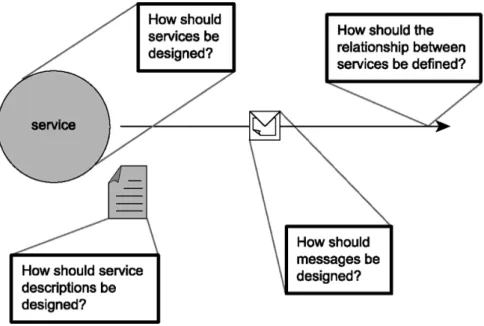
SOA is a way of representing a model which constitutes the logic for automation and is distributed in different and tiny units of logic. When aggregated these small units form a bigger, automated business goals and individually these units can be distributed. Web service is the basic building block of SOA. Though, SOA allows these smaller units to exist independently but not in isolation from others. These smaller units which pertains logic in them have to adhere some principles which allow them to exist independently and provides some similarity and standardization. Similar to the object-orientation, there are some principles involved that are to be followed in service-orientation. Figure 1.1 shows the design issues that are addressed by service-orientation.
Figure 1.1: Design issues addressed by Service-Orientation.
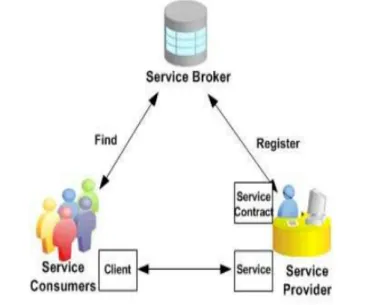
The principles that a web service maintains are Loose coupling, Discoverability, Service contract, Statelessness, Autonomy, Composability, Reusability and Abstraction. As an architectural model, SOA is defined among three basic components as shown in Figure 1.2.
(a) Service Provider: It deposits definition of web service candidates in repository. (b) Service Broker: It stores the definition of services and is a registry of services.
(c) Service Consumer: It explores the repository with service definition to find the needed service candidate.
Figure 1.2: Service Oriented Architecture
For service definition SOA uses Web Service Description Language (WSDL), to communicate SOA uses Simple Object Access Protocol (SOAP) and for service-repository SOA uses Universal Description Discovery and Integration (UDDI).
In this work linear regression and polynomial regression is applied on the basis of past experience of users for the prediction of web service candidate’s reliability and polynomial regression for the selection of best performing candidate from a group of equi-functional web service candidates respectively.
1.1
Web Service
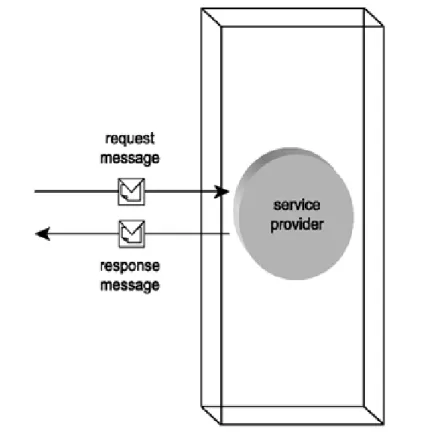
Web service is a software construct that may change its role of appearance but not the functional role, which depends on the demand of scenario and the responsibilities assigned to it. According to the context, a web service may change its roles, such as, it can act as a requester, provider or an intermediary. Hence, it is not tagged with the keywords client or server. For a web service it is common to act different role within a same business task and is as common in SOA too. Different roles a web service can act are:
1. Service provider: Web service acts in this role when it is invoked by some external source. Figure 1.3 shows web service acting as a service provider.
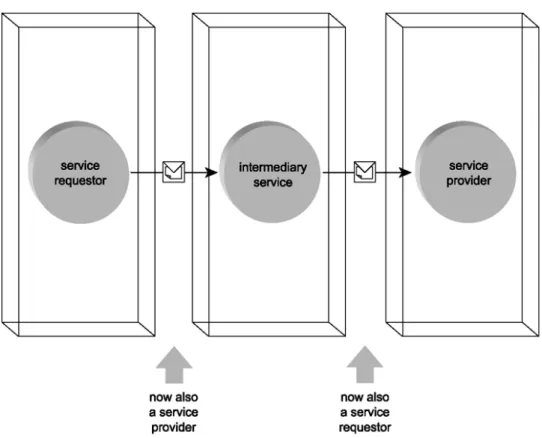
2. Service requestor: Web service acts in this role when it sends a message to service provider and invokes it. Figure 1.4 shows web service acting as a service requestor.
Chapter 1 Introduction
Figure 1.3: Web service as a service provider.
Figure 1.5: Web service as an intermediary.
3. Intermediary: Web service acts an an intermediary when it is responsible to route the messages to a particular location as shown in Figure 1.5.
1.1.1
Web Service Description Language (WSDL)
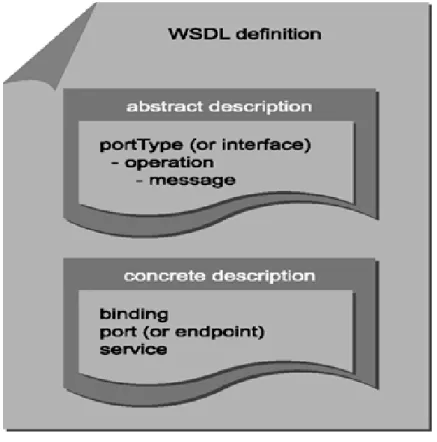
WSDL defines the web service. It stores the description of a web service in XML format. When a requestor wants to make communication with a particular web service then WSDL provide the formal structure of interface and helps in making the physical connection with the web service. WSDL document involves the abstract and concrete definition as shown in Figure 1.6.
The different elements that WSDL document contains are: • PortType: It shows the topmost view of interface
• Operation: It is a group of functions in which messages are sorted in a manner as service process them.
• Message: Each operation in WSDL consists of input and output parameters which ar known as messages.
• Binding: To establish a physical connection binding described the requirements. • Port: It describes the actual physical address of a service
Chapter 1 Introduction
Figure 1.6: WSDL document. • Service: It describes a set of endpoints.
1.1.2
Universal Description Discovery and Integration (UDDI)
UDDI is a repository of WSDL files. It stores the web service information by creating an XML based repository. UDDI provides the discoverability property. If the web services can not be discovered then they are of no use.
Discoverability is one of the major principles of SOA. In a case, if web services are available but not discoverable then it can not be used in any of the application development. UDDI provides this discoverability property to SOA.
1.1.3
Simple Object Access Protocol (SOAP)
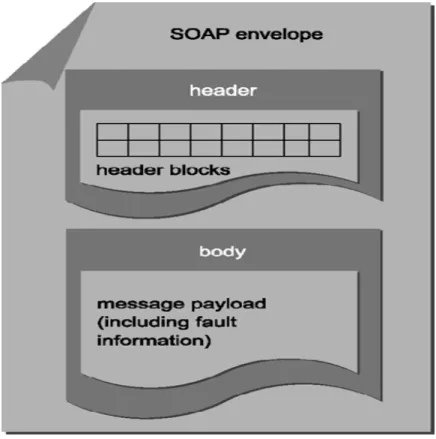
Web services follow the message based communication and SOAP provides the standard format of communication between web service and clients. It is platform independent and provides interoperability feature to web services. SOAP message format is shown in Figure 1.7
SOAP message format elements are:
Figure 1.7: SOAP message format.
• Header: This field contains the meta information like authentication data etc. It is an optional field in SOAP
• Body: This field contains the actual XML formatted data.
1.2
Collaborative Filtering
It is observed that data size is increasing rapidly than the capability to manage it. So, new technologies are required which helps in managing this information and to secure us from overload problem. One such technology is pattern recognition and collaborative filtering. Collaborative filtering is broadly categorized in two ways:
1. Content-based filtering (CBF): In this type of filtering the recommender system associate users and items with some features based on the analysis of their content which includes user’s profile, item’s characteristic etc. Then, CBF recommends items to the users which matches with the representation available with the user.
2. Collaborative filtering (CF): This type of filtering don’t require the internal or content information of items’ or users’. This approach works on the rating given to items by other users and recommends those items to users if they fit in their preference criteria. This approach assumes that the current user is also interested in the items which are
Chapter 1 Introduction
highly used by other users with similar need. CF don’t collect the information about different users and items.
CF is applicable to two type of approaches. Firstly, when user is having one item at a time with it’s rating which predicts the interest of user in that particular item. Secondly, when Top-K list of items are present with their rating scores and user inspects all the items where top ranked item represents the most preferred items to the user.
1.3
Reliability Prediction
Prediction of reliability for a software is a process of identifying the future reliability on the basis of failure data recorded in past by similar users [1]. To make the service oriented systems more reliable and to cut down the cost involved in re-engineering, it is desirable that the reliability is to be predicted at an architectural design phase. Many models like Putnam’s model [2], Musa’s time execution model [3], etc., have been proposed in which the failure data from past have been observed and employed. Traditionally, the software systems are tested by using different testing methods to collect the failure data and are released only when the software achieves the defined limit of reliability. But in SOS, reliability not only depends on the whole system but there are other factors too, such as, location of the web services which are remotely installed, poor communication links and the Internet facility.
Same web service can show the different reliability analysis when accessed by different users, due to the influence of communication links. To assess the functioning of a web service, it is recommended to evaluate it from the client side. However, for SOS testing techniques that are being used traditionally are difficult to apply because:
1. Invocating a web service candidate may be chargeable as it is developed and hosted by different organizations. Still, if it is assumed to be free of cost then also it will impose a huge amount of cost to the user and will waste resources at provider’s end.
2. It may be time consuming as in SOS all web services play a vital role and for a particular web service, there are unlimited equi-functional web services present on Internet and to evaluate all of them is a difficult task.
Proposed methods for prediction of reliability as available in literature, whether they are for component based systems [4] [5] [6] [7] or for SOS [8], assumed that the reliability of an individual component/web service is known and the authors worked only at the system level composition. It is also observed that the reliability prediction at component level is not taken into consideration. Some approaches [9] [10] [11] considered the component level prediction of reliability but these are applicable to traditional software systems only. Predicting the reliability of SOS based software is more challenging because:
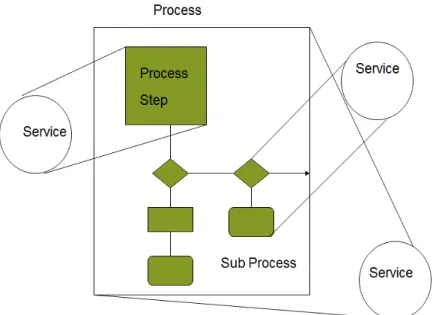
Figure 1.8: Encapsulation of different logic in different services.
1. The organizations neither reveal the design and implementation details nor the internal information of web service which are hosted by them. Figure 1.8 depicts the encapsulation of logic in web services.
2. Communication links with the web services play an important role because same web service may perform differently for different users. These links often influence a lot in reliability prediction.
To solve these two challenges a framework for prediction of reliability is proposed in this work based on collaborative filtering. In this framework, prediction of reliability of the web service for current user is evaluated by using the past experience of similar users. A similar user is one who has invoked same set of web services and analyzed the similar performance. Reliability of a component can be predicted even if the user has not invoked any web service before.
Hence, evaluation of every service in a SOS is not possible and without getting failure data, system designer is unable to predict the reliability of SOS. In this approach reliability prediction is considered both at component level and system level which is complimentary to the approaches available in literature [4] [5] [6] [7] [8], where main focus is on system level composition of reliability. To enhance system’s performance, reliability prediction can be used at an early stage of development. To activate the best system reconfiguration, the proposed approach can be applied at runtime.
Chapter 1 Introduction
1.4
Web Service Selection
Service oriented systems are an internet-based computing which constitute various services in a particular fashion to achieve some goal where each service performs different functions. In this work, these services are termed as web services. Building a good quality SOS is a research problem, that needs more emphasis.
SOS is composed of number of web services, like, distributed systems [7]. Previously, invocation of components are done locally SOS web service is invoked remotely through some links. These links are used for communication and they highly affect the performance of SOS. Some other factors that influence the SOS’s performance are service request management and provisioning. Usually, web services are reused by different applications. Due to the unreliable links, different SOS experience different quality of performance for the same web service. Hence, personalized web service ranking framework for building high quality SOS is difficult.
QoS describes the non-functional performance. A lot of redundant components are available on internet. While selecting a web service candidate from these redundant components, personalized ranking framework recommends the optimal candidate to the designer. It also helps detecting the poor performing web service candidates from the functionally inequivalent web service candidate set. By substituting such web services overall performance of SOS can also be increased. Building a web service quality ranking framework based on QoS becomes more challenging, since, web service quality ranking for a particular designer of SOS can not be directly used by different designer due to the location of SOS. Hence, personalized framework is needed for every SOS. The easiest approach for building such framework is by evaluating all the components from user’s side and based on the analyzed QoS performance, ranking can be done. But, practically this approach is not possible, due to availability of high quantity of web services at internet which will consume much time and resources too.
To solve this challenge a ranking framework for web service selection is proposed for prediction of the ranks of web services without explicitly invoking any web service candidate. This approach uses the experiences of past users who had invoked these web services for prediction of the ranks for current user.
1.5
Problem Statement
This work defines the problem statement as two-fold:
1. Prediction of the web service’s reliability and to propose some compositional style for prediction of SOS’s reliability based on the data observed by other users in past. 2. Selection of the best performing web service candidate from the set of functionally
equivalent candidates.
1.6
Motivation
The requirement of flexibility is an important concern in business. SOA, fulfills this need of flexibility very well. Hence, it is becoming a base for major frameworks for building distributed systems.
When an application is built, then it is a usual practice that few components are built, few components are reused from off the shelf (COTS), and to meet some functionalities few components are taken from cloud. After that, all the components are integrated to make a common interface. Hence, there is a need to predict the reliability. Since, all the components are heterogeneous in nature, the final system should be reliable enough and also there is a need for the selection of optimal web service candidate, as there exists a lot of equi-functional web service candidates.
SOA allows distributed systems to integrate since it provides platform independence, loosely coupled architecture and helps in reducing cost. But before integration, there is a need that the web service reliability is to be predicted and beyond that there is a need of selecting a web service candidate. For selection of an optimal candidate, non-functional properties should also be considered. If the designer selects a less reliable or poor performing web service then it will affect the whole system’s performance. So, in this proposed work Quality of Service (QoS) parameter is considered.
1.7
Contribution
This work contributes in a two-fold manner:
• Firstly, a framework for the prediction of SOS’s reliability is proposed, in which the reliability for current user is predicted by using the failure data of other similar users from past.
• Secondly, in this work a framework for web service quality ranking is proposed to get the personalized web service ranking for selecting the optimal web service candidate. For analyzing the performance, extensive experiments are done with other approaches present in literature in Chapter 2. The results describes the capability of our proposed approach.
1.8
Thesis Organization
The rest of the thesis is organized in the following manner:
• In chapter 2, background work is discussed. It describes different frameworks and approaches, proposed by different authors for the prediction of reliability of service oriented system/component based systems. This chapter also discusses the approaches for web service/component selection for software systems.
• In Chapter 3, a framework for reliability prediction of service oriented system using some Regression techniques is proposed and also shows its effectiveness when compared with the other approaches, available in literature.
• In Chapter 4, a framework for web service selection for building service oriented system using some regression techniques is proposed. This section discusses the performance of proposed approach through experimentally observed results.
• In chapter 5, the whole work done is concluded and it discusses as to how the future work can be done for making the system better, can be extended.
Literature review
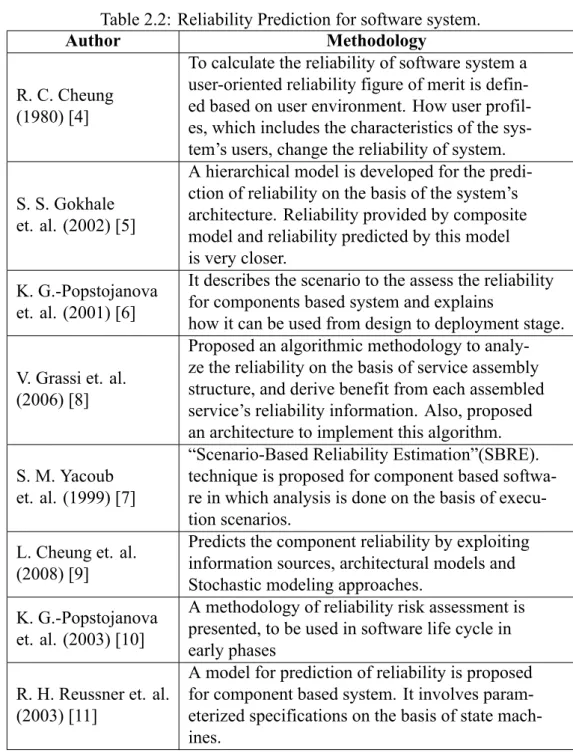
A good number of prediction models have been proposed in past by various authors, for software systems, e.g., Putnam’s model [2], Musa’s execution time model [3], etc. Moreover, many approaches are proposed for prediction of reliability of SOS and component based systems [4] [5] [6] [7] [8]. But, most of these assume that the component reliability is known and focused on system level reliability prediction. However, in this work prediction of both component/web service and the whole system is considered. Though, few approaches [9] [10] [11] consider the reliability prediction at component level, they are mainly built for traditional systems. Both of the approaches [10] [11] need content of the component for reliability prediction. Table 2.2 shows the methodologies proposed by different authors for the prediction of software system’s reliability.
Different from the work done in Table 2.2, this work predicts the reliability of web services which are accessed remotely and hosted by different organizations. Moreover, this work also considers the effect of communication links in prediction of reliability for component/web services. Z. Zheng et. al. [12] proposed a framework for reliability prediction of SOS but the proposed approach performs better when extensive experiments are conducted. Proposed approach uses the collaborative filtering technique for reliability prediction of service oriented system.
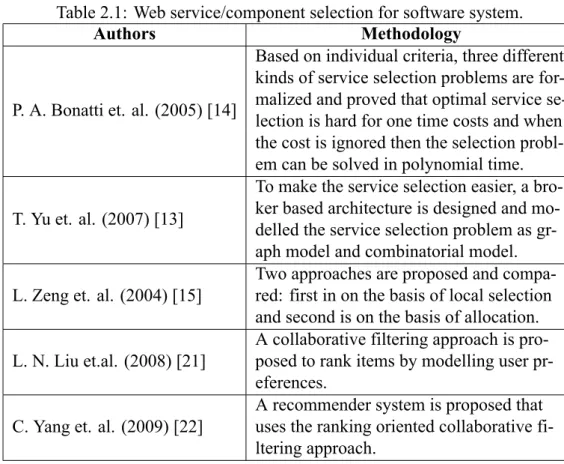
Non-functional characteristics of the software system [13] and components/web services is presented widely by employing the QoS. The performance of non functional QoS of SOS can be evaluated either from web service provider’s perspective, e.g. availability, price. etc., or from client’s (designer) perspective, e.g. Throughput, Response time, etc. Various approaches [14] [13] [15] have been proposed in past on the basis of QoS performance for the selection of component, which solves the problem for selection of optimal candidate from a set of equi-functional candidates. For the selection of best performing candidates for SOS, in this work, web service quality ranking framework is proposed using collaborative filtering. Table 2.1 shows the Methodologies proposed by different authors for the selection of web service/component for software system.
Collaborative filtering (CF) is the filtering of useful information which are collected by the collaboration of different users. A good number of recommender systems [16] use the
CF technique. The most widely used CF technique involves neighborhood-based technique, which includes approaches like user-based [17] [18], item-based [19], and their fusion [20] [12]. In service oriented computing environment, collecting and using the failure data of past users is possible. By taking advantage of the collected data, in this work, a reliability prediction mechanism and web service selection mechanism for SOS are proposed.
Table 2.1: Web service/component selection for software system.
Authors Methodology
P. A. Bonatti et. al. (2005) [14]
Based on individual criteria, three different kinds of service selection problems are for-malized and proved that optimal service se-lection is hard for one time costs and when the cost is ignored then the selection probl-em can be solved in polynomial time.
T. Yu et. al. (2007) [13]
To make the service selection easier, a bro-ker based architecture is designed and mo-delled the service selection problem as gr-aph model and combinatorial model. L. Zeng et. al. (2004) [15]
Two approaches are proposed and compa-red: first in on the basis of local selection and second is on the basis of allocation. L. N. Liu et.al. (2008) [21]
A collaborative filtering approach is pro-posed to rank items by modelling user pr-eferences.
C. Yang et. al. (2009) [22]
A recommender system is proposed that uses the ranking oriented collaborative fi-ltering approach.
Table 2.2: Reliability Prediction for software system.
Author Methodology
R. C. Cheung (1980) [4]
To calculate the reliability of software system a user-oriented reliability figure of merit is defin-ed basdefin-ed on user environment. How user profil-es, which includes the characteristics of the sys-tem’s users, change the reliability of system.
S. S. Gokhale et. al. (2002) [5]
A hierarchical model is developed for the predi-ction of reliability on the basis of the system’s architecture. Reliability provided by composite model and reliability predicted by this model is very closer.
K. G.-Popstojanova et. al. (2001) [6]
It describes the scenario to the assess the reliability for components based system and explains
how it can be used from design to deployment stage.
V. Grassi et. al. (2006) [8]
Proposed an algorithmic methodology to analy-ze the reliability on the basis of service assembly structure, and derive benefit from each assembled service’s reliability information. Also, proposed an architecture to implement this algorithm. S. M. Yacoub
et. al. (1999) [7]
“Scenario-Based Reliability Estimation”(SBRE). technique is proposed for component based softwa-re in which analysis is done on the basis of execu-tion scenarios.
L. Cheung et. al. (2008) [9]
Predicts the component reliability by exploiting information sources, architectural models and Stochastic modeling approaches.
K. G.-Popstojanova et. al. (2003) [10]
A methodology of reliability risk assessment is presented, to be used in software life cycle in early phases
R. H. Reussner et. al. (2003) [11]
A model for prediction of reliability is proposed for component based system. It involves param-eterized specifications on the basis of state mach-ines.
Chapter 3
Reliability Prediction Framework using
Collaborative Filtering
3.1
Introduction
The key concern in software engineering states that analyzing the quality of a software at implementation phase is too late. Design decisions are to be made at design phase only. Finding the problems at implementation phase requires re-engineering and is very costly. Hence, the quality parameters are to be identified during design phase only. This work is focused on reliability attributes of quality.
The above discussion states that the reliability is to be ”built into” the system at design phase. Many approaches focused on reliability prediction both for component based system [4] [5] [6] [7] or for SOS [8], but all these approaches focused on the system level prediction of reliability and assumed that the reliability of individual component/web service is known. But, this assumption is not reasonable. It is not clear in these approaches that how the reliability of a component/web services will be obtained. Further sections will explain as to how the reliability of a web service/component can be predicted and how these predicted reliability values can be integrated to predict the reliability of the whole SOS. The proposed approach is also applicable for previous approaches where reliability of component/web service is assumed to be known.
3.2
Framework of Service Oriented System
Service oriented system is an integration of different services (here, web services) which are organized in a proper manner to achieve a business goal. In this work, failure probability is the fraction of invocations failed in contrast with total invocations made for a particular component which lies between ‘0’ to ‘1’.
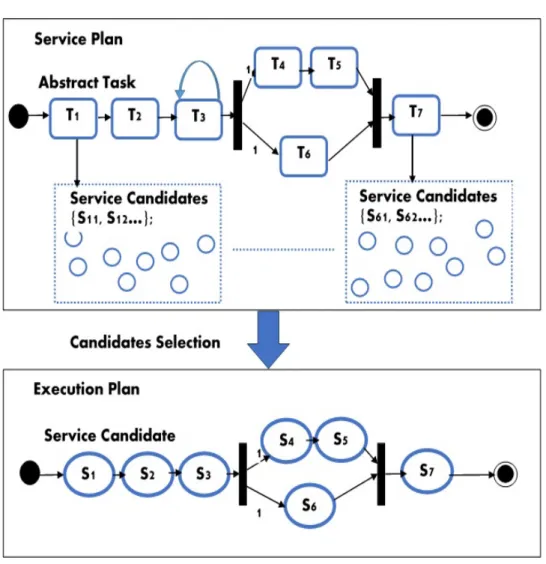
Figure 3.1 explains the service flow in SOS. This service flow includes some tasks (T1, ..., T7) which are abstract in nature, pipelined to each other and uses some structures
Figure 3.1: Service Oriented System.
task is executed individually and is associated with an individual web service candidate. This web service candidate is selected from a set of functionally equivalent web service candidates. Chapter 4 discusses how these web service candidate can be selected. When these web service candidates (S1, ..., S7) are integrated anexecution planis obtained. These
Web services are invoked to implement the abstract tasks. It is assumed here that equivalent web services are present here [13]. A novel web service selection framework is proposed in the subsequent Chapter.
SOS’ reliability is decided by web service’s individual reliability. To predict of web service’s reliability for the current user, proposed approach uses the failure data experienced by similar users. So to collect the failure data of web service from different user some mechanism is required. A user-collaboration mechanism is proposed by Z.Zheng.et.al. [23] which can be used for collection of past failure data. The idea behind this collaboration mechanism is that apart for the contribution done for videos and information to youtube1
andwikipedia2respectively if user starts contributing its web service failure data. Moreover,
1http://www.youtube.com 2http://www.wikipedia.org
Chapter 3 Reliability Prediction Framework using Collaborative Filtering
Figure 3.2: Procedure for Prediction of Reliability for SOS.
the failure probability prediction for the current user will be accurate if more users contribute their failure data, since the users will find more characteristics from the contributed data by other past users. In this way, users can be encouraged to provide their experience with the web services.
To enhance this process of contribution, client-side web page can be designed to record the experiences of different users while invocation of web services and contribute this data to a central repository servers in exchange of accessing prediction services.
3.3
Proposed Work
3.3.1
Reliability Prediction
Service flow in SOS includes tasks to perform functionalities. For every task a best performing service needs to be chosen from a functionally equivalent candidates set. The easiest and straightforward way is by evaluating every candidate and choosing the optimal one from those candidates. But as discussed earlier, this way of selection criteria is time consuming, wastes resources and practically not possible due to unlimited services available on Internet.
Another approach is by calculating the average of failure probabilities and then selects the best performing one [12]. For example, a user wish to select a service candidate but he/she has never invoked any web service before, the performance can be evaluated by using the Equation 3.1. ¯ fx = 1 t t ∑ s=1 fs,x (3.1)
‘s’. Total service users are represented by‘m’. and ‘f¯x’ shows the average failure probability
of web service‘x’.
But we argue that simply by taking the average of failure probabilities, the actual performance can’t be observed because it includes dissimilar users’ too. Hence, an approach is proposed for the web service selection in chapter 4 which uses the past failure data of similar service users.
Moreover, service users access the web services from different geographical locations and through different communication links, the current user may observe the different performance of web service than average failure probability obtained. In case, if the past failure data is available for web services then that data can be employed to predict the failure probability. The proposed approach for prediction of reliability for web service is designed as a five-phase process as shown in Figure 3.2. Phase 1 calculates the failure probability of every web service from the past data available. Phase 2 calculates the similarity between the users by employing PCC. Phase 3 selects the group of similar users for the current user based on the similarity values obtained from previous phase. Phase 4 predicts the failure probability of the web service required by the current user. Phase 5 aggregates the failure probabilities obtained according to the service flow in SOS using some compositional structures. The detailed description of these phases is discussed further.
A. Phase 1: Calculate Failure Probability: In this phase failure probability of every web service candidate ‘x’ is calculated with respect to every service user ‘s’. Assume that the total service users are ‘m’ and total web services are ‘n’ then the relationship between service users and web service candidates is defined by ‘m×n’, where each entry ‘fs,x’ denotes the probability of failure for web service‘x’observed by service
user‘s’. Failure probability ‘fs,x’ can be calculated by using the Equation 3.2.
fs,x=
If x
Ix
. (3.2)
where, ‘If x’ is the number of failed invocations observed by service user ‘s’ to a
particular web service ‘x’, ‘Ix’ is the number of times service user ‘s’ has invoked
web service ‘x’.
B. Phase 2: Find Similarity: In this phase PCC can be applied for finding the similarity between the current user and other users. PCC has been employed in many recommender system, to calculate the similarity between two users. PCC states that the similarity between two service users ‘s1’ and service user ‘s2’ on the basis of same
Chapter 3 Reliability Prediction Framework using Collaborative Filtering SimP CC(s1, s2) = ∑ x∈Xs1∩Xs2(fs1,x− ¯ fs1)(fs2,x−f¯s2) √∑ x∈Xs1∩Xs2(fs1,x−f¯s1) 2√∑ x∈Xs1∩Xs2 (fs2,x−f¯s2) 2 (3.3)
where, ‘Xs1 ∩Xs2’ is the set of web services that are commonly invoked by service user ‘s1’ and service user ‘s2’, ‘fs1,x’ is the probability of failure for web service ‘x’ observed by service user ‘s1’, ‘f¯s1’ is the average of failure probability of all web services observed by service user ‘s1’, ‘SimP CC(s1, s2)’ represents the similarity
between service user ‘s1’ and service user ‘s2’ according to Pearson correlation
coefficient which is observed to be between the interval -1 and +1. Similarity value more closer to +1 shows the higher similarity and negative value shows no similarity between two users.
C. Phase 3: Group Similar Users: This phase identifies similar users by analyzing the similarity values. For a web service that is to be invoked by the current service user, a set of similar users can be identified by setting the upper limit ‘a’ and lower limit ‘b’. This limit is to be given by the current user as per requirement and the similarity values between this range for current user and other user is considered to be the similar user for the current user. In this approach, dissimilar users (users with negative correlation values) are not included, since, dissimilar users highly affect the prediction process. For predicting the missing entry ‘fs,x’ in the matrix of failure probability, similar users
‘SU’ can be recognized by using the Equation 3.4.
SU(s2) = {s1 |SimP CC(s1, s2)> i, SimP CC(s1, s2)≤j, s1 ̸=s2} (3.4)
D. Phase 4: Predict Failure Probability: In this phase, the missing entry ‘fs,x’ in the
matrix of failure probability can be predicted by applying some statistical methods. Using the similar users, two statistical methods, namely, Linear Regression (LR) and Polynomial Regression (PR), may be applied.
1. Linear Regression : LR method models the scalar variable which is dependent in accordance with some variable which is independent. This method is used to examine the straight line relations. It is a statistical technique. LR for a single variable is based on:
X =γ1+γ2Y. (3.5)
where ‘X’and ‘Y’are dependent and independent variable respectively and ‘γ1’, ‘γ2’ are the constant values.
between dependent variable and independent variable, say ‘X’ and ‘Y’ respectively with respect to some degree of polynomial, say ‘nth’. PR method
explains some non-linear process and non linearly relates the dependent and independent variable.
X =bo+b1Y +b2Y2+b3Y3− − − − −+bnYn. (3.6)
In the context of bo, b1,.... which are the unknown parameters, all are the linear
models as the regression function itself is linear.
E. Phase 5: Aggregate Reliability: In SOS, service flow determines which abstract task will be executed first, and so on. In general, the most commonly used structures for composition areparallel, sequence, loopand branch. Like previous approaches [15], it is assumed in this work that error is not propagating and tasks are failing independently. The web service failure properties can be aggregated according to the compositional structures [12] which are as follows.
i. Parallel: In this type of structure every branch executes at least once and all branches execute parallel. If a single branch fails in execution, the whole structure get fails. The probability of failure for parallel structure can be evaluated by: Pf = 1− n ∏ x=1 (1−Pf x). (3.7)
where ‘Pf x’ is the ‘xth’ parallel branch’s failure probability.
ii. Sequence: In this type of structure, tasks are executed one after another. If any of the task fails, the whole sequence structure fails. The probability of failure for sequence structure can be evaluated by:
Pf = 1− n
∏
x=1
(1−Pf x). (3.8)
where ’n’ is the total tasks in sequence and ‘Pf x’ is the ‘xth’ task’s failure
probability.
iii. Loop: The probability of failure for loop structure can be evaluated by:
Pf = 1− n
∑
x=0
lx(1−Pf1)x. (3.9)
where, ‘Pf1’ is the probability of failure of the task in loop, ‘lx’ is the probability
that the loop will execute ‘z’ times, ‘n’ represents the number of times loop will execute, and ∑mx=0lx= 1. When n=0 the value of probability is 0. Here, it is
Chapter 3 Reliability Prediction Framework using Collaborative Filtering
Figure 3.3: Failure Probability Aggregation.
assumed that the values of ‘n’ and ‘lx’ will be provided by the designer of the
SOS.
iv. Branch: In this type of structure only one branch executes at an execution. The probability of failure for branch structure can be evaluated by:
Pf = 1− n
∑
x=1
bx(1−Pf x). (3.10)
where ’n’ is the total count of branches, ‘Pf x’ is the ‘xth’ branch’s failure
probability, and ‘bx’ is the ‘xth’ branch’s execution probability (
∑n
x=1bx= 1).
These four basic compositional structures can be combined according to the service flow in SOS. To find the probability of failure for SOS, service flow is decomposed into these structures. As shown in Figure 3.3, ‘t1’ and ‘t2’ values are calculated by using the above formulae. Then, ‘t3’ is calculated by aggregating the values of ‘t2’
and ‘T6’. Lastly, whole system’ probability of failure can be calculated by using the Equation 3.8.
By the approach used above, failure probability of the whole SOS can be calculated. For reliability prediction, exponential reliability function [1] is employed:
Rel(t) =e−γ×t (3.11) where, ‘γ’ is the rate of failure of service flow between a certain time duration, and ‘t’ is the duration of time for which the system’s reliability is to be calculated. ‘γ’ is calculated by ‘p×f’, where ‘p’ is the probability that a service flow will fail, and ‘f’ is the frequency of service flow’s execution. Hence, by using Equation 3.11, the following equation is obtained.
Rel(t) = e−p×f×t. (3.12)
By using Equation 3.12, system designers can predict the reliability of SOS at an early phase of software life-cycle, i.e. at the architectural design phase. Also, after releasing the system, if web service performance is changed, reliability of a SOS can be updated dynamically.
3.4
Experiments
3.4.1
Experimental Setup
The wsdream3dataset is used in our experiment. The datset is comprised of 150 distributed clients from Planet-Lab and 150 web services which are located at 20 different countries and are publicly accessible. The service users analyze and collect failure data of selected web services to the centralized server. Every service user invocate every web service about 100 times and records the failure data. The web service user can thus obtain the failure probability of every web service. In this way, failure probability matrix is obtained having dimension of ‘150×100’, where each entry represents the failure probability of web service observed by corresponding service user.
The proposed approach’s performance is compared with five other different approaches, namely, Item-based approaches using PCC (IPCC), User-based approaches using PCC (UPCC), HYBRID, user-mean (UMEAN), item-mean(IMEAN) as shown in Table 3.1.
In our experiment service users are divided as testing and training users. To make the experiment more realistic few entries in training matrix and testing users are randomly removed. It may be observed that matrices are often sparse in nature. For predicting the
Chapter 3 Reliability Prediction Framework using Collaborative Filtering
Table 3.1: Comparison Of Previous Prediction Approaches
Author Technique MAE RMSE
Z. Zheng et. al. [12]
UMEAN 0.053 0.147 IMEAN 0.019 0.048 HYBRID 0.017 0.032 J. S. Breese et. al. [17] UPCC 0.036 0.063 B. Sarwar et. al. [19] IPCC 0.022 0.039
Polynomial
Regression 0.016 0.026 Linear
Regression 0.007 0.012
values of removed entries two statistical approaches have been used. For evaluating the performance, the original values are considered as expected values of removed entries.
3.4.2
Performance Evaluation Parameters
The prediction accuracy of failure probability values of web service for current service user is determined by Mean Absolute Error (MAE) and Relative Mean Square Error (RMSE).
1. Mean Absolute Error(MAE)
M AE = ∑ s,x fs,x−fbs,x N (3.13)
2. Relative Mean Square Error(MAE)
RM SE =
√∑
s,x(fs,x−fbs,x)2
N (3.14)
where fs,x represents the expected value for failure probability of Web-service ’x’
obtained by service user ’s’, fbs,x represents the predicted value for failure probability of
Web-service ’x’obtained by service user ’s’.
3.5
Comparison of Prediction Accuracy
Our prediction approach shows that MAE and RMSE values are quite less in comparison with the results obtained by other authors as shown in Table 3.1. The above approaches had used the same data-set whose results are shown by Z.Zheng et.al. [12]. UMEAN and IMEAN are calculated as the average of different service users’ failure probabilities and the average of different web services’ failure probabilities respectively. UPCC and IPCC
Table 3.2: Prediction Performance Accuracy whenSimP CC values are between 0.5 to 1
Metrics Methods
Training Users = 150 Sim Values = 0.5 to 1
100 110 120 130 140 150 MAE Linear Regression 0.0042 0.0054 0.0048 0.0059 0.0042 0.0047
Polynomial Regression 0.0163 0.0181 0.0175 0.0179 0.0186 0.0199
RMSE Linear Regression 0.0073 0.0068 0.0091 0.0079 0.0089 0.0084 Polynomial Regression 0.0494 0.0238 0.0236 0.0166 0.0157 0.0137
Table 3.3: Prediction Performance Accuracy whenSimP CC values are between 0.1 to 1
Metrics Methods
Training Users = 150 Sim values = 0.1 to 1
100 110 120 130 140 150 MAE Linear Regression 0.0058 0.0101 0.0101 0.0114 0.0105 0.0112
Polynomial Regression 0.0167 0.0171 0.0139 0.0163 0.0120 0.0132
RMSE Linear Regression 0.0086 0.0176 0.0173 0.0213 0.0163 0.0193 Polynomial Regression 0.0171 0.0192 0.0312 0.0247 0.0910 0.0320
employ only similar service users and similar web services respectively. Hybrid approach uses both similar service users and web services.
3.6
Results and Analysis
The results of proposed approach after employing the performance evaluation parameter, i.e., MAE and RMSE is shown in Table 3.2 and Table 3.3. Total 150 training users are employed in training matrix. The change patterns of error (MAE and RMSE) have been studied against the number of users for whom the value of failure probability for accessing web services has been obtained. Second row in Table 3.2 and Table 3.3 represents the similarity values.
Fig. 3.4 represents experimental results pictorially, where Fig. 3(A) and 3(B) shows the MAE and RMSE values respectively, when the range of similarity values is taken as 0.5 to 1 and Figure 3(C) and 3(D) show the MAE and RMSE values respectively, when the range of similarity values is taken as 0.1 to 1. The experiment results of Figure 3 shows that higher the value of similarity between web services, higher will be the accuracy. When the two or more web services are much similar to each other, then the prediction of failure probability is more accurate. Also it is observed that the prediction accuracy of Linear Regression method is more accurate than the Polynomial Regression method; however Linear Regression and Polynomial Regression give more accuracy than approaches, considered previously.
Chapter 3 Reliability Prediction Framework using Collaborative Filtering A 1000 105 110 115 120 125 0.005 0.01 0.015 0.02 Faliure Number MAE
Training User = 150, Sim Values = 0.5 to 1
Linear Regression Polynomial Regression B 1000 105 110 115 120 125 0.01 0.02 0.03 0.04 0.05
Training User = 150, Sim Values = 0.5 to 1
Failure Number RMSE Linear Regression Polynomial Regression C 1000 105 110 115 120 125 0.005 0.01 0.015 0.02
Training User = 150, Sim Value = 0.1 to 1
Failure Number MAE Linear Regression Polynomial Regression D 1000 105 110 115 120 125 0.02 0.04 0.06 0.08 0.1 Failure Number RMSE
Training User = 150, Sim Values = 0.1 to 1 Linear Regression
Polynomial Regression
Figure 3.4: Impact of failure probabilities (A) MAE of Sim Values 0.5 to 1 (B) RMSE of Sim Values 0.5 to 1 (C) MAE of Sim Values 0.1 to 1 (D) RMSE of Sim Values 0.1 to 1
In this chapter a novel methodology has been proposed to predict the reliability of SOS using collaborative filtering technique. In this approach past failure data of different service users are used. Two statistical methods i.e. Linear Regression and Polynomial Regression are used for predicting the failure probability value of web service for the current user. Some compositional structures are also discussed to predict the failure probability of overall system. Then, exponential reliability function is used to predict the reliability of SOS. The results obtained after conducting the extensive experiments show the effectiveness of this approach when compared with other approaches proposed by different authors in literature.
Chapter 4
Web Service Selection using
Collaborative Filtering
4.1
Introduction
SOA is a well known framework used for building distributed systems. Web services are used to exchange data over network. It is a fundamental unit in SOS development. The most important thing in developing the SOS is the selection of an optimal service candidate and ranking of web services. In a heterogeneous environment, selection of relevant services is difficult. Different search engines are used for selection of web services from service repositories, service portals and peer to peer networks etc. It is necessary to fix an appropriate service since, by composing these services an application is developed.
Using protocols such as SOAP and WSDL, different systems can be built flexibly by aggregating different web services developed independently to achieve complex business goals. Every web service can be executed at any platform as long as it is properly defined in WSDL. The performance of a system at runtime is most important issue. For example, in a health care system a quick response is expected as soon as the query of a patient is given from emergency ward. End to end management is a big issue in SOS due to the compositional structure of web services.
QoS for web services defines various non-functional parameters such as response time, reliability, throughput, availability etc. Since, web services are invoked through a network, the parameters such as throughput and response time are considered for performance evaluation purpose. A framework for optimal web service selection is proposed by ranking the equi-functional web service candidates using collaborative filtering.
4.2
Architecture of Service Oriented System
To understand the research problem in this chapter, an architecture of the system has been presented as shown in Figure 4.1. There are large number of web services available, which are reusable and distributed as shown in Figure 4.1. These web service candidates are
Figure 4.1: Architecture of Service Oriented System.
accessed by the system designers to build various SOS. These designers are known as component users, since the web services are used by these designers to build their SOS application. Since the web services are invoked by SOS, the servers running the web services are considered to be at the server side and the servers running the SOS are at client side in this work. The end users of SOS are called customers. Since, web services are accessed using internet by different designers of the system, present at different geographical locations, different SOS may observe different quality for the same components. The following two scenarios show that why is personalized web service ranking framework needed:
• When designing a SOS application (e.g., SOS Application 1 shown in Figure 4.1), the application designer wants to select an optimal web service candidate from a set of functionally equivalent web service candidates (i.e., a1...am). The selection of optimal web service candidate highly relies on location of the SOS application. So, to make
Chapter 4 Web Service Selection using Collaborative Filtering
an optimal web service candidate selection, personalized quality ranking framework is required.
• To improve the overall performance of the SOS, system designer needs to identify the poor performing web services. By replacing these poor performing web services the performance of SOS application can be increased. In this scenario, personalized quality ranking framework for functionally inequivalent web service candidates will provide useful information in detection of low-quality web service candidates. These two scenarios show that the personalized framework for quality ranking of web services helps to improve the performance of SOS. To provide effective framework for web service quality ranking approach based on QoS, Web service usage experience is required which is further discussed following section.
4.3
Sharing of Web Service Usage Experience
Quality of Service (QoS) can be measured both at server-side and client-side. Though, server-side provides the actual capacities of web services, client-side provides the more realistic capacity of web services. Response time, failure probability, throughput, etc. are the commonly used QoS properties at client-side. A user-collaboration mechanism is proposed by Z.Zheng.et.al. [23] which can be used for collection of past failure data. The idea behind this collaboration mechanism is that instead of contributing videos and information toyoutubeandwikipediarespectively, if user starts contributing its web service failure data. Moreover, the ranking prediction of web services on the basis of QoS may turn out to be more accurate, if more users contribute their failure data, since the users will find more characteristics from the contributed data by other past users. In this way, users can be encouraged to provide their experience with the web services.
To enhance this process of contribution, client-side web page can be designed to record the experiences of different users while invocation of web services and contribute this data to a central repository servers in exchange of accessing this data according to their need.
4.4
Proposed Work
4.4.1
Quality Ranking Framework
In this section the Quality ranking framework (named as ‘Regressive Rank’) for web services is proposed, which is a four-phase process as shown in Figure 4.2. In phase 1, average values of QoS attributes are calculated (e.g. Response time, Throughput) which are already known to the user. In phase 2, two users similarity is calculated on the basis of the rankings given to web services which are commonly invoked by them. In phase 3, a group of similar users are
Figure 4.2: Procedure for predicting ranking of Web Services.
selected on the basis of similarity values obtained. In phase 4, final rankings are predicted for both employed and unemployed web service candidates based on the QoS data received from other users using Polynomial Regression (PR) technique.
A. Phase 1: Find average QoS values: This phase calculates the average response time and throughput values of a particular web service for the current user. This average value is calculated on the basis of the total invocations made by that user to a particular web service. These QoS values can be calculated by using the Equation 4.1.
Qs,x= 1 n n ∑ i=1 qs,x,i. (4.1)
where, ‘qs,x,i’ is the response time value of web service ‘x’ observed by service user
‘s’ for a particular invocation ‘i’ ,‘n’represents the total invocations made for a web service. Let the total users are‘s’and web services are‘x’, then‘s×x’matrix denotes the relationship between service users and web services, where each entry‘Qs,x’is the
average QoS value of service user‘u’with respect to web service‘i’.
B. Phase 2: Similarity Computation: In this phase the similarity value is calculated between two users. After getting the QoS values from Phase 1, all the web services are ranked accordingly. Then, the similarity between two users are calculated on the basis of the ranks obtained from the commonly invoked web services. For example, the response time (milliseconds) of four components observed by two users are {2, 4, 6, 8} and {35, 40, 45, 50} respectively. However, the QoS value observed by these two users is different but their rankings are same. Given, two set of rankings for the same components, the Spearman rank correlation coefficient (SRCC) (also called
Chapter 4 Web Service Selection using Collaborative Filtering
Spearman’s rho) calculates the similarity by:
Simsrcc(s1, s2) = 1−
6×∑(di)2
M(M2 −1). (4.2)
where ‘M’ is the total web services in the set, ‘di’ denotes the difference between
ranks of two web services. Since,di =R(qs1,x)−R(qs2,x)and after using SRCC, the similarity between two users can be calculated by using the Equation 4.3.
Simsrcc(s1, s2) = 1− 6×∑xεXs 1∩Xs2(R(qs1,x)−R(qs2,x)) 2 |Xs1 ∩Xs2| ×((|Xs1 ∩Xs2|) 2−1) (4.3)
where‘|Xs1 ∩Xs2|’represents the set of commonly invoked web service candidates invoked by both users ‘s1’ and ‘s2’. ‘qs,x’ is the QoS value (e.g. throughput and
response time) which is observed by user ‘s’ for component ‘x’ and R(z) denotes the rank of QoS value of a user. Since SRCC works between the pair of web services, so similarity can be calculated when,|Xs1 ∩Xs2| ≥2.
C. Phase 3: Similar User Selection: This phase identifies similar users for the current user based on the SRCC values obtained from Equation 4.3. Approaches [21] [22] proposed in the past include the dissimilar users too to predict the ranking for the current user. Employing the rankings of dissimilar users will effect the prediction accuracy of rankings for current user. The proposed approach considers only the Top-K similar users for prediction of ranks and excludes the service users with negative correlations (negative SRCC values). In this approach, similar users ‘SU(s1)’ for the
current user ‘s1’ can be identified by the equation 4.4.
SU(s1) ={s2 |s2 ∈T Ks1, Simsrcc(s1, s2)>0, s1 ̸=s2} (4.4) where, ‘SU(s1)’ is the set of similar users for user ‘s1’, T Ks1 is the set of Top-K similar users for current user ‘s1’, Simsrcc(s1, s2) > 0discards the dissimilar users
having negative similarity values. Simsrcc(s1, s2)can be calculated by Equation 4.3.
D. Phase 4: Polynomial Regression: PR method is a statistical method that models the relationship between dependent variable and independent variable, say ‘X’ and ‘Y’ respectively with respect to some degree of polynomial, say ‘nth’. PR method explains
some non-linear process and non linearly relates the dependent and independent variable.
X =bo+b1Y +b2Y2+b3Y3− − − − −+bnYn. (4.5)
In the context ofbo,b1,.... which are the unknown parameters, all are the linear models
4.5
Experiments
4.5.1
Dataset Description
The proposed framework is evaluated using WS-DREAM1 dataset of web services which
include QoS values. This dataset is a real world dataset which include QoS performance of 1.5 million real world web service invocations. There are 100 web services which are invoked by 150 service users. Each web service is invoked by about 100 times by each user. The QoS values observed by 150 users for 10 web services is represented by a matrix of 150×100 dimension where each entry is a vector representing the QoS value which can be calculated by using the Equation 4.1. Response time and throughput are taken as QoS value in experiment to rank web services. These two performance metrics are explained in Section 4.5.3. Table 4.1 shows the summary of dataset.
Table 4.1: Dataset Summary
Demography Values Total invocations 1,542,884 Total users 150 Total Web-services 100 Lowest Throughput 0.03kBps Highest Throughput 643.36kBps Average Of Throughput 4.10kBps Standard Deviation Of Throughput 12.17kBps Lowest Response Time (RT) 0.009s
Highest RT 28.96s
Average of RT 1.73s
Standard Deviation of RT 3.65s
In Table 4.1, it can be seen that the lowest and highest value of response times are 0.009s and 28.96s respectively. It is analyzed that the response time values of web services by different users are having high variation. Since, the standard deviation and average of 1500 RT values in the service user-Web service matrix are 3.65s and 1.73s respectively. It is also analyzed that the throughput values of web services by different users are also having high variation. Since, the standard deviation and average of 1500 throughput values in the service user-Web service matrix are 12.17 kBps and 4.10 kBps respectively. When this dataset is analyzed thoroughly it is observed that maximum RT values are between 0.2 seconds and 1.6 seconds. Moreover, maximum throughput values are between 0.4 kBps and 3.2 kBps.
Chapter 4 Web Service Selection using Collaborative Filtering
4.5.2
Evaluation Metric
For evaluating the performance of web service ranking, Normalized Discounted Cumulative Gain (NDCG) [24] metric is used, which is used widely in information retrieval for the evaluation of ranked results. When an ideal and predicted descending component ranking is given, then the NDCG performance of Top-k web services can be calculated by Equation 4.6
N DCGk =
DCGk
IDCGk
. (4.6)
where ‘DCGk’ is the discounted cumulative gain values of the predicted web service
ranking and ‘IDCGk’ is the ideal discounted cumulative gain values of the ideal web service
ranking. ‘DCGk’ values can be calculated by Equation 4.7
DCGk =rel1+ k ∑ i=2 reli log2i . (4.7)
where ‘reli’ is the graded relevance of component at position ‘i’. TheN DCGk values
lies in the range between 0.0 to 1.0, where greater values represent more accuracy as predicted ranks are more closer to the ideal ranks.
4.5.3
Performance Metric
Response time and throughput are QoS values used here. These parameters are defined as: 1. Response Time: RT is defined as the time duration between sending a request and
receiving a response. When a client sends the request to a service, the server processes the data through all the services because an application integrates all the services. After all the processing are done, server sends the output as a reply to the client. Response time can be defined by the Equation 4.8.
ResponseT ime =t1−t2. (4.8)
where ‘t1’ and ‘t2’ are time at which client has sent the request and the time at which
client has received the response respectively.
2. Throughput: It is defined as the data bytes transferred per second. Suppose ‘D’ bytes of data transfer takes ‘T’ units of time, then throughput is calculated as the total bytes sent or received at a unit time. Mathematically, it is defied in Equation 4.9
T hroughput= D
where ‘D’ represents the total data transferred and ‘T’ represents the total unit of time taken.
4.5.4
Comparison of Performance
The analysis of performance for our framework is done by comparing it with eight other approaches which are summarized in a tabular form as shown in Table 4.2.
Table 4.2: Summarization of previous approaches
Approach Similarity Computation Technique Similarity computed among
UVS[16] Vector Similarity User
IVS[19] Vector Similarity Item
UPCC[18] PCC User
IPCC[25] PCC Item
UIPCC[12] PCC User and Item both
UIVS[20] Vector Similarity User and Item both
EigenRank[21] Kendall Rank Correlation Coefficient User
CloudRank[26] Kendall Rank Correlation Coefficient User
To make the matrix sparser some entries in user-item matrix are removed randomly, since in real world problem, the matrices are sparser. Top-k is set as 10 in experiments. Table 4.3 and Table 4.4 shows the experimental results. NDCG performance based on Response time is shown in Table 4.3 and NDCG performance based on throughput is shown in Table 4.4. NDCG10 in the second row represents the NDCG values of top 10 ranks of web services, whose values can be calculated by using the Equation 4.6.
Table