Procedia Computer Science 93 ( 2016 ) 886 – 892
1877-0509 © 2016 The Authors. Published by Elsevier B.V. This is an open access article under the CC BY-NC-ND license (http://creativecommons.org/licenses/by-nc-nd/4.0/).
Peer-review under responsibility of the Organizing Committee of ICACC 2016 doi: 10.1016/j.procs.2016.07.273
ScienceDirect
6th International Conference On Advances In Computing & Communications, ICACC 2016, 6-8
September 2016, Cochin, India
A Web Service Reliability Prediction using HMM and Fuzzy Logic
models
Suhas Honamore
a,∗, Santanu Kumar Rath
a aDept of CS&E, National Institute of Technology, Rourkela-769008, IndiaAbstract
With the increasing popularity of using Service-Oriented Systems (SOS), the reliability is becoming a significant concern for SOS. SOS are mainly built by Web services, hence prediction of reliability of Web service(s) leads to major concern in SOS. In this paper, Hidden Markov Model (HMM) and Fuzzy logic prediction model are used to predict reliability of Web service(s). The experiments are often conducted on real time Web services. The maximum likelihood value in HMM are calculated by Estimation-Maximization algorithm. Viterbi algorithm is used to restore the hidden states in HMM. The throughput, response time, and successful invocation of Web service are used to form rules in Fuzzy logic model. This helps to model highly complex problems that have multi-dimensional data. These experimental results prove better prediction method as compared to other conventional methods.
c
2016 The Authors. Published by Elsevier B.V.
Peer-review under responsibility of the Organizing Committee of ICACC 2016.
Keywords: Fuzzy Logic; Hidden Markov Model; Web Service; Reliability
1. Introduction
Now a days, the service-oriented system (SOS) has been largely applied in different domains, such as automotive systems, business-to-business collaboration, etc. SOS is essentially a collection of services. The reliability of SOS mainly depends on the reliability of associated Web service(s).
Presently, to predict reliability of software, a number of methods exist, which consider the software failure rate to model. Generally, number of failures{Nt}arrived between time 0 and t; are used to predict the software failure rates.
Most of these models assume that{Nt}t>0is an non-homogeneous Poisson Process (NHPP), for which failure rates are deterministic function. But in case of SOS, reliability depends on the Web services and for different users same Web service can give different failure rates. Since Hidden Markov Model (HMM)1focuses on discontinuous nature of failure, one can use HMM as prediction model to predict Web service’s reliability. Further, the Fuzzy logic is can be used to cluster and predict the Web service’s reliability.
∗Corresponding author. Tel.:+91-903-577-8340 E-mail address:[email protected]
© 2016 The Authors. Published by Elsevier B.V. This is an open access article under the CC BY-NC-ND license (http://creativecommons.org/licenses/by-nc-nd/4.0/).
Fuzzy logic is another way of modeling technique which is categorized as a black box model. Often fuzzy variables are uncertain or imprecise, based on these fuzzy logic delivers efficient solutions for partially known and non-linear systems. This makes fuzzy logic different modeling technique from other empirical modeling. The membership functions are used to extract the relationships between inputs and outputs. Generally, these membership functions use a range of values from 0 to 1 to describe variables. This continuum range of values differentiate the fuzzy model from the classical True-False logical concept. In this study, fuzzy logic modeling is implemented to predict reliability of Web service. The results of fuzzy models are compared with HMM model.
Rest of this paper is organized as follows. Section 2 discusses about related work. Section 3 explains how hidden Markov model is used as reliability model. Section 4 gives the brief description about fuzzy logic prediction model. Section 5 explains the metrics used to evaluate models. Section 6 contains the experiments carried out on Web service dataset and results of HMM and Fuzzy model are compared. Finally Section 7 concludes the paper.
2. Related Work
A number of methods have been proposed by a good number of researchers to predict the Web service reliability as noted from literature. A discrete time Markov chain (DTMC) based approach is proposed by Yingxin Ren et al.2 to predict composite Web services. Based on static BPEL code structure analysis and dynamic run-time information, Bixin Li et al.3proposed an approach to predict reliability of Web service. Luigi Coppolino4 developed a tool for BPEL designers which allows to conduct reliability analysis on planned workflows. Considering the architecture of SOS and partial information published for service, Vincenzo Grassi5presented a methodology to predict reliability for SOS. Jorge Cardoso et al.6addressed workflow based reliability prediction of service-oriented computing applications using graph reduction techniques.
In the field of SOA, HMM is used as a prediction model. To improve the quality of Web services security and attack detection, Gholamali Rahnavard et al.7proposed a HMM model, which detects the Web services Anomaly detection. Using HMM, Chen et al.8presented a method where survivability of SOA is treated as a multidimensional Quality of Service (QoS) property. V. Grassi, and S.Patella,9 used the information provided by each assembled service and presented ’algorithmic reliability analysis’ methodology to predict service assembler reliability. Using HMM, Malik et al.10presented a method to predict Web service reputation, where feedbacks are not available.
Based on fuzzy logic, Mohamed Almulla et al.11 presented a Web services selection model, where model can handle consumers’ imprecise preferences with fuzzy sets. Elizabeth J.Chang et al.12proposed a modeling language tool to model the fuzzy and dynamic nature of trust. This paper presents a novel method of reliability prediction using fuzzy logic and comparatively it has been proved for better accuracy of prediction.
3. Hidden Markov Model as Reliability model
3.1. Modeling of failure process with HMM
To use HMM framework, it’s essential to assume the rate of failure processΛ, whereΛ ={Λi}i≥1is of finite set withNelements in it. Let,{λ(1), λ(2), ..., λ(N)}be a possible set forΛ. This leads to following:
• Λis a discrete-valued Markov chain;
• times between failures{XN}N≥1are independent; like for a Web service, failures may rise in different time for different users
• XNhas an exponential distribution with parameterλ(j); as Web service failure caused from server side increases
the failure rate to all users
Process which meet these assumptions is a hidden Markov chain. The benefit of HMM with respect to other NHPP models is that it considers failure rates as discontinuous function. The following parameters define the HMM:
• Initial state distributionΛ1, given asπj=P(Λ1=λj), 1≤ j≤N
• The values{λ(1), λ(2), ..., λ(N)}represent failure rates
3.2. Parameter estimation
Standard procedures for evaluating HMM parameters include batch learning, implemented with specific Expec-tation - Maximization (EM) techniques (such as numerical optimization techniques) or the Baum-Welch (BW) al-gorithm. In both cases, parameters of HMM are evaluated by more than a few training iterations, till the objective function (e.g., maximum likelihood) is maximized.
In HMM, complete datayn
1=(xn1, λn1) is divided into subsets as observed dataxn1and missing dataλn1. This missing data complicates the parameter estimationηby likelihood maximization. EM algorithm is used to restore the missing data, which works in following steps:
• Estimation (E) step: function Q determined as:
Q(η, η(m))=E
η(m)[logPη(Λn1,Xn1=xn1) | X1n=xn1] (1)
• Maximization (M) step: the function Q in respect ofηis maximized as:
η(m+1)=arg max
η Q(η, η
(m))
(2) The sequence of maximization tends towards to consistent solution after running it for some iteration. In this study 50 iterations are performed to get consistent solution. The distribution values can be calculated by running the Baum-Welch algorithm, first from start time to forward and second from end time to backward; so this is called as
forward-backwardalgorithm.
3.3. Hidden states Restoration
One can restore the unknown states in the context of HMM, by giving values to an unknown state sequenceλn1, known as hidden states. A characteristic approach to restore the hidden states is that process for most likely values by considering known sequence valuesxn
1. This results in maximum a posteriori, which can be found out using Viterbi algorithm13, computed in the following manner:
argmax
ληi
Pη(Λn1=λn1 | X1n=xn1) (3)
3.4. Bayesian Information Criterion
Models having moderate complexity values, are difficult to judge. Hence to overcome this criterion based on log-likelihood parameter, Bayesian Information Criterion (BIC)14 is used for selecting a best model among the set of given models. The lowest BIC value for a model is preferred as best model. The criterion is given as follows:
BIC(K)=log(PηˆK(xn1))−v2Klog(n) (4)
where log(PηˆK(xn1)) represents a maximum log-likelihood withKhidden states;nrepresents length of observed failure sequence; andvKrepresents number of independent parameters inηK.
4. Fuzzy Logic
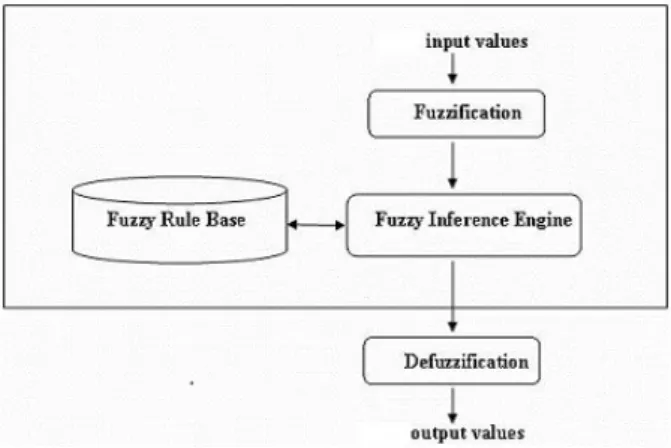
Basically the fuzzy system contains 4 components: fuzzification, fuzzy inference engine, fuzzy rule base, and defuzzifications, which are connected as shown in Figure-1.
Fuzzification checks one or more membership functions and changes every input data to points of membership. In fuzzy logic the key idea is, it allows an object with partial belonging to different subsets of universal set. Membership
Fig. 1. Fuzzy Logic Modeling Process
functions are used to convert these partial belonging data to 0 to 1 range. To assign membership functions to fuzzy variables different approaches are used, such as, inductive reasoning, genetic algorithms, neural networks, inference, intuition, angular fuzzy sets, and rank ordering. These membership functions may take numerous structures, but generally triangular ones are in use because of it is a simple linear function.
All possible relations between input and output data are listed as rules in fuzzy rule base. The If-Then format is used to express the rule. In fuzzy logic modeling, all nonlinear relationships, model complications, and the uncertainties are considered in the descriptive fuzzy inference procedure. This procedures don’t use any mathematical equations and model parameters, but it can be presented in the form of If-Then statements. In this study, Mamdani-type fuzzy rules are constructed by using throughput and response time as input variables and successful invocation as output variable.
Considering all rules from fuzzy rule base, fuzzy inference engine learns how to transform a set of inputs to corresponding outputs. The product (prod) and minimization (min) are two kinds of inference operators which are used frequently.
Defuzzification changes the subsequent fuzzy outputs from fuzzy inference engine to a number. There exist numer-ous defuzzification techniques, for example, rightmost maximum (RM), leftmost maximum (LM), mean of maxima (MOM), centre of gravity (centroid), bisector of range (BOA), and so on15. This study considers the most regularly used centre of gravity (centroid) technique. For the discrete case, centroid technique is given as15:
K∗=iμ(Ki)Ki
iμ(Ki) (5)
where Ki indicates the output value in theith subset, K∗is the defuzzified output value, andμ(Ki) denotes the
membership value of the output value in theithsubset.
5. Metrics
Different metrics are used to compare model performances. Mean Absolute Error (MAE) measures the average magnitude of the errors from the set of predicted values. It is used to measure accuracy of continuous variables. Mean Squared Error (MSE) is used to measure how close a predicted value is with observed value. Another parameter is used to measure performance i.e., root mean squared error (RMSE). The RMSE is directly interpretable in terms of measurement units, and so is a better measure of goodness of fit. This study uses MAE and RMSE to compare models. MAE is the average of difference between predicted and observed values for testing data set, which is given as below:
MAE=
u,i|Pu,i−Ou,i|
N (6)
The RMSE for data set is calculated as given below:
RMS E=
u,i(Pu,i−Ou,i)2
wherePu,iis the predicted failure probability of Web serviceifor useru;Ou,idenotes the observed failure by useru
for Web servicei; andNis the number of predicted values.
6. Experiments
This section gives the brief description about the implementation of HMM and fuzzy models.
6.1. Datasets
To predict reliability, the dataset is considered from QoS dataset16. Randomly some Web services are picked and Web services having same functionality are accessed, at-least 100 times from different computers. The overall dataset has 30 Web services invoked by 50 different users at-least 100 times. The throughput and response time of similar functionality having Web services are observed byWireshorksoftware. Depending on the invocation, the failure rate for each Web service is calculated and they are arranged in the form of matrix of size 30x50. This matrix has been used as a dataset for this study.
For HMM model, dataset is divided into 8 different groups (GRP1 to GRP8), each group contain 4 similar function-ality Web services (except GRP7 and GRP8, which have 3 similar functionfunction-ality Web services). There is a possibility that service consumer can switch to other service provider who provides same functionality Web service, if the in-voked Web service is failed. Here, this transition probability of Web services is denoted by 4x4 matrix, known as transition probability matrix.
To evaluate fuzzy model, throughput and response time are used as input to member functions. The successful invocation of Web service is considered as outputs.
The different prediction methods HMM and fuzzy models are evaluated by randomly removing some percentage of data from dataset. The unremoved data is referred as data density (DEN) for prediction, while removed data is used for validation purpose.
6.2. Hidden Markov Model
The HMM is applied on dataset, while the description for HMM implementation on first data group (GRP1) is given here.
In HMM, for a particular problem, identifying number of hidden states is not an easy task. So the first step is to find the number of hidden statesKfor data group GRP1. To find that the HMM is executed withKmin=1 toKmax
=7 and BIC values are calculated for them. It has been observed that BIC value is less withK =4, which fits the complexity of data. Same procedure is followed for all data groups, the result shows that maximum data groups (6 out of 8) have less BIC values with K = 4. Hence, throughout experiment the number of hidden states used is 4. The transition probability matrix used for dataset group GRP1 is shown in Table-1. Depending on transition matrix, the probability matrix converges to particular valued matrix afternthiteration. So initially, the probability matrix is
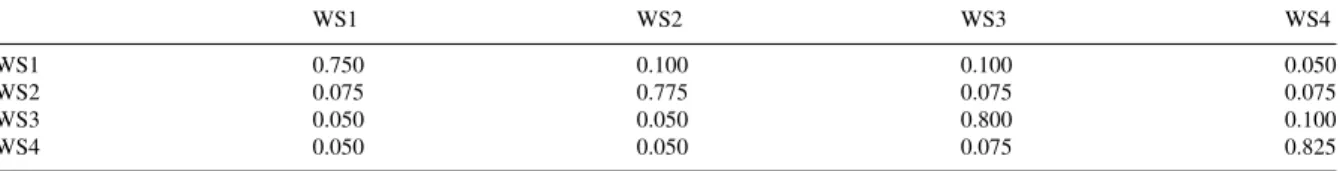
considered with equal probability for all Web services. Table 1. Transition Matrix for GRP1
WS1 WS2 WS3 WS4
WS1 0.750 0.100 0.100 0.050
WS2 0.075 0.775 0.075 0.075
WS3 0.050 0.050 0.800 0.100
WS4 0.050 0.050 0.075 0.825
The emission matrix (EMS MAT) for a group is obtained based on the failure invocations for the Web services and it is represented using 4x50 matrix. For WS1, 5172 number of invocation are made by 50 different users. And for user1, 13 invocations failed, which leads to an entry of 0.002513 in emission matrix for GRP1; i.e. EMS MAT (1, 1) =0.002513.
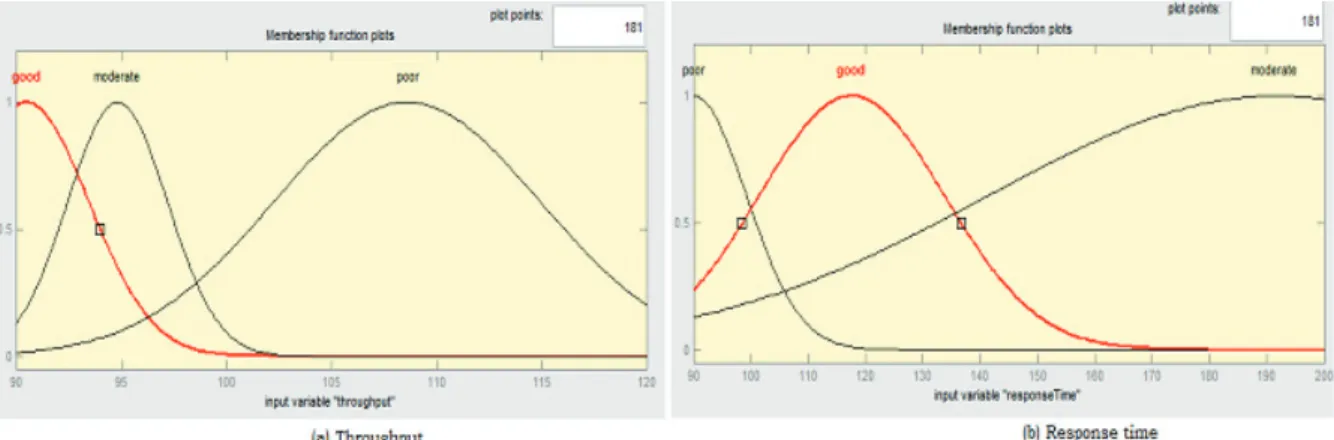
Fig. 2. Web service membership functions
Based on transition and emission matrices, sequence of states and sequence of emission symbols are generated. Running EM algorithm on these matrices in an iteration of 50, most likelihood states are identified. Using Viterbi algorithm, most likelihood states are restored.
Using restored states along with known states the logarithmic likelihood probability failure is calculated. Then the MAE and RMSE values for data group GRP1 is calculated by using equation 6 and 7 respectively. Same procedure is followed for remaining groups and MAE, RMSE values for them are noted.
6.3. Fuzzy Logic
In this model, clustering was conducted on Web services throughput and response time. Here, finding the optimum number of clusters which fits the given dataset is the main issue because of unsupervised nature of data set17,18. In this
work, fuzzy weighting exponent (m) has been assumed as 2. This was based on the work done by Pal and Bezdek19,
which claim that Fuzzy C-Means types of algorithms normally usesm=2.
This model categorizes the dataset into two different clusters, where depending on each input data a particular cluster is assigned. The objective function, the membership functions, and the cluster centers are computed. The
throughput and response time of member functions are divided asGood,Moderate, andPoor, which is shown in
Figure-2. Less the value of throughput time indicates the more reliable Web service. In case of response time, Web services having more response time increases their throughput time; while good successful Web service invocations have 100ms to 140ms of response time; and Web services having less response time are returned immediately with error messages. Hence thegoodmember function of response time lies in the middle.
The rules for fuzzy model are written verbally, much like human thoughts. The centroid and product methods were implemented as defuzzification methods and the inference operator, respectively.
RMSE and MAE results with different data densities of the data points by the implemented HMM and fuzzy model are shown in Table-2. From Table-2, it has been observed that the fuzzy model predicts the data points successfully, and the accuracy of both models are given in Table-3.
Table 2. MAE and RMSE values of all models
Methods DEN=50% DEN=60% DEN=70% DEN=80% DEN=90%
MAE RMSE MAE RMSE MAE RMSE MAE RMSE MAE RMSE
HMM 0.2912 0.4534 0.2012 0.3606 0.1697 0.3147 0.1412 0.2862 0.1209 0.2493 Fuzzy Model 0.2892 0.4457 0.1996 0.3523 0.1678 0.3110 0.1403 0.2847 0.1191 0.2479
Table 3. Accuracy of models
Methods Accuracy
HMM 91.6%
Fuzzy model 93.4%
7. Conclusion
A fuzzy model is implemented to predict the Web service(s) reliability. Throughput and response time of Web services are used as input parameters for this model. Successful predictions of observed Web service by the model, suggest that fuzzy logic could be a useful modeling technique for Web service reliability.
It is observed that fuzzy model gives the greater accuracy of 93.4% which is better than HMM. In future, one can use various Artificial Neural Networks (ANN) to form rules for fuzzy model, which may give higher accuracy values than fuzzy model.
References
1. L. R. Rabiner, B.-H. Juang, An introduction to hidden markov models, ASSP Magazine, IEEE 3 (1) (1986) 4–16.
2. Y. Ren, Q. Gu, J. Qi, D. Chen, Reliability prediction of web service composition based on dtmc, in: Secure Software Integration and Reliability Improvement, 2009. SSIRI 2009. Third IEEE International Conference on, IEEE, 2009, pp. 369–375.
3. B. Li, X. Fan, Y. Zhou, Z. Su, Evaluating the reliability of web services based on bpel code structure analysis and run-time information capture, in: Software Engineering Conference (APSEC), 2010 17th Asia Pacific, IEEE, 2010, pp. 206–215.
4. L. Coppolino, L. Romano, V. Vianello, et al., Security engineering of soa applications via reliability patterns, Journal of Software Engineering and applications 4 (01) (2011) 1.
5. V. Grassi, Architecture-based reliability prediction for service-oriented computing, in: Architecting dependable systems III, Springer, 2005, pp. 279–299.
6. J. Cardoso, A. Sheth, J. Miller, J. Arnold, K. Kochut, Quality of service for workflows and web service processes, Web Semantics: Science, Services and Agents on the World Wide Web 1 (3) (2004) 281–308.
7. G. Rahnavard, M. S. Najjar, S. Taherifar, A method to evaluate web services anomaly detection using hidden markov models, in: Computer Applications and Industrial Electronics (ICCAIE), 2010 International Conference on, IEEE, 2010, pp. 261–265.
8. L. Chen, Q. Wang, W. Xu, L. Zhang, Evaluating the survivability of soa systems based on hmm, in: Web Services (ICWS), 2010 IEEE International Conference on, IEEE, 2010, pp. 673–675.
9. V. Grassi, S. Patella, Reliability prediction for service-oriented computing environments, Internet Computing, IEEE 10 (3) (2006) 43–49. 10. Z. Malik, I. Akbar, A. Bouguettaya, Web services reputation assessment using a hidden markov model, in: Service-Oriented Computing,
Springer, 2009, pp. 576–591.
11. M. Almulla, K. Almatori, H. Yahyaoui, A qos-based fuzzy model for ranking real world web services, in: Web Services (ICWS), 2011 IEEE International Conference on, IEEE, 2011, pp. 203–210.
12. E. J. Chang, F. K. Hussain, T. S. Dillon, Fuzzy nature of trust and dynamic trust modeling in service oriented environments, in: Proceedings of the 2005 workshop on Secure web services, ACM, 2005, pp. 75–83.
13. G. D. Forney Jr, The viterbi algorithm, Proceedings of the IEEE 61 (3) (1973) 268–278.
14. I. Chang, S. W. Kim, Modelling for identifying accident-prone spots: Bayesian approach with a poisson mixture model, KSCE Journal of Civil Engineering 16 (3) (2012) 441–449.
15. J. Jantzen, Design of fuzzy controllers, Technical University of Denmark, department of automation, lyngby Denmark, technical report (98-E) (1998) 864.
16. Z. Zheng, M. R. Lyu, Personalized reliability prediction of web services, ACM Transactions on Software Engineering and Methodology (TOSEM) 22 (2) (2013) 12.
17. M. R. Rezaee, B. P. Lelieveldt, J. H. Reiber, A new cluster validity index for the fuzzy c-mean, Pattern recognition letters 19 (3) (1998) 237–246.
18. K.-L. Wu, M.-S. Yang, A cluster validity index for fuzzy clustering, Pattern Recognition Letters 26 (9) (2005) 1275–1291.