UPTEC F 15004
Examensarbete 30 hp
Februari 2015
Development of a cloud service
and a mobile client that visualizes
business data stored in Microsoft
Dynamics CRM
Teknisk- naturvetenskaplig fakultet UTH-enheten Besöksadress: Ångströmlaboratoriet Lägerhyddsvägen 1 Hus 4, Plan 0 Postadress: Box 536 751 21 Uppsala Telefon: 018 – 471 30 03 Telefax: 018 – 471 30 00 Hemsida: http://www.teknat.uu.se/student
Abstract
Development of a cloud service and a mobile client
that visualizes business data stored in Microsoft
Dynamics CRM
Jeton Mustini
In this master thesis a prototype application is developed to help decision makers analyze data and present it so that decision makers can make business decisions more easily. The application consists of a client application, a cloud service, and a Microsoft Dynamics CRM system. The client application is developed as a Windows Store App, and the cloud service is developed as a web application using ASP.NET Web API. From the client users can connect to the cloud service by providing a set of user credentials. These credentials are then used against the users Microsoft Dynamics CRM server to retrieve business data. Data is modeled in a component on the cloud service to useful information defined by key performance indicators. The user's hierarchical organization structure is also replicated in the cloud service to enable users to drill-down forward and backward between organizational units and view their key performance indicators. These key performance indicators are finally returned to the client and presented on a dashboard using interactive charts.
Tryckt av: Uppsala Universitet, Uppsala ISSN: 1401-5757, UPTEC F15 004 Examinator: Tomas Nyberg Ämnesgranskare: Arnold Pears Handledare: Nils Ingvarsson
ii
SAMMANFATTNING
I detta examensarbete har en prototyp applikation utvecklats i syfte att hjälpa och stödja beslutsfattare att analysera och presentera data så att affärsbeslut lättare kan fattas. Applikationen består av en klient applikation, en molntjänst och ett Microsoft Dynamics CRM system. Klient applikationen har utvecklats till en Win-dows Store App, och molntjänsten har utvecklats till en webbapplikation i form av ASP.NET Web API. Från klienten kan användare ansluta till molntjänsten genom att tillhandahålla en uppsättning användaruppgifter. Dessa uppgifter används sedan mot användarnas Microsoft Dynamics CRM server för att hämta affärsdata. Datat modelleras i en komponent på molntjänsten till användbar information som definier-ats av olika nyckeltal. Användarnas hierarkiska organisationsstruktur replikeras också på molntjänsten för att möjliggöra det för användarna att navigera sig mel-lan olika organisationsenheter och betrakta motsvarande nyckeltal för dessa. Dessa nyckeltal skickas slutligen tillbaka till klienten för att presenteras på en dashboard. På dashboarden visualiseras nyckeltalen på interaktiva diagram.
iii
CONTENTS
1. Introduction 1 1.1 Background . . . 1 1.2 Aim of Thesis . . . 1 1.3 Technology Constraints . . . 2 1.4 Disposition . . . 2 2. Theory 4 2.1 Decision Support System (DSS) . . . 42.1.1 What are DSS? . . . 4
2.1.2 When to use DSS? . . . 5
2.1.3 Components of a DSS . . . 6
2.1.3.1 Data Component . . . 6
2.1.3.2 Model Component . . . 8
2.1.3.3 User Interface Component . . . 9
2.2 Executive Information Systems (EIS) . . . 9
2.2.1 Key Performance Indicators (KPI) . . . 9
2.2.2 Dashboards . . . 10
3. Introduction to Microsoft Dynamics CRM 12 3.1 Microsoft Dynamics CRM . . . 12
3.1.1 Modules . . . 12
3.1.2 Business Process Flows . . . 12
3.1.3 Sales . . . 13
3.1.4 Security Roles and Business Units Hierarchy . . . 15
4. Problem Formulation and solution 17 4.1 Problem Statement . . . 17
4.2 KPIs Supported by The Application . . . 18
4.2.1 Steps to Solve The Problem Statement . . . 20
4.3 Solution . . . 21
4.3.1 Implementing Organizational Hierarchy . . . 21
4.3.2 Implementing KPI Support . . . 22
4.3.3 Implementing Drill-Down Capabilities . . . 23
4.4 Application Architecture . . . 23
5. Mobile Client 25 5.1 Market Survey . . . 25
iv
5.2.1 Programming Languages . . . 25
5.2.2 Integrated Development Environment (IDE) . . . 26
5.3 Software Patterns . . . 27
5.3.1 Model-View-ViewModel (MVVM) . . . 27
5.3.2 Repository Pattern . . . 28
5.3.3 Loose Coupling . . . 29
5.3.4 Dependency Injection with Unity . . . 31
5.3.5 Prism Framework . . . 32
5.4 Design . . . 33
5.4.1 Pages in client application . . . 33
5.4.2 Login Page . . . 35
5.4.3 Dashboard Page . . . 37
5.4.4 Customize Page . . . 40
5.4.5 Detail Page . . . 42
6. Cloud Service 44 6.1 ASP.NET Web API . . . 44
6.2 Web Service Component . . . 44
6.3 Data Retrieval Component . . . 46
6.3.1 Accessing Dynamics CRM . . . 47
6.3.2 Claims-Based Authentication . . . 47
6.4 Modeling Component . . . 50
7. Discussion and Conclusion 51
8. Future Work 52
1
1.
INTRODUCTION
1.1
Background
This project has its background due to sales organizations frequent need to com-bine and present information to decision makers in a clear and accessible way. This need arises because decision makers continuously have to take strategic decisions, in conjunction with this, their organizations sales support systems also contain in-creasingly relevant data that can be used as a basis for the compilation of decision making. Trends in IT-organizations are towering partly to increased accessibility to CRM (Customer Relationship Management) systems and partly to the greater accessibility to data in existing and new systems support. This is driven by the in-creasing tendency to use system support within sales and an increased introduction of portable clients like phones and tablets as a sale tool. For both sales people and decision makers.
The information that business organizations have today has increased a lot. This information is often stored in some form of database. Often some software is used to work with the data. As an example is Microsoft Dynamics CRM, which is used to work with SQL Server. The software can be used for both managing the data and for displaying the data. The problem here is that the type of queries that can be requested from the software are limited. Executives need to go through a lot of steps to come to the desired information. Another problem with these systems are that they are not optimized for mobile devices like phones and tablets. These tools have become an important part of our daily lives.
Executives need to make decisions quickly and in any situation. This is where the project comes in, to provide this service. By developing a prototype applica-tion that can retrieve data from organizaapplica-tion’s Microsoft Dynamics CRM system, process the data to useful information, and display that information.
1.2
Aim of Thesis
The aim of the thesis is to develop a prototype application that retrieves information from Microsoft Dynamics CRM defined by specific KPIs (key performance
indica-1. Introduction 2
tors). In between the information is to be processed by a cloud service developed as a web application. The whole solution will consist of an integration between the following three parts, where the client application and the web application were developed during the project:
• A client business application developed as a Windows Store App.
• A web application in the form of a Web API (application programming inter-face), for processing information and querying Microsoft Dynamics CRM after defined KPIs.
• A Microsoft Dynamics CRM system where business data is stored and acts as a database.
The application is developed to be a simple form of an executive information system, where the main view consist of a dashboard displaying data on charts with drill-down capabilities. The user connects to the web application by providing user-credentials. The web application then processes these credentials and requests information from a Microsoft Dynamics CRM server specified by a URI (Uniform Resource Identi-fier) in the credentials. The information is modeled on the web application defined by KPIs and then returned to the client application. The client application and the web application were developed using Microsoft’s IDE (integration development environment) called Visual Studio and the CRM System used were Microsoft Dy-namics CRM. The communication between the different parts of the application is done through HTTPS (Hyper Text Transfer Protocol Secure).
1.3
Technology Constraints
This project was carried out for an IT consultant company that is based in Uppsala with the name Apprexo. Apprexo focuses on developing and leveraging customized solutions of Microsoft Dynamics CRM. They exclusively work with tools and tech-nologies from Microsoft’s product portfolio, and therefore, the project has been limited to these tools and technologies.
1.4
Disposition
The structure of the thesis follows the workflow during the project. Chapter 2, theory, describes the components and key elements that one need to know about DSS (Decision Support Systems), EIS (Executive Information Systems), KPIs and Dashboards. Chapter 3 introduces Microsoft Dynamics CRM. Chapter 4 formulates theoretically the problem the application is trying to solve, and the approach used to solve the problem. The chapter ends with a simple overview of the application
1. Introduction 3
architecture. Chapters 5 and 6 deals with the design, software patterns and tech-nologies used to build the components, starting with the client component, followed by the cloud component and ending with how users authenticate against the data component. After showing how the prototype application is build a discussion and conclusion follows in chapter 7. The thesis ends with future work on the application in chapter 8.
4
2.
THEORY
The project falls within the field of Decision Support Systems (DSS) and Executive Information Systems (EIS). To better understand these topics and the components that they consist of, literature studies where done on these fields. The critical part of these literature studies is presented in this chapter.
2.1
Decision Support System (DSS)
Every day are we faced with situations where we have to make decisions, from choos-ing the clothes that we should wear in the mornchoos-ing, to what strategy the company should use to be competitive in the future? In order to make good decisions, one must have sufficient information to distinguish a good decision from other less good decisions.
The information used to support these decisions may come in various ways. They can be based on existing data in an organization’s system, or they can be based on historical data. And in some cases that is not sufficient, and new data must be collected in order to make the right decisions.
This data can come and be brought together from different sources and be orga-nized in many ways. The format of the data may also vary from numbers, graphs and images etcetera. But having a lot of data available is not enough to make good decisions, it is when this data is turned into useful information that good decisions can be made. This process of organizing and processing data to create information for different decisions is called modeling. Modeling can also vary greatly from sim-ple representations to very advanced mathematical functions. All of these steps, to bring together the right data and model it to information in order to make better decisions can be accomplished with decision support systems.
2.1.1
What are DSS?
Decision Support Systems are computer-based systems that bring together data from different sources to be analyzed after specific models [1]. The results of the modeling will help decision makers to better evaluate the assumptions that are the basis for the modeling. DSS allow decision makers to access information when they
2. Theory 5
need the information in their preferred format for that information. This allows the decision maker to explore business intelligence in their organization in a timely and effective manner.
The following properties formally characterize a computer-based decision support system:
• A decision support system retrieves data from multiple sources.
• A decision support system transforms large amounts of data through mod-els into useful and insightful information that facilitate and enable decision-makers to make good decisions.
• A decision support system must provide a user-friendly interface that allows the user to interact and navigate through the organization.
In the prototype application developed there will only be one data source used, and the amounts of data to be transformed will be restricted.
2.1.2
When to use DSS?
Decision Support Systems are in use today in virtually every field imaginable from search engines that scan and gather huge amount of information to organize it for decision-making to presidential campaigns. As an example, in 2008 a DSS called
Neighbor to Neighbor were used during American president Barack Obama’s elec-tion campaign [2]. In that DSS there were informaelec-tion such as names and addresses of voters who they thought had not yet decided on whom to put their vote on. In the DSS there were also information about election issues that were popular in a specific region or district, and information on results from previous elections in these areas. With help of this collected information in the DSS the campaign staff during the election could more effectively build their presentations and flyers to convince voters to vote for Obama. Since they already knew from the DSS what voters from different areas might base their decisions on.
Because DSS are used in so many areas, it is of interest to know when it is appropriate to use a DSS? This varies depending on the situation but DSS are most useful on opportunities or problems were it is not obvious or clear what information is needed to be provided, or what criteria and models is needed to be applied. That is when it is not obvious or directly given how the choices should be made [3].
Although DSS are most often used when the decisions are not a priori, they can still be useful on more organized problems. A few of these problems related to an organization are [4]:
2. Theory 6
• When managers and staff spend a lot of time finding, identifying, and analyzing information already stored in their existing systems.
• Management meetings are delayed due to the invalidity of information, that is the information is constantly challenged or updated.
• There is no user-friendly interface that allows the user to interact and navigate through the organization.
• When data collection is already happening but the information in the data is not used to its full potential.
From the listed points our application is trying to target points one and three. The reason is that managers have to go through a lot of steps to get to the right infor-mation, and aggregate or model the information to be useful. Often the information is presented in a not so user friendly report, and with no capabilities to view the same information for other parts of the organization. Which is the case for Microsoft Dynamics CRM.
There are many more cases when a DSS can be used, and they all have the same goal, to help the decision maker to make decisions better and more easily.
2.1.3
Components of a DSS
Decision support systems consist of three main components, a database management system (DBMS) that assist with data and necessary functionality to retrieve data in a suitable format. A model base management system (MBMS) that keeps track of all the models used for analysis. And a user interface (UI) where all incoming information starts and all outgoing information ends. Which represents all screens presenting information to the user.
2.1.3.1 Data Component
Decision making and business intelligence in general are dependent on data. So there needs to be data, in order to do any business intelligence. By analyzing the data we can get a better understanding of the business, and its performance, which in turn means we can improve our decision making. Therefore, before understanding how to make models or how to project the appropriate information to the user interface, it is important to understand what data should be included in the DSS, and what is meant by data in a DSS?
2. Theory 7
Data can be thought as things that are known or assumed [5]. The term gener-ally refers to facts from which conclusions can be drawn. One of the main purposes of DSS is to transform these data into information that can be used to help the deci-sion maker. So while data represent things that are known or assumed, information refers to the processed data or knowledge acquired from data. If the data in the data component is not in or by itself information, or if the data cannot be transformed into information, that data should not be included in the data component, since it is not providing any useful information. The goal of a DSS and business intelli-gence in general is to study historical and current patterns, and performance so as to predict the future and improve the organization’s response to future events. This means that the data need to represent practical indicators of what is happening in the organization, indicators of when changes occur, and indicators of when and how actions need to be taken to respond to these changes.
Most DSS include financial information. These reflect quantitative data indicating revenues by organizational units. Such data allows a manager to evaluate returns on investments and profitability indices.
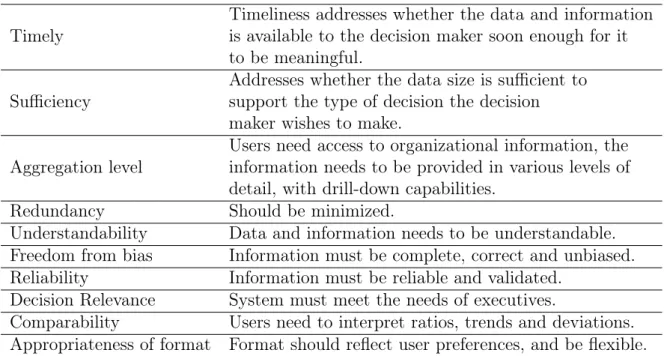
To measure important factors managers use KPIs which reflect how closely the organization is moving toward its strategic goals. For the data in the data com-ponent and the information presented to the user to be useful it should meet the characteristics in table 2.1.
Usually this data is stored in a relational database which corresponds to the data component. A relational database consist of a collection of related tables. Each table in the database is a physical representation of an object or entity that is in a tabular format consisting of rows and columns. Columns are the fields of a record or the attribute of an entity. The rows contain the values or data instances. Information from the database can be accessed by joining tables that use indexes. To reduce the redundancy and anomalies, and keep the database maintainable, relational databases follows a set rules called normalization rules.
In our application Microsoft Dynamics CRM acts as the role of the data component. Microsoft Dynamics CRM uses a meta data driven architecture. Meta data is simply information about data. In this architecture the user works with the meta data which is an abstraction layer above the database instead of working with the database directly. This architecture provides the flexibility to create custom entities and additional system entity attributes in Microsoft Dynamics CRM described later.
2. Theory 8
Table 2.1: Important characteristics of data and information.
Timely
Timeliness addresses whether the data and information is available to the decision maker soon enough for it to be meaningful.
Sufficiency
Addresses whether the data size is sufficient to support the type of decision the decision maker wishes to make.
Aggregation level
Users need access to organizational information, the information needs to be provided in various levels of detail, with drill-down capabilities.
Redundancy Should be minimized.
Understandability Data and information needs to be understandable. Freedom from bias Information must be complete, correct and unbiased. Reliability Information must be reliable and validated.
Decision Relevance System must meet the needs of executives.
Comparability Users need to interpret ratios, trends and deviations. Appropriateness of format Format should reflect user preferences, and be flexible.
2.1.3.2 Model Component
The purpose of the model is to represent relationships in the application in such way that decision makers can be guided towards a desired goal. The involvement and support of these models is what differentiates DSS from other kind of computerized systems. It is the models that make the system a DSS. Hence to understand DSS, one must understand the definition of modeling.
Modeling is a simplification of some phenomenon for the purpose of understand-ing its behavior. Modelunderstand-ing simplifies and abstracts detailed event data to allow understanding of the major forces acting upon the alternatives. It involves the pro-cess of removing unnepro-cessary detail, and thereby allowing the important patterns to shine through the details. This way choice contexts becomes simplified so that de-cision makers can understand options. As an example statisticians develop and use regression models, which have the goal to determine the factors to understanding the variability in the phenomenon. Most business decisions have a large number of factors, and decision makers need to filter the essential components from the irrele-vant ones [6].
In our application the models will be located in a component on the cloud service and will consist of a simple library of classes.
2. Theory 9
2.1.3.3 User Interface Component
To most decision makers, the user interface is the DSS. Because it is the user interface that includes all the mechanisms by which commands, requests, and data are entered into the DSS, as well as all the methods by which results and information are output by the system. The purpose of the user interface is to enable communication between the human user and the computer, or device. This area of communication is known as human-computer interaction. The goal with human-computer interaction is to minimize the amount of incorrectly perceived information while also minimizing the amount of effort expended by the decision maker [7]. A prime concern of this goal is to the speed at which decision makers can overview available information. In addition to making the information more quickly apparent, the user interface must be effective. These interfaces must allow users to work in a comfortable way and to focus on the data and the models in a way that supports the decision to be made.
2.2
Executive Information Systems (EIS)
An EIS is a specialized form of decision support system that supports executives as they analyze important information within their organization. The purpose with an EIS is to provide executives and managers with an easy to use tool that improves the quality of the decisions that are being made in the organization, reduce the amount of time needed to identify problems and opportunities, together with the ability to get access to data and models faster [8].
The difference between EIS and DSS is that an EIS usually contains data from both external and internal sources, when DSS only contains information from internal sources. The external information an EIS contains can be about competitors or customers etcetera.
An EIS offers many features and capabilities such as consolidation which involves the aggregation of information, drill-down which enables users to acquire layers of detailed information and examine information from different perspectives.
Executives can customize organizational information in the system so that it is read-ily available, self-sufficient and relevant to the executive business needs. This is done on a digital dashboard that integrates information from multiple components and tailors this information to individual preferences. The dashboard also identifies the status of KPIs.
2.2.1
Key Performance Indicators (KPI)
The metrics used by organizations to measure performance are called KPIs. KPIs are measurable attributes of the corporate environment. They are used as a direction
2. Theory 10
of improvement, a target, and a timeframe that can relate specific activities to long term goals. The KPIs used vary depending on the organization because they are defined as factors of importance to stakeholders that relate to their corporate goals [9]. When selecting KPIs in an organization five important questions should be asked:
• What decisions are the KPIs supporting?
• What is really being measured by the KPIs?
• Why do these KPIs matter to the decisions being asked?
• What is already known about these KPIs?
• What is the value of measuring the KPIs further?
By answering these questions when adopting KPIs, they will direct the organization in the following ways:
• Be practical indicators of the organization’s processes;
• Be directional indicators that specify progress in the organization or the ab-sence of progress.
• Be actionable indicators that direct management on what to change in the organization if necessary.
• Be targeted to the business that the organization values most.
2.2.2
Dashboards
Dashboards provide a mechanism to monitor whatever is important to a decision maker, most commonly these are KPIs as discussed earlier. Dashboards can present KPIs or any aspect of the organization.
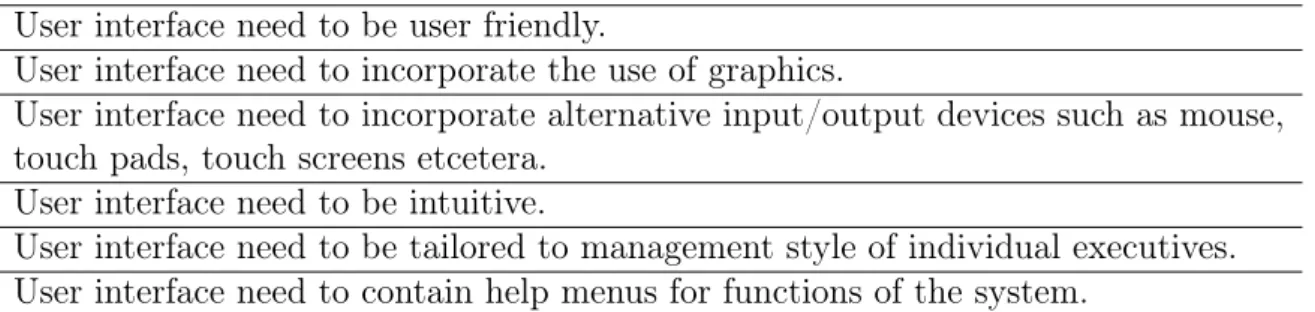
The goal of the dashboard is to present organized data to the decision maker in an easy to understand format. The Dashboard is also interactive, allowing decision makers to drill-down for additional information. Table 2.2 lists some important requirements that the user interface of a dashboard should contain [10]. All of these requirements will not be met by the prototype dashboard we are developing, mainly because of the limited duration of the project.
2. Theory 11
Table 2.2: User interface requirements on the dashboard User interface need to be user friendly.
User interface need to incorporate the use of graphics.
User interface need to incorporate alternative input/output devices such as mouse, touch pads, touch screens etcetera.
User interface need to be intuitive.
User interface need to be tailored to management style of individual executives. User interface need to contain help menus for functions of the system.
12
3.
INTRODUCTION TO MICROSOFT
DYNAMICS CRM
3.1
Microsoft Dynamics CRM
All the information viewed on the client application and processed in the web appli-cation comes from Microsoft Dynamics CRM, for our purposes Microsoft Dynamics CRM serves as the data component in the application. But there is much more to the platform than just acting as a data component. Therefore it is important to understand some of the internal components of the platform and services it provides.
3.1.1
Modules
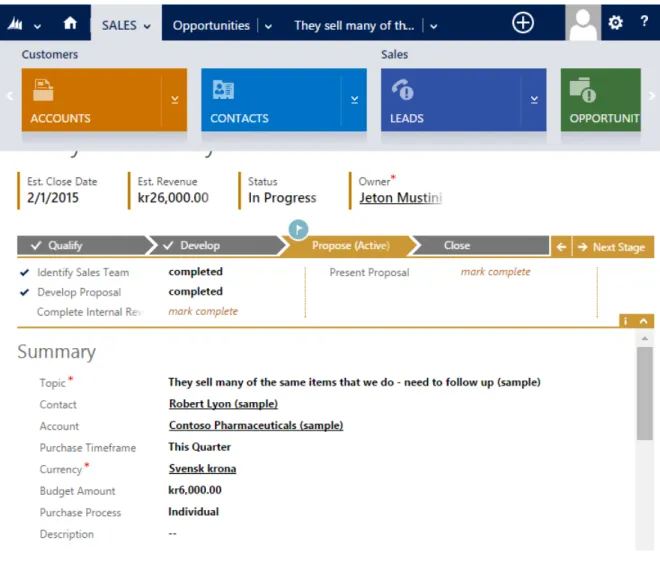
Microsoft Dynamics CRM is a customer relationship management system developed by Microsoft, subsequently referred as Dynamics CRM. The system provides a plat-form for organizations and companies that can be tailored for their business needs. Dynamics CRM can be used for a lot of causes and there is no restriction on how much the platform can be extended. Out of the box the system is delivered with three main modules. The modules are in the areas of sales, marketing and services. Each module contains a number of entities that model and manage business data. Examples of a few entities are contacts, campaigns and events that can be used to follow up, and support activities in sales, marketing and service. Each entity has a number of attributes, where each attribute represents the data of a particular type. For instance the Contact entity has attributes such as address, jobtitle and email etcetera. This is shown in figure 3.1.
3.1.2
Business Process Flows
Dynamics CRM is intended to help organizations, and especially organizations in the sales area, to deal with customers and keep track of various sales processes. These processes are known as Business Process Flows. They are intended to guide sales people through business processes. These processes are represented as headings in the software [11].
Business process flows are made up of different stages, and at each stage, there are several steps to go through by typing in information in fields. A sales person can
3. Introduction to Microsoft Dynamics CRM 13
Figure 3.1: Shows the interface of Dynamics CRM 2013 software. The horizontal panel shows the different entities in the Sales module. Current view is in the Sales module and Opportunities entity. Also showing are some attributes for a specific contact.
see at what stage he or she is at, and what steps must be taken to make progress or terminate a business process. Business process flows are customizable and can be extended to align with the organization’s sales process. Two examples of out of the box sales processes in Dynamics CRM are Lead to Opportunity Sales Process and
Opportunity Sales Process.
3.1.3
Sales
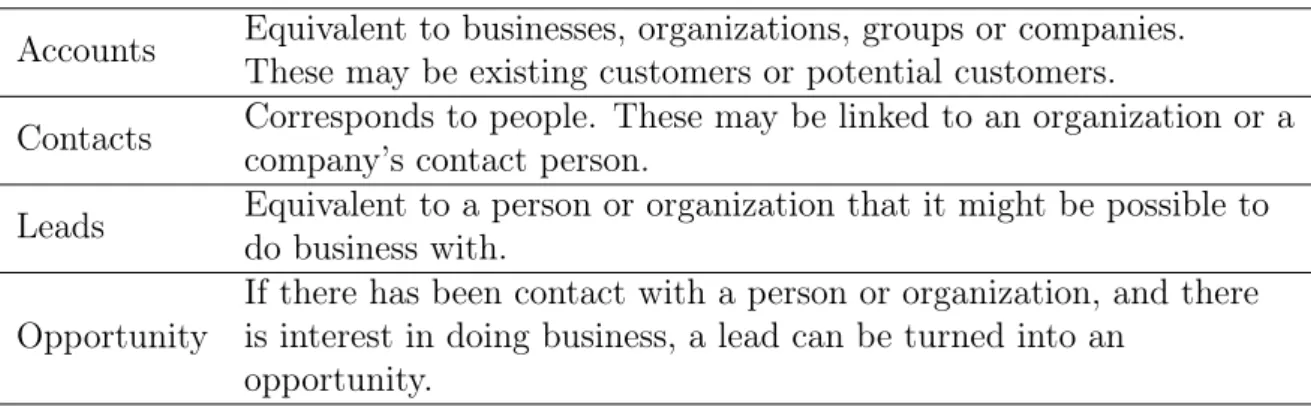
In the sales module there are four important entities managing customers and sales, these are the following entities: Accounts, Contacts, Leads and Opportunities [12]. A quick explanation of these entities is in table 3.1.
A simplification of a typical sales process starts with a sales person having gained a lead, if there is interest in doing business from the customer that lead can be turned into an opportunity. In the opportunity the sales person can present products to
3. Introduction to Microsoft Dynamics CRM 14
Table 3.1: Important entities in the sales module
Accounts Equivalent to businesses, organizations, groups or companies. These may be existing customers or potential customers.
Contacts Corresponds to people. These may be linked to an organization or a company’s contact person.
Leads Equivalent to a person or organization that it might be possible to do business with.
Opportunity
If there has been contact with a person or organization, and there is interest in doing business, a lead can be turned into an
opportunity.
make a deal with the customer, if the customer accepts the deal, a sale can be made and the opportunity can be closed as won.
These type of sales processes are what sales people have to go through in their every-day work. But for sales managers and executives these processes are not interesting. Instead, they are interested in the information that the results of these processes bring. These results are related to the different states opportunities can be in. An Opportunity in Dynamics CRM can be in three different states: open, won or lost [13]. An open opportunity is an opportunity where there is interest from a customer to do business but no sales have been made yet, and the process is ongoing. A won opportunity is an opportunity where a sale has been successfully made by a customer, and a revenue for that opportunity has been realized by the organization. And a lost opportunity is simply an opportunity where business has failed and no revenue will be made for that opportunity.
Based on the different states of opportunities one can arrive at the conclusion that open opportunities are uncertain, in the sense that they might bring revenue if they are won, but not if they are lost. Won and lost opportunities on the other hand are certain, if an opportunity is won it means that revenue for that opportunity will be made, and no revenue if it is lost. So for an executive to make good strategic decisions in an organization, the executive’s facts cannot be based on uncertain in-formation. Therefore the opportunities of interest are those that are won or lost. In figure 3.1 we saw that contacts have attributes associated with them, oppor-tunities also have associated attributes. Some attributes of interest are how much the opportunity is worth, which sales person owns the opportunity, and which com-pany this opportunity concerns.
In an organization a sales person can have hundreds of opportunities associated with him or her. For an executive or sales manager to keep track and gather
infor-3. Introduction to Microsoft Dynamics CRM 15
mation about the organization and sales people is cumbersome and time consuming. If a manager wants to view how many won opportunities a sales person has, a query can be made through a tool in Dynamics CRM called Advanced Find. Or if the manger want to view how much those opportunities are worth in value, a new query has to be made. Or another example can be to view the win ratio of all opportunities in an organization.
Advanced Find is limited in the queries it can query to the underlying database. This is something the application in the project is trying to simplify by creating KPIs. But first it is necessary to understand the hierarchy of units in Dynamics CRM.
3.1.4
Security Roles and Business Units Hierarchy
Many businesses and companies consist of various units that have the task of main-taining a certain part of the business such as sales. Large companies can also have multiple units and sub-units within the same business area, they then usually follow a hierarchical structure. Similarly, the staff usually follow a hierarchical structure with various roles like executives, managers and sales people that have different privileges in the organization.
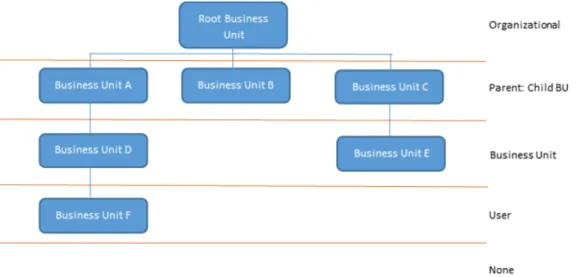
Microsoft has taken this hierarchical organizational structure into account when developing Dynamics CRM. An organization in Dynamics CRM also consists of units called Business Units. A business Unit can have a parent business unit or be a parent business unit to other business units. The first unit or top unit created for an organization is assigned to the root business unit in Dynamics CRM [14]. Similarly, users also follow a somewhat hierarchical structure with different roles and with privileges to access information in the organization. These roles are called security roles in Dynamics CRM. The security role for a user determines what en-tities the user can view and what actions on these enen-tities the user can perform. Organizational structure and security roles are illustrated in figure 3.2 as a five-level scale. And a short description for the different roles in table 3.2.
A top-executive might have organizational privileges to access all records in the organization. And a manager might have Business Unit privileges to access the records belonging to the business unit and the sales people in that business unit. Sales people usually have user privileges allowing them only to access their own records.
These roles are important when the user uses the client to connect to their Dynamics CRM instance. Depending on the privileges the user has, he or she will only get access to the corresponding information.
3. Introduction to Microsoft Dynamics CRM 16
Table 3.2: Privileges for the different roles
Organizational Privileges on all records in the organization regardless of who owns them.
Parent: Child Business Unit Privileges on all records that are owned by their own units and units that branches from their unit.
Business Unit Privileges on all records that are owned by their own unit.
User Privileges on records owned by the user.
17
4.
PROBLEM FORMULATION AND
SOLUTION
4.1
Problem Statement
In the previous chapter we saw that an organization in Dynamics CRM follows a hierarchical structure, where users are assigned different security roles in the or-ganization. We also saw some of the problems executives faced when retrieving information in Dynamics CRM. Often this information corresponds to the organi-zation’s KPIs.
The problem the application developed in this project is trying to solve, can be stated as follows:
Depending on a user’s role, may that be an executive, manager or sales person, the user should be able to view the KPIs that the organization uses as metrics to define its performance, based on the information the user has permission to access. Further, if a user has access to other business units, then the user should be able to drill-down to those business units and view their KPIs.
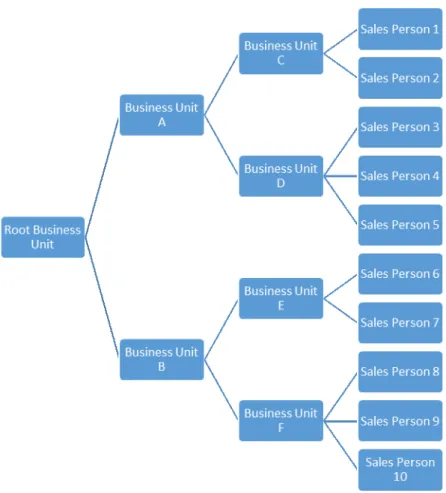
An example illustrates best what the statement implies. Figure 4.1 shows an imag-inary structure for an organization. This is a hierarchical structure starting with a root business unit branching all the way to sales people. In this hierarchical organi-zation there are seven business units and ten sales persons. In every business unit in this organization there should be a manager or executive. Depending on which business unit a manager is located in, that manger should be able to view the KPIs for all the business units and sales people branching from the manager’s business unit. For instance a manager in Business Unit A should be able to view KPIs for business units A, C, D and sales persons 1 to 5, because they all branch from unit A. In the same way a manager in the Root Business Unit can view KPIs for the whole organization, and a sales person can only view his or her KPIs. Depending on how these KPIs are represented a manager should be able to drill-down in the hierarchy to view KPIs further down in the organization.
4. Problem Formulation and solution 18
Figure 4.1: Shows a typical hierarchical structure of an organization.
4.2
KPIs Supported by The Application
Apprexo has significant experience on working with and customizing Dynamics CRM solutions. Based on the experience from many projects, and working closely with executives, they have seen an increasing demand for dashboards in organizations, and what type of KPIs they use as metrics for their organization. This, together with the previous discussion on opportunities, the conclusion is that the following two KPIs should be supported on the client to begin with, shown in table 4.1.
Table 4.1: Key performance indicators supported by the application. What is the win ratio of total opportunities in value?
What is the win ratio of total opportunities in quantity?
Translating these KPIs to modeling functions, we get the following equations:
W inRatiovalue = P W onOpportunitiesvalue P W onOpportunitiesvalue+ P LostOpportunitiesvalue (4.1)
4. Problem Formulation and solution 19
W inRatioquantity =
P
W onOpportunitiesquantity
P
W onOpportunitiesquantity+PLostOpportunitiesquantity
(4.2)
To calculate the win ratios we need to know the summation of both won oppor-tunities and lost opporoppor-tunities. Won and lost opporoppor-tunities in value and quantity can also by itself be used as KPIs. To get some insight to what these KPIs bring to the organization a three dimensional graph is plotted in figure 4.2. Since both equations are the same, but measure different units. They can be viewed within the same graph.
Figure 4.2: The figure for the win ratio in quantity and value are identical, since the equations are the same, the difference is what they measure. Looking at the figure with respect to value, one must assume that the Won- and Lost-axis are won and lost opportunities in thousands of Swedish kronor. In the same way from a quantity perspective the axes corresponds to the number of won and lost opportunities for a user.
Looking at the graph from a values perspective we see that if a sales person has
4. Problem Formulation and solution 20
result is that the win ratio in value becomes high. For instance if the value of won opportunities is 60000 Swedish kronor and lost opportunities is 20000 Swedish kro-nor, the result will be a KPI value of 0.75 from equation 4.1, that is 75%. By just looking at this value we cannot determine how many of these opportunities were won or lost. A sales person might have lost nine out of ten opportunities and still get a high win ratio in value, if that one won opportunity resulted in a very high value compared to the other nine. So a sales person could misleadingly appear to be good in sales if the manager relied solely on this KPI. But in combination with win ratio in quantity this effect can be detected and in that particular case the win ratio in quantity would be 0.1, that is 10%. The best results are when both KPIs in value and quantity are high. Which means that a sales person is winning many opportunities and at a high revenue.
The idea is that an executive or manager should be able to view the KPI values starting from a high level like the root business unit in figure 4.1, and then drill-down to view the KPI values for the business units. And if the KPI values are not satisfactory, the manager can continue to drill-down further in the organization to find the underlying cause. The cause could, for instance, be that a specific sales per-son is not successful in selling, and bringing the figures down. With this information the manager can take action and make changes.
4.2.1
Steps to Solve The Problem Statement
There are many steps that need to be solved to enable the functionality described in the previous section. Fortunately as a developer many of these are already handled by the Dynamics CRM server. For instance as a developer we do not have to worry about controlling what information a user should be allowed to view or retrieve. This already done by Dynamics CRM security role model. Dynamics CRM only return data based on your privileges. The steps we need to solve are:
1. Create the hierarchical structure of the user’s organization independent of how many business units or sales people there are in the organization, as long as there is a connection between units and sales people, like in figure 4.1. The connection part is also taken care of by Dynamics CRM which requires that a user belongs to a business unit and business units to have a parent business unit, unless that unit is not the root business unit.
2. Calculate the KPI values for all the business units and sales people in the hierarchy. Business units do not have any opportunities assign to them, so their KPI values must be calculated based on the opportunities in the branching sales people.
4. Problem Formulation and solution 21
3. Allow a user to navigate and drill-down through the hierarchy in an easy way.
4.3
Solution
4.3.1
Implementing Organizational Hierarchy
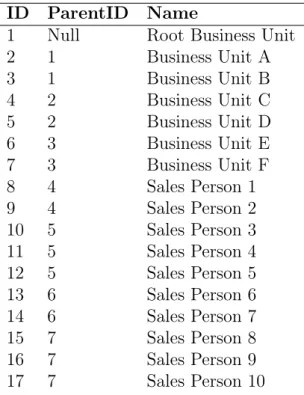
To create a hierarchical structure of an organization there must be a relationship between the nodes in that organization. In our case the nodes consist of business units and users (sales people, managers and executives). In Dynamics CRM there is such a relationship based on IDs. Every entity in Dynamics CRM has a unique ID assigned to it called GUID (Globally Unique Identifier). Entities can have many properties or attributes associated with it, where the GUID is one of these properties, another one is name. Most entities have more than one GUID, the user entity has a GUID for the business unit it belongs to, and a business unit have a GUID for the parent business unit it belongs to. A listing of the relationship for the business units and users in figure 4.1 is shown in table 4.2. 1
Table 4.2: Connection relationship based on IDs for the hierarchy in figure 4.1
ID ParentID Name
1 Null Root Business Unit 2 1 Business Unit A 3 1 Business Unit B 4 2 Business Unit C 5 2 Business Unit D 6 3 Business Unit E 7 3 Business Unit F 8 4 Sales Person 1 9 4 Sales Person 2 10 5 Sales Person 3 11 5 Sales Person 4 12 5 Sales Person 5 13 6 Sales Person 6 14 6 Sales Person 7 15 7 Sales Person 8 16 7 Sales Person 9 17 7 Sales Person 10
From the list we see that the Root Business Unit has the ParentID set to null since it does not have any parent, and business units A and B have ParentID set to 1 which is the Root Business Unit and so on. This way we see how the units and users are linked together. To create this flat list, we simply request all the business unit
1GUIDs have been converted to ordinary integers for illustration purpose since a GUID is a 32
4. Problem Formulation and solution 22
and all the users in the organization from Dynamics CRM, and compare their IDs and ParentIDs. Thereafter we use a data structure that is called atree in computer science to create the hierarchy structure [15].
The notion of a tree is an abstract data type that simulates a hierarchical tree structure, with a root value and sub-trees of children, represented as a set of linked nodes, as shown in figure 4.1. This data structure is called a non-binary tree, since a node in the tree can have more than two branching nodes.
There are many solutions to this problem, the one used in the project enables us to construct the structure in figure 4.1 from a flat list like the one table 4.1 [16]. Simply described, what the solution does is find the record that has a null value, and sets that to the root, and then uses the ID of that record which in our case is the Root Business Unit to find the business units that have the root unit as parent, and so on for every record in the list until the hierarchy is constructed. With this structure we can find the different units and users in an easy way. Every node in this structure which is a business unit or user, will have the following parameters.
• Children • Ancestors • Descendants • Siblings • Root • Parent • Level
Which are very useful when we want to view KPIs in a level, and show the next level based on a selection from a previous level.
4.3.2
Implementing KPI Support
Second step was to calculate the KPI values for all the nodes (business units and sales people) in the organization. This is also done using GUIDs from the entities involved. The KPIs we are interested in for the prototype all use opportunities, specifically won and lost opportunities. All opportunities have a property called state code, this state code is a key value pair. Shown in table 4.3
4. Problem Formulation and solution 23
Table 4.3: State code for opportunities Open 0
Won 1 Lost 2
To retrieve all the opportunities that are either won or lost, we simply request all opportunities with state code 1 or 2. Every opportunity has a GUID associated with it, and a GUID associated with the user who owns the opportunity. So by comparing all the users GUID with all the opportunities owner GUID (for those opportunities that have the state code set to 1 or 2), we see which opportunities belong to each user. Then by using equations (4.1) and (4.2) we get the KPI values for the users in value and quantity. The same approach cannot be used to get the KPI values for business units, because there is no easy way associate an opportunity with a business unit. For instance the Root Business Unit in figure 4.1 does not have any users or opportunities.
This is solved using another approach. Using the organizational hierarchical tree structure, we can navigate from every node, since every node has properties like children, siblings and descendants etcetera. Looking at figure 4.1 we see that all sales people are leaf nodes and do not have any children. And we have already computed the KPI values for these nodes. So by traversing the whole tree hierarchy and first checking if a node is a business unit and if that is the case, we simply take all the descendants for that node that are of type sales person and use equations (4.1) and (4.2) for all of their opportunities and assign the resulting value to the business unit’s KPI value.
4.3.3
Implementing Drill-Down Capabilities
At this stage every node in the hierarchy has a set of KPI values. To allow users to drill-down in the hierarchy like step 3 suggests is done by connecting graphical user interface elements to actions that call the node properties. This is described further in the mobile client section.
4.4
Application Architecture
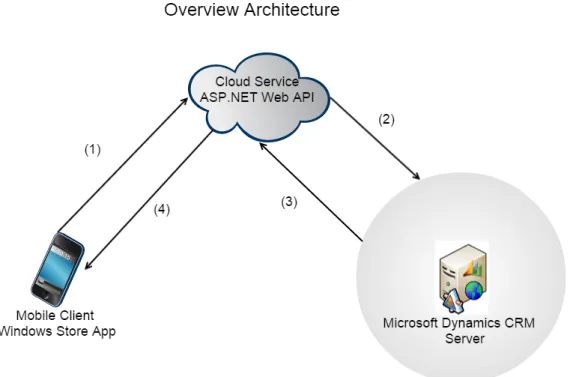
The application consists of three components, where each component corresponds to a component in a DSS. The user interface component is developed as a Windows Store App for mobile clients, the modeling component is a cloud service developed as a web application, and the data component is a Dynamics CRM server. An overview of the architecture is shown in figure 4.3. In the figure we also see the
4. Problem Formulation and solution 24
communication steps in the application. (1. The user starts by providing user credentials that are sent to the cloud service, (2. the cloud service processes and forwards the credentials to the Dynamics CRM server. (3. From an URI in the credentials the cloud service requests information from the Dynamics CRM server. (4. The information is modeled in the cloud service before it is sent back to the client for display. The rest of the thesis describes each component in the application more thoroughly.
25
5.
MOBILE CLIENT
5.1
Market Survey
Like many other vendors, Microsoft has two markets for apps called Windows Store and Windows Phone Store. Where the first is for apps that target tablets and laptops, and the second for apps targeting phones. In 2013, Microsoft had 1.7% of the market for smart phones [17]. That is a fairly small share of the market and since our application is aimed at executives this market becomes even smaller. However on the desktop computer market Microsoft has 87.1% of the market share [18]. Out of these 10.7% have the operating systems Windows 8 / 8.1 which is the operating system our client application runs on. On the tablet side that figure is 2.1% of the market share [19]. In preparing for the mobile client the choice was made, therefore, that the application should only focus on the Windows Store since there is a larger audience that can be reached.
5.2
Platform and Tools
5.2.1
Programming Languages
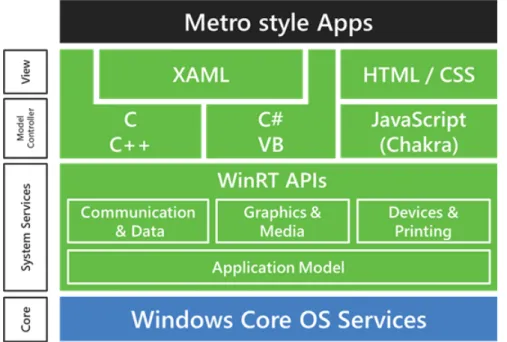
It is possible to develop applications targeting devices from Microsoft in several ways, and the techniques used are often interrelated [20]. At the beginning of the project web technologies like HTML, CSS and JavaScript were chosen to write the client application. These are old technologies when it comes to developing for the web, but relatively new for writing native applications for Microsoft devices. The reason Microsoft offers a selection of technologies is so they can reach a broader audience of developers, and let developers develop with the technologies they are most familiar with, instead of learning new ones. In the first weeks of the project it was not certain that a cloud service was needed, instead the first approach was to connect to the Dynamics CRM server directly from the client. It turned out that this was not possible with JavaScript, because there were no libraries from Microsoft to support it. For this reason, these languages were excluded and instead XAML and C# were chosen for further development. Figure 5.1 shows the Windows Store application platform. The operating system on tablets is Windows Runtime, abbreviated WinRT. Windows Runtime can be seen as a subset of Windows 8.1
5. Mobile Client 26
(the operating system running on laptops). To enable a connection from an app to a Dynamics CRM server one must use a SDK (Software Development Kit) called Dynamics CRM SDK in the app. Some of the libraries in the SDK are not sup-ported by WinRT. Therefore a cloud service was needed. The decision was made to develop a cloud service and continue other aspects of development in C# and XAML.
Figure 5.1: Overview of the platform and tools for developing applications for Win-dows Store.
XAML (Extensible Application Markup Language) is a general-purpose declarative programming language that is suitable to construct and initialize objects [21]. The language is based on XML (Extensible Markup Language), but with additional rules on how elements and their attributes are mapped to objects and their properties as well as the properties values. XAML has the same function that HTML and CSS have, that is, to account for the structure and presentation of the application. C# is an object-oriented programming language developed by Microsoft as part of the .NET platform, in this project C# is used to write the logic of the client application and the cloud service web application, and XAML is used to write the graphical user interface on the client.
5.2.2
Integrated Development Environment (IDE)
When developing for the Microsoft technology stack, the natural IDE to use is Mi-crosoft’s own IDE called Visual Studio. Visual studio is one of the most sophisticated IDE on the market today. It is used to develop computer programs for Windows,
5. Mobile Client 27
web sites, web applications and web services. Visual Studio includes a code editor supporting intelligent type sensing as well as code refactoring. Other very useful built-in tools include a designer for building graphical user interfaces. Visual Stu-dio also supports many different programming languages [22]. All development was done using Visual Studio.
5.3
Software Patterns
When developing applications for the Windows Store that are made to last and to meet changes one has to take advantage of a range of software patterns. Software patterns are design guidance to commonly occurring problems within a given con-text. In this section a description of some of these software patterns are presented. And a framework from Microsoft that implements some of these patterns. These patterns are used in the client application and some are also utilized in the cloud service.
5.3.1
Model-View-ViewModel (MVVM)
By default when developing on a Windows Store project every page in the project comes with two files, a UI file where XAML elements can be dragged and dropped using the Visual Studio designer, or programmed directly in the editor using XAML syntax, and a code-behind file written in C# that can be used for all kind of oper-ations, like creating user interface elements dynamically, controlling elements logic and responding to UI actions. Further logic for handling page life-cycle management and data retrieval can also be put in the code-behind file.
Developing in this way the code quickly becomes unmanageable, unmaintainable and cluttered, since UI logic is mixed with presentation logic and business logic in the code-behind. Changes in one place on the code results in changes in many other places. Therefore it is important to use some technique that separates these concerns.
The MVVM pattern is a software development pattern used on the client appli-cation, that separates these concerns. MVVM cleanly separates the UI from the presentation logic and business logic in the application. This makes the applica-tion easier to evolve, maintain and test [23]. Figure 5.2 shows an illustraapplica-tion of the MVVM pattern. From the figure we see that MVVM encapsulates the code into three different parts called View, ViewModel and Model. The View encapsulates the UI and UI logic, the ViewModel encapsulates the presentation logic and manages state, and the Model encapsulates the application’s business logic and data model. This way the code behind files gets minimal responsibility and only manages UI
5. Mobile Client 28
Figure 5.2: The different parts of MVVM pattern.
logic if that is necessary. The communication between the different parts in the MVVM pattern can be done in several ways. The most important one that plays a major role in the MVVM pattern is called data binding. As described earlier C# is an object-oriented language and different things in the application are represented as objects with properties and methods. As an example student grades can be represented as an object, with properties like name of the student and an array property containing the grades. Data binding is a mechanism that allows you to bind the attributes of an UI element to a property of an object. So if we had an UI element called Column-Chart that creates a column-chart with an attribute called columns. We could bind the grades array to the columns attribute, and their values would be shown as columns in the column-chart. The strength in data-binding is that changes on properties that are bound to attributes are immediately reflected on attributes, and changes on attributes are immediately reflected on properties. In the grades example, if a student’s grades should change, those changes would immediately be shown on the column-chart. If the user change any grades from the screen, those changes would update the object’s properties.
5.3.2
Repository Pattern
In many applications the logic to access data from a data source like a database is placed in the model. But the same problems as in the previous section can occur through doing this. In addition it can also result in duplication of code, errors, and more difficult to unit test the application’s components. What we want is to separate the logic that is used to query the web application and store the data, from the logic that maps it to the entity model. This is accomplished by centralizing a caching strategy for the data source. Because in our application there will be many parts that will want to access data from the data source, and we do not want each part to implement their own access code, instead this should be centrally managed. Retrieving logic is placed in a new abstraction level called a repository [24], which can be seen in figure 5.3. The repository mediates between the data source layer and the business logic layer in the application. The web service proxy queries the
5. Mobile Client 29
cloud service for the data, maps the data from the data source to a business entity, and propagates changes in the business entity to the data source. In our client application the cloud service is the service that is exposing data to the client. The repository centralizes the access logic for the cloud service in the web service proxy. Web service calls are expensive, to minimize these calls we use a caching strategy that is implemented within the repository.
Figure 5.3: Repository pattern.
The business logic first checks to see whether the queried items are in the cache. If they are not, the repository accesses the web service to retrieve the information.
5.3.3
Loose Coupling
A Windows Store App will consist of many components. These components will in turn consist of classes that manage various tasks, like retrieving data from services or representing different objects in the data model. Many of these classes will have dependencies on other classes, and making changes to one class will lead to having to make changes in all other classes that depend on the changed class. To avoid this we introduce a design pattern called loose coupling. The concept of loose coupling is to avoid the dependencies between different components [25]. If there are no strong dependencies between components, it will be easier and safer to make changes to one component without affecting other components.
Here is an example of a piece of code that shows a tight coupling between two classes, a vehicle class and an engine class:
public class Engine {
public void Accelerate() { // ...} public int GetRevolutions() {
int currentRPM = 0; // ...
return currentRPM; }
5. Mobile Client 30
public class Vehicle { private Engine m; public Vehicle(){
m = new Engine(); }
public int GetRevolutionsEngine() { return m.GetRevolutions(); }
}
The Vehicle class is dependent on the Engine class. From the example, one must instantiate the class Vehicle’s engine class or reference another engine object before it can call the Vehicle’s GetRevolutions method. In this example there is only one dependency, but the case could be that we had several classes such as Motorcycle, Boat and Car that also implements the class Engine. All these classes would have to be changed if there were any changes in the Engine class. This makes it harder to maintain the Engine class. By just making a few small changes to the code snippet it can be turned into a loosely coupled design as shown here:
public interface IEngine { void Accelerate(); int GetRevolutions(); }
public class Engine:IEngine {
public void Accelerate() { // ... } public int GetRevolutions() {
int currentRPM = 0; // ...
return currentRPM; }
}
public class Vehicle { private IEngine m;
public Vehicle(IEngine engine){ m = engine;
}
public int GetRevolutionsEngine() { return m.GetRevolutions(); }
5. Mobile Client 31
After minor changes to the Vehicle class constructor and introducing an IEngine interface we get a loose coupled solution. Now the Engine class implements the IEngine interface and the IEngine interface is injected in the Vehicle constructor instead of the Engine class. This removes the responsibility from the Vehicle class to instantiate the Engine object. And the IEngine interface can point to any class that implements the IEngine interface. This is known as dependency injection and leads to a more maintainable, testable and extensible solution. A more powerful way of doing dependency injection that automates the construction of objects is by introducing a dependency injection container.
5.3.4
Dependency Injection with Unity
The previous section showed the benefits with dependency injection, by using a push model, where some other class or component is responsible for instantiating the dependencies and injecting them into object constructors. This other class or component becomes responsible for composing the application by building the com-plete object graph, and in some cases it will also be responsible for managing the lifetime of the objects that it creates. To automate this process in the project we will use theUnityframework [26]. Which is a dependency injection framework from Microsoft. In the loose coupling section the Vehicle class had a constructor that ex-pected to be injected with an object of type IEngine. The application must know at run time which implementation of the IEngine interface it should instantiate before it can go ahead and instantiate a Vehicle object. Two tasks must be handled here, something in the application must make a decision on how to instantiate an object that implements the IEngine interface, and something in the application must in-stantiate both that object and the Vehicle object. The first task is calledregistration
and the secondresolution. When an object is no longer used it will become available for garbage collection. This is also done to the dependencies if they not shared with other classes, and it is calleddisposing. The Unity container manages all this three tasks: registering, resolving and disposing which makes it easy to use dependency injection.
Register
With the Unity container, one can register a set of mappings that determine what type is required when a constructor identifies the type to be injected based on the interface. From the Vehicle and Engine example a container and registering would look as follows:
Var c o n t a i n e r = new U n i t y C o n t a i n e r ( ) ;
5. Mobile Client 32
The RegisterType method tells the container to instantiate an Engine object when it instantiates an object that requires an injection of an IEngine instance through a constructor.
Resolve
The usage of the RegisterType method defines the mapping between the interface type used in the client class and the concrete type one want to use in the applica-tion. To instantiate the Vehicle and Engine objects, one has to invoke the Resolve method.
Var v e h i c l e = c o n t a i n e r . R e s o l v e <V e h i c l e > ( ) ;
As seen in the code one does not instantiate the Vehicle object directly, instead this is done by the Unity container and the container also resolves any dependencies. In this simple example, the dependency to resolve is for an IEngine object. Behind the scenes, the Unity container first constructs an Engine object and then passes it to the constructor of the Vehicle class.
Dispose
In the registering and resolving of types, the application stores a reference to the Vehicle object in the vehicle variable and the Unity container creates a new Engine instance to inject whenever one call the Resolve method. When the vehicle variable goes out of scope and becomes eligible for garbage collection, the Engine object will also be eligible for garbage collection.
5.3.5
Prism Framework
Prism Framework is a development framework from a Microsoft team called Pattern & Practices [27]. Their goal is to enhance developers work through guiding them on how to design and implement software solutions. They usually provide content like reference implementations, samples and frameworks that explain how to build scalable, secure, robust and maintainable software. Prism Framework is one of these frameworks intended to be used when developing Windows Store business apps using C#, XAML and a development pattern such as Model-View-ViewModel.
The Prism framework consists of two libraries called:
• Microsoft.Practices.Prism.StoreApps
• Microsoft.Practises.Prism.PubSubEvents
The StoreApps project contains classes and interfaces that provide MVVM support with life-cycle management, and other core services that apps need. The
Pub-5. Mobile Client 33
SubEvents project contains classes that implement something called an eventaggre-gator.
The logical architecture of a typical Windows Store app that uses Prism is shown in figure 5.4.
In the figure the blue boxes show the infrastructure that is provided by Prism, and the gray boxes the parts to be implemented by the developer. Building an application without using Prism these blue infrastructure parts must also be handled by the developer.
5.4
Design
The driving force for the design and user experience of the application is done by following a "great at statement" for the application, similar to the problem state-ment. A "great at statement" is a statement that describes the application and the main experience it brings to its users. The following, great at statement, is used for the Apprexo dashboard application:
The Apprexo dashboard application is great at letting executives and managers view and drill-down through their organization’s data stored in Dynamics CRM as defined by specific KPIs.
5.4.1
Pages in client application
From the software patterns section we saw that one of the patterns used on the client is the MVVM pattern. There we learned that the View was the graphical user in-terface containing visual XAML elements. These elements attributes could through data binding be connected to properties of objects in the ViewModel. When using MVVM the most common relationship between a View page and a ViewModel page is one-to-one, that is every View has a corresponding ViewModel. This is also how it is done in our client application. Although there are cases when one can use a n-to-n relationship.
The Apprexo dashboard application consists of four different pages:
• Login page, where users provide credentials for username, password and
or-ganization URL to connect to Dynamics CRM and retrieve information.
• Dashboard page, where users can view their dashboard with customized
5. Mobile Client 34
5. Mobile Client 35
• Customize page, where users can customize a KPI by specifying category,
KPI and chart type. And add the KPI to the dashboard.
• Detail page, where users can view more detailed information about a specific KPI.
All the information in the prototype is displayed using charts. To create the charts on the client application an open-source library called WinRT XAML Toolkit [28] has been used. This library provides XAML elements to create charts. These charts are then bound to the data model. Example of charts provided by the toolkit are column-chart, bar-chart, bubble-chart, line-chart and pie-chart.
5.4.2
Login Page
Besides the visual View pages and their logical ViewModel pages that are app specific, every app-project for Windows Store Apps has a file namedapp.xamland its code-behind file named app.xaml.cs. When a user starts an app the first thing that is shown on the screen is a splash-screen, the splash-screen is simply an image shown so that the operating system can load the app’s files and resources to the device’s cache memory during the time the image is shown. After the resources are loaded the starting point for the app is the app.xaml.cs page. In the app.xaml.cs page app specific resources and app life-cycle management processes are declared. In the client dashboard application two additional things are done in the app.xaml.cs page. First the Unity container is initiated and all related classes and interfaces are registered so the Unity container knows which classes needs to be injected during construction of dependent classes. Second we check here to see which page the user should be directed to. If it is the first time the app is used or the user is logged out, the app navigates to the Login page, if on the other hand the user is logged in the app navigates to the Dashboard page.
To understand the login process we assume it is the first time the user uses the app and arrives to the Login page. The login page is a simple form with three input fields for user’s username, password and organization URL. An image of the login page when wrong credentials are provided is shown in figure 5.5. If any of the credentials are wrong an error display message is returned in red. With the organization URL the application’s cloud service can locate the user’s organization server and try to authenticate the user using a username and password with an authentication process called claims-based authentication. This process is described in chapter 6. If the authentication succeeds those credentials are saved securely in the app and associated with the user. If the user has logged out, the next login can
5. Mobile Client 36
be checked in the client instead of authenticating against the server. The sequence diagram in figure 5.6 shows the classes involved in the login process.
Figure 5.5: Login page when invalid credentials are used.
Figure 5.6: Sequence diagram for login process.
LoginPageViewModelhas a dependency on theAccountServiceclass and
Iden-tityServiceProxyclass which are resolved by the Unity container when the
Login-PageViewModel object is constructed. The AccountService class handles user spe-cific tasks and the IdentityServiceProxy is a proxy class that handles service calls
5. Mobile Client 37
related to user account. All in alignment with the repository pattern described in the repository pattern section. The HttpClient class is a platform specific class that sends HTTP requests and receives HTTP responses from a resource identi-fied by a URI. When the user submits the form the LoginPageViewModel calls an asynchronous method named SignInUserAsync, SignInUserAsync checks if the user’s credentials are already saved. If that’s not the case the AccountService calls another asynchronous method from the IdentityServiceProxy class called
LogO-nAsync. In the LogOnAsync method the credentials are concatenated to a colon
separated string. This string is then encoded to a base-64 string. The encoded string is then sent in the header of an HTTPS request to the service component’s
IdentityController. The IdentityController is only called when the app is used for the first time, so it knows what actions it should respond to, when called upon. The IdentityController decodes the header to extract the credentials and simply forwards the credentials to an authentication proxy class that queries the organization in the URI using claims-based authentication for default data. The default data is modeled to KPI information and returned to the client application. The client application navigates from the login page to the dashboard page and displays the KPIs on charts. If on the other hand the credentials are wrong the error message is displayed in-forming the user that the credentials provided are invalid. Dynamics CRM do not enable any login process, it only responds to queries. That is why a query is used to authenticate the user. If the query succeeds, the user is valid and data is returned otherwise the user is invalid, and no data is returned.
5.4.3
Dashboard Page
The dashboard page is the main page on the client application. If the user has logged in successfully once, the user will immediately be presented with the dashboard page. On the dashboard the KPIs are categorized using a label for the category name, that is KPIs related to the category is grouped by a category name. KPIs can be added and removed from a category. Each KPI on the dashboard is displayed within a chart that is framed by a rectangle.
Navigation
Microsoft has a set of user experience guidelines that developers need follow when developing apps for the Windows Store [29]. These guidelines place considerable emphasis on that pages should focus on content before chrome. Wha