University
of
Cape
Town
The Impact of Project Flexibility on Project Choice and
Capital Structure
A Thesis presented to
The Graduate School of Business University of Cape Town
In partial fulfilment of the requirements for the
Masters of Development Finance Degree by
Shaun Forbes
December 2012University
of
Cape
Town
The copyright of this thesis vests in the author. No
quotation from it or information derived from it is to be
published without full acknowledgement of the source.
The thesis is to be used for private study or
non-commercial research purposes only.
Published by the University of Cape Town (UCT) in terms
of the non-exclusive license granted to UCT by the author.
i
PLAGIARISM DECLARATION
I know that plagiarism is wrong. Plagiarism is to use another’s work and pretend that it is one’s own.
I have used a recognised convention for citation and referencing. Each significant contribution and quotation from the works of other people has been attributed, cited and referenced.
I certify that this submission is my own work.
I have not allowed and will not allow anyone to copy this essay with the intention of passing it off as his or her own work
ii
ABSTRACT
This research highlights the value of Real Options Analysis (ROA) as a process in the evaluation of an oil extraction project in Sub-Saharan Africa. It shows the benefits it can bring to not only the final project evaluation but also to the project design selection process. The research then extends the application of ROA by developing and applying a framework which incorporates the fact that project flexibility has a positive impact on the projects value in the face of downside risk. ROA, by virtue of its explicit cash flow volatility modelling provides a framework for a consideration of the optimal level of project debt. In this case it suggests that the project can carry more debt than would have been acceptable if the more traditional NPV method was used in its evaluation.
iii
TABLE OF CONTENTS
PLAGIARISM DECLARATION ... i
ABSTRACT ... ii
TABLE OF CONTENTS ... iii
LIST OF FIGURES ... v
LIST OF TABLES ... v
LIST OF EQUATIONS ... vi
GLOSSARY OF TERMS ... vii
ACKNOWLEDGEMENT ... viii
1 INTRODUCTION ... 1
1.1 Research Area... 3
1.1.1 Project Description ... 3
1.2 Research Questions and Scope ... 7
2 LITERATURE REVIEW ... 10
2.1 Short Comings of Traditional Valuation Techniques ... 10
2.2 Real Options ... 11
2.3 Real Options in Oil Field Exploration and Development ... 12
2.4 Real Option Valuation Methods ... 14
2.5 Limitations of Real Options ... 16
2.6 Linking the benefits of Real Options Analysis to the Corporate Balance Sheet ... 18
3 RESEARCH METHODOLOGY ... 20
3.1 Research Approach and Strategy ... 20
3.2 Data Collection ... 21
3.3 Data Analysis Methods ... 21
3.3.1 The Four Step Process ... 21
3.3.2 Binomial Lattice ... 22
3.3.3 The Replicating Portfolio Approach ... 23
3.3.4 Value at Risk ... 24
3.4 Limitations ... 24
iv
4.1 Base Case NPV Analysis ... 26
4.1.1 Assumptions ... 26
4.1.2 Reserves ... 27
4.1.3 Oil Price... 27
4.1.4 Capital Investment Costs ... 28
4.1.5 Operating Costs ... 29
4.1.6 Abandonment Costs ... 29
4.1.7 Summary of Production Sharing Contract Terms ... 29
4.1.8 Discount Rate ... 31
4.1.9 Results & Sensitivity Analysis ... 31
4.2 Modelling the Uncertainty ... 33
4.2.1 Oil Price Uncertainty... 33
4.2.2 Uncertainty in Reserve Volumes ... 38
4.3 Additional Benefits from Modelling the Uncertainty ... 41
4.4 Identification and Incorporation of Flexibility ... 42
4.4.1 Flexibility to Expand ... 42
4.4.2 Flexibility to Abandon ... 43
4.5 Real Options Analysis ... 44
4.5.1 Input Variables ... 44
4.5.2 Expansion Option ... 44
4.5.3 Abandonment Option ... 45
4.5.4 Summary of the Results ... 47
4.5.5 Current Status of the Project ... 48
4.6 Value at Risk ... 52
5 RESEARCH CONCLUSIONS ... 56
6 RECOMMENDATIONS FOR FUTURE RESEARCH ... 60
REFERENCES ... 61
v
LIST OF FIGURES
Figure 3.1: Four Step Process (Copeland and Antikarov, 2003) ... 22
Figure 4.1: Base Case Production Profile ... 27
Figure 4.2: Project Cash Flow ... 31
Figure 4.3: Sensitivity Analysis Tornado Diagram ... 33
Figure 4.4 Effective Oil Price in 2026 with filters applied ... 37
Figure 4.5 Effective Oil Price in 2026 without Filters ... 37
Figure 4.6: Production Profiles P10/P50/P90 ... 38
Figure 4.7 Fit Comparison for Reserve Production Profile Variability ... 39
Figure 4.8: Total Annual Production Distribution ... 40
Figure 4.9 Distribution of Total Project Cash Flow ($000’s) ... 41
Figure 4.10 Distribution of the 10% NPV ($000’s) ... 42
Figure 4.11: Production Profile Showing Expansion Option ... 43
Figure 4.12 Expansion Option Binomial Tree ... 45
Figure 4.13 Abandonment Option Binomial tree ... 46
Figure 4.14: Production Profile Using Recorded Data ... 49
Figure 4.15: World Bank Oil Price Data ... 50
Figure 4.16 Project Cash Flow Comparison ... 51
Figure 4.17 Project Cash Flow distribution showing 95% confidence level ... 52
LIST OF TABLES Table 1.1: Field Summary by Reservoir ... 5
Table 1.2: Summary Platform Requirements ... 7
Table 4.1: Capital Costs – TLP Option ... 28
Table 4.2: Capital Costs – Subsea Option ... 28
Table 4.3: Royalty Rate ... 30
vi
Table 4.5: NPV Summary ... 32
Table 4.6: Summary of Expansion Value ... 47
Table 4.7 Summary of Abandonment Value ... 48
Table 4.8 Recorded Production Rates ... 48
Table 4.9: Oil Price Comparison ... 50
Table 4.10 Project Values with no flexibility in 2013 ... 54
Table 4.11 Project Values including expansion option in 2013 ... 54
Table 4.12 Project Values including abandonment option in 2013 ... 54
Table 4.13 Magnitude of Loss ... 55
LIST OF EQUATIONS Equation 2.1: Net Present Value ... 10
Equation 3.1: Volatility of Projects Rate of Return ... 23
Equation 3.2: Value of the project with flexibility ... 24
Equation 4.1: Ornstein Uhlenbeck Mean Reverting Process ... 34
Equation 4.2 Estimating the speed of Mean-reversion ... 35
Equation 4.3 Geometric Brownian Motion Process ... 36
Equation 4.4: Calculation of the up movement in a multiplicative tree ... 44
Equation 4.5: Calculation of the down movement in a multiplicative tree ... 44
Equation 4.6: Calculation of Expansion Option Present Value ... 45
Equation 4.7 Equation for calculating binomial probabilities ... 53
vii
GLOSSARY OF TERMS
BOPD Barrels of Oil per Day
MBOPD Thousand Barrels of Oil per Day
CPF Central Processing Facility
DCF Discounted Cash Flow
FPSO Floating Production Storage Off-take
GBM Geometric Brownian Motion
JV Joint Venture
MMBBL Million Barrels
NPV Net Present Value
POD Plan of Development
PSC Production Sharing Contract
PV Present Value
ROA Real Options Analysis
TLP Tension Leg Platform
VAR Value at Risk
viii
ACKNOWLEDGEMENT
I would like to offer my gratitude and appreciation to Prof Evan Gilbert for his support and guidance on the topic of Real Options.
Without the company, which will remain anonymous, that provided the project for analysis this research would not have been possible so sincere thanks also goes to them.
1
1
INTRODUCTION
The upstream petroleum industry and indeed many other sectors of the economy have always focused on improving asset selection and the investment decision-making process. There are a variety of tools that attempt to determine which decision in any commercial situation will maximise the value of the firm. An important part of many of these approaches is the discounted cash flow (DCF) and net present value (NPV) methods which, in short state that the value of any investment is the present value of its future cash flows.
Unfortunately these traditional approaches have some severe limitations. They can’t properly value investments whose cash flows are determined by future outcomes or on the development of more accurate and higher quality data through the life of the project and the ability of management to react to that data and make active decisions as the investment or project evolves. In addition, a single risk adjusted discount rate is often employed, typically the company’s weighted average cost of capital (WACC), and this overlooks changes in the projects risk profile over time (Triantis, 2003).
Investment decisions and more specifically infrastructure or development projects require large sums of capital which often have a high sunk cost component therefore it is vital that the right decision is made. However, if a company is too risk adverse then opportunities can be lost which impacts their competitiveness alternatively if a company takes on too much risk they can unnecessarily expose themselves by taking on bad projects. The balance of debt and equity used to fund these projects or investments is also important. Too much equity and the company will see diluted returns from a successful project; however if the company is servicing a large amount of debt and it experiences the downside of a project then they could suffer cash flow problems or worse, be at risk of defaulting which may put the entire company’s future at risk.
Maintaining these balances is key to success and this study will show how Real Options Analysis (ROA) can be used not only as a tool that adds value to the evaluation process but it can also provide a framework for determining the project’s capital structure.
2
ROA is a way of recognising the value of flexibility inherent in capital investment projects. All projects have flexibility; even the ability to shut it down is worth something in that further losses are avoided and there may even be a salvage value in the project. Simply defined, real options analysis is the application of financial options, decision sciences, corporate finance and statistics to evaluate the flexibility inherent in real or physical assets as opposed to financial assets (Mun, 2006).
The research will focus on a project in the upstream oil and gas industry within the sub-Saharan region and use the project economics already derived using traditional methods of evaluation as a base to develop a real options model in order to show the benefits of using ROA in the evaluation of large infrastructure or development projects.
The review of this project will show that ROA is a tool that should be incorporated in the decision making process from the very beginning and when used in the concept selection phase ROA provides the ability to quantify or value the flexibility and options present in each of the concepts that are on the table. This enables management to make informed decisions on which concepts provide the greater flexibility and if the cost of purchasing that flexibility is worth it.
The project selected for this research is an offshore project involving the drilling of 43 production and injection wells and the installation of two deepwater floating platforms and four fixed platforms in shallower water, three of which are unmanned satellite platforms and one a platform housing a central processing facility which then exports the product via subsea pipeline to a Floating Production Storage (FPSO) vessel in a nearby field.
During the initial evaluation the concept selection phase was narrowed down to two main design concepts. In terms of capital investment and NPV analysis there was little difference between the two concepts however one of the concepts provided a higher level of flexibility in that it allowed for the drilling of future wells at a significantly reduced expense should there be a requirement to expand the project and increase production at a later date. Unlike NPV, the ROA was able to value this flexibility and show how having the ability to take advantage of any potential upside can enhance the overall value of a project and that this enhanced project value should be incorporated into the decision making process.
3
Under Government regulation the project had to make allowance for abandonment at the end of the field’s economic life. This essentially means that wells are abandoned so that they are no longer a threat to the environment and all facilities and equipment are removed returning the seabed to its original state. Having the ability to abandon at any point in the projects life means the project is able to avoid further losses once the project becomes uneconomical due to the amount of reserves left in place, the price of oil or a combination of the two.
With the ability to mitigate against these downside losses the objective is be to then show how the ROA analysis can provide the basis for a framework to assess an optimised capital structure by using it to estimate the projects value at risk (VAR) and from that project a minimum level of equity that will be required to support the project.
1.1 Research Area
1.1.1 Project Description
Due to the commercially sensitive information provided in this report the project and company to which it belongs will remain anonymous. The company is a leading independent oil & gas, exploration and production group with a focus on four core regional areas, one of which is Africa. In this particular project the company is part of a group of companies or Joint Venture (JV) that own a license to a block offshore West Africa. The company is not a majority share holder and is also not the operator of the JV. The terms of the license are captured under a Production Sharing Contract (PSC) between the government and the JV. The project is an offshore oil field development. A field Plan of Development (POD) was submitted to the relevant government in June 2004. This document, along with extracts of the PSC, forms the basis for the economic evaluation.
The POD describes the following key aspects of the project:
The current understanding of the reservoirs within the field
The planned producing infrastructure
The schedule for implementation of the POD
The costs for the development of the field
4
The field came on-stream in 2007 with initial production exceeding all expectations. Production facilities that were designed to process 60 000 barrels of oil per day (bopd) had to be upgraded to accommodate up to 85 000 bopd. Oil prices have also increased significantly since the project was evaluated adding to the success of the project which has resulted in the JV executing plans to drill more wells in 2013 in order to exploit untapped reserves and maintain production levels as production begins to come off the plateau and slip down the production profile. This decision to expand is also based on production data that has increased the understanding of the reservoir as well as additional seismic data gathered during seismic acquisition campaigns executed after first oil. The JV is also able to take advantage of and an improvement in the technology of seismic data acquisition since 2004.
As shall be demonstrated the NPV and sensitivity analysis falls short at capturing the potential upside that was inherent in the project and is unable to adequately account for the ability to acquire new data and information over time which reduces the uncertainties and subsequently the risk profile of the project as it evolves. The ROA process provides an insight into the upside of a project without which managers may be led to under-invest in capital projects impacting on growth and shareholder value. The production data and oil price data from 2007 to date therefore provides an opportunity to take a retrospective look at this project and assess how a real options model could have identified and valued the flexibility that was inherent in this project.
Field Layout
The field is comprised of four main reservoirs each made up of numerous compartments, which for the purpose of this report shall simply be termed A, B, C & D. This section should be read in conjunction with the field layout diagrams presented in Appendix 5&6.
Reservoir A is located in the north-eastern part of the license block in 30-65m water depth. Reservoir B is located approximately 5km north-west of Reservoir A in water depths of 80-400m. Reservoir C is approximately 10km west, north-west of Reservoir A in water depths of 420-740m. Finally, Reservoir D is immediately adjacent to the north-east corner of Reservoir C.
The facilities currently in place today are in line with what was submitted with the POD. Centrally located, in the shallower waters of Reservoir A there is a Central Processing
5
Facility (CPF) with a bridged satellite (unmanned) platform There are also two additional satellite platforms to the to the North and South of the CPF. Reservoirs C and D were drilled from a tender assisted Tension Leg Platform (TLP) strategically located above Reservoir C. Likewise Reservoir B was also drilled from a tender assisted TLP. Both TLPs now act as production platforms.
Reservoir Summary
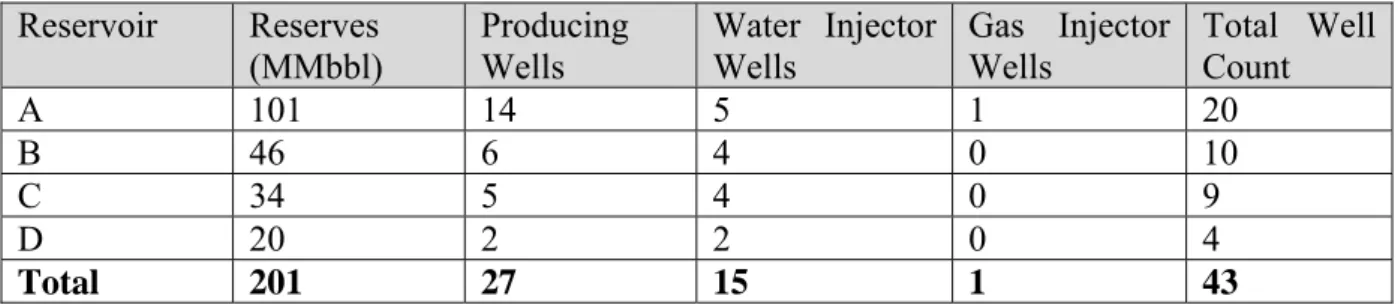
The four reservoirs were estimated to contain a total of 201 million barrels (MMbbl) of recoverable reserves. The development plan was expected to deliver a plateau of 60 000 bopd for approximately six years with a strategy that required 43 wells. Table 1.1 provides a summary of the reserves in place and number of wells required.
Table 1.1: Field Summary by Reservoir
Reservoir Reserves (MMbbl) Producing Wells Water Injector Wells Gas Injector Wells Total Well Count A 101 14 5 1 20 B 46 6 4 0 10 C 34 5 4 0 9 D 20 2 2 0 4 Total 201 27 15 1 43
Water and produced gas injection was designed to be implemented shortly after first oil to maintain operating pressures in all four reservoirs.
Drilling & Facilities Summary
Reservoir A was developed using a jack-up rig positioned over the platform structures. The three other reservoirs were developed using two TLPs in conjunction with tender-assisted platform drilling rigs.
Production facilities for the field consist of a CPF on a fixed platform at Reservoir A where fluid processing occurs. The three smaller satellite platforms support wells for both production and injection. The two TLPs support dry tree wells and limited process equipment. Access to wellbores through the use of dry production tress allow for lower cost Workover (well intervention) options compared to subsea trees and lead to reduced Workover expenses over the life of the field. Dry trees also allow for greater analysis of well performance leading to increased recovery and improved production rates.
6
It is beyond the scope of this report to discuss the sub-surface characteristics of the reservoirs which led to the strategy of location and number of producing and injector wells.
Concept Selection
The POD also makes reference to a concept development phase where a number of other design concepts were investigated. As work progressed through this phase and more information was gathered on the size of the reserves the focus was on two main options:
1. An all subsea development scheme with a Floating Production Storage Off-take Vessel
(FPSO) as the main processing and storage facility.
2. A subsea development scheme with a conventional jacket structure located in Reservoir A housing processing equipment with the product routed to an FPSO in a nearby field. The capital cost advantage made Option 2 the preferred alternative and the focus of further study work. Late in 2003 another variation of Option 2 was investigated which looked into the advantage to using dry tree units in Reservoirs B, C & D due to production experience gained in a nearby field. The initiative was primarily driven by:
Reducing drilling and completion costs
Improving flow assurance from the deepwater fields
Providing increased flexibility in production operations
Reducing well costs in the event that more were required to improve reservoir drainage The last bullet point is part of the focus of this study and is due to the fact that by making use of a tender assisted drilling rig, drilling through a TLP platform the costs are far lower than a semi-submersible rig that would otherwise be required to drill when using subsea trees in the water depths at Reservoirs B, C & D. Dry trees were also expected to have a reduced operating cost but all these benefits would be offset by the capital costs of the platforms to support the dry tree units.
In terms of aggregated development and operating costs there was ultimately little difference between the subsea development option and the TLP option with dry trees feeding back to a CPF in shallower water and the product routed to an FPSO in a nearby field. The TLP option was selected on the basis that it eliminated any concerns about flow assurance, improved ease of operation, gave greater flexibility in terms of the future drilling of additional wells and
7
permitted increased reservoir and production monitoring. Table 1.2 provides a summary of the basic functional requirements for each of the platforms and TLPs:
Table 1.2: Summary Platform Requirements
Reservoir Platform Drilling Method Number of
well slots
Approximate Water Depth
A CPF 0 60m
A Satellite 1 (North of Field) Jack-up 6 71m
A Satellite 2 (Bridged to CPF) Jack-up 12 62m
A Satellite 3 (South of Field) Jack-up 9 45m
B TLP Tender-assisted
Platform drilling rig 12 280m
C TLP Tender-assisted
Platform drilling rig 16 515m
The subsea option that was considered simply replaced the TLP platforms shown above with subsea equipment.
Although there was very little information available on the initial concept selection phase and in the end there was little difference in the costs of the final two concepts this is certainly an area where ROA can be a valuable evaluation tool. As it shall be presented in this report, ROA provides the ability to quantify or value the flexibility and options present in each of the concepts enabling management to make informed decisions on which concepts provide the greater flexibility and if the cost of purchasing that flexibility makes financial sense.
1.2 Research Questions and Scope
The objective of the research was to select a project that had been valued based on traditional DCF/NPV methods and then build a Real Options Model for the project highlighting the value and benefits that ROA can bring when valuing a project or investment decision that has a high likelihood of receiving new information and has room for management flexibility. The intention in this part of the study is to use a model that is simple, practical and easy for management to understand. The methodology described in Section 3 should enable the research results to be easily presentable to management in order for the benefits of ROA to be
8
identified with little difficulty. Therefore management should be more willing and able to comfortably adopt the ROA approach as a supplement to the traditional valuation techniques when it comes to capital budgeting decision making.
Africa is a very dynamic environment to work in where variables are constantly changing. Many projects may not see the execution phase because of this and as a result a critical objective of this research is to use a real life project with real world risks and uncertainties, not a simplified hypothetical one, to show that ROA is an approach that can effectively value projects and investment decisions in Africa and elsewhere.
The research will discuss how to increase flexibility in projects, especially in Africa and again show how this flexibility can be valued without using calculus and sophisticated models. The methodology will also identify when options (defer, expansion, abandon) should be optimally exercised.
Once the Real Options Analysis is complete the objective will be to then link the analysis and model output to the company balance sheet. A large inflexible project requires flexible financing (less debt more equity) therefore if flexibility is built in for managements response as the project evolves and that flexibility is valued then it should be possible to obtain less flexible financing (more debt less equity). Using ROA the study will show that it is possible to fund a project with less equity than perhaps would have been initially thought if NPV was the only method of evaluating the project.
Optionality is a natural hedge against the downside risk of a project because in the face of present uncertainty it offers the option to scale down the project or abandon the project, which holds value when compared to the NPV version of the project which assumes it will continue regardless.
As ROA is based on the volatility of the projects rate of return and not the distribution of its total value the research will use ROA to look at how the project cash flows can potentially impact the projects capital structure and in turn the company’s financial structure.
The real options process provides the ability to determine the project’s VAR and develop a framework which has the ability to show how the flexibility can limit the projects exposure to
9
downside risk and therefore demonstrate that the project can carry a higher amount of debt than originally anticipated.
Therefore the intended outcome of the research will be to show that optionality not only enhances the estimated value of the project but also offers increased financial risk management, which would feedback into the company financial structure.
10
2
LITERATURE REVIEW
2.1 Short Comings of Traditional Valuation Techniques
By revisiting the NPV formula and critiquing the way in which it is implemented we can quickly review the shortcomings:
1 Equation 2.1: Net Present Value
The discount rate (r) used in the above formula normally has two key roles:
Take the time value of money into account (the risk free rate)
Reflect associated risk of these cash flows (the risk premium)
Projects or investments with higher risk are allocated a higher risk premium. In the formula above this will reduce the NPV of the project, which goes against the notion of higher risk, equals higher reward.
The accuracy of the cash flows (and thus the valuation) relies on the ability of the analyst to predict the future value of key variables that will impact the project over time for example; exchange rates, inflation, selling prices, production volumes etc. this is clearly an impossible task. DCF thus implicitly assumes that all investment decisions are made now and cash flow streams are fixed for the future.
In essence the more traditional approaches of valuing an investment decision fail to account for flexibility and do not adequately deal with uncertainty. As a result the traditional tools for evaluating investment decisions are often questioned and criticised especially when it is felt the proposed investment or project should be executed for strategic reasons or because it offers the company flexibility or it may even form the stepping stone towards future growth opportunities.
A lot of the literature on ROA begins by delving into a critique on the traditional methods of evaluation. As this is well documented the literature review will not go any further into the shortcomings of DCF and NPV.
11
2.2 Real Options
The breakthrough in the valuation of financial options was made in the early 1970s by Fischer Black, and Myron Scholes (Black & Scholes, 1973) who won a Nobel Prize for their work. Since then hundreds of papers have followed on the topic.
Since the mid to late 1980s people began recognising the value in identifying options in investment decisions that involve real assets. (Brennan & Schwartz, 1985) were some of the early users of options pricing techniques for evaluating natural resource investments. They concluded that “In addition to providing a rich set of empirical research, this framework should be useful for the analysis of capital-budgeting decisions in a wide variety of situations in which the distribution of future cash flows is not given exogenously but must be determined by future management decisions.”
A real option is simply defined as the right, but not the obligation, to take an action (e.g. deferring, expanding, contracting or abandoning) within an investment project involving real assets, at a predetermined cost called the exercise price, for a predetermined period of time – the life of the option. (Copeland & Antikarov, 2003)
(Copeland & Antikarov, 2003) provide the learning practitioner of real options with a sound framework from which to understand the fundamental theory of ROA. The authors explain that like their financial cousins real options depend on five basic variables:
1. Value of the underlying risky asset – this is a project, investment or acquisition. One of the important differences between financial and real options is that the owner of a financial option cannot affect the value of the underlying. But, the management that operates a real asset can raise its value and thereby raise the value of all real options that depend on it.
2. The exercise price – this is the investment cost and depends on the option e.g. additional investment to expand.
3. The time to expiration of the option - a longer time frame allows more to be learnt about the uncertainty and therefore increases the value.
4. The standard deviation of the underlying risky asset. The probability of exceeding the exercise price increases with volatility about the present value and therefore the value of the option increases with the riskiness of the underlying.
12
5. Risk-free rate of interest over the life of the option. As the risk free rate goes up, the value of the option also increases.
There is also an important sixth variable which is the dividends that may be paid out by the underlying asset however the research in this report does not explore the impact of dividend payouts.
The flexibility value comes in the ability to respond to information that may be received in the future. The greater the likelihood that this information will elicit a managerial response and alter the course of the project the more valuable the option will be. Real options essentially capture the contingencies that management can build into a project or opportunity.
2.3 Real Options in Oil Field Exploration and Development
ROA is currently utilised in a number of industries and the oil industry can almost certainly be considered a leader in the development of the concept. Applications of real options in the oil industry soon followed the options frame work established in the 1980s. A paper by (Paddock, Siegel, & Smith, 1988) uses option valuation theory to develop an approach to valuing offshore petroleum leases. They make a number of contributions to the literature of valuing options and the detail of the valuation problem allows the authors “to consider informational and computational economies of the option valuation methodology relative to conventionally applied discounted cash flow techniques.”
(Copeland & Antikarov, 2003; Copeland, Koller, & Murrin, 2000) have also used a number of Oil industry examples in their books and there are numerous papers within the Society of Petroleum Engineers (SPE) library on the topic of ROA; (Galli, Jung, Armstrong, & Lhote, 2001) study the impact of additional wells on project value using real options, (Claeys & Walkup, 1999) discuss a series of practical framing techniques that uncover the managerial flexibility and learning that are hallmarks of real options, (De Abreu & Filho, 2009) discuss aspects of uncertainty in the economic evaluation of an exploratory project and apply the real options theory to a few simulated cases and (Lima & Suslick, 2002) compare results of portfolio selection of non-developed reserves using both traditional approaches and options timing. The list of interesting and informative applications of real options in the oil and gas sector continues on from this brief account.
13
The SPE papers on the subject of ROA show not only the benefit but also the versatility of options valuation in the exploration and development of oil fields. For example a paper by (Chorn & Croft, 1998) introduces the application of ROA in valuing data gathering during reservoir development. Exploration companies make phased investments in data gathering in order to gain more knowledge on the reservoir characteristics which results in reducing the level of uncertainty. The paper by (Chorn & Croft, 1998) shows that real options “provides a management tool to guide the execution of the project, optimising the outcome relative to the residual uncertainty at each decision point”. They also state that real options can also provide an insight into when a project lacks upside potential when the uncertainties are small and flexibility is limited. This is an important aspect of the real options process as it not only provides a value for flexibility but the process itself uncovers aspects or particulars of the project that an NPV model wouldn’t necessarily provide visibility on.
(Cortazar & Schwartz, 1997) developed a no arbitrage model for evaluating an undeveloped oil field and presented the numerical solution and implementation. The real options model developed in this paper provided several advantages such as not requiring estimates of risk premiums but rather using the risk free interest rates which are subject to far less estimating error. Cortazar & Schwartz also present a user-friendly computer program with graphical interface to help petroleum companies implement what they term a ‘sophisticated valuation approach’.
(Lander & Pinches, 1998) concluded in their paper that the various techniques used for real option models are not well known or understood by corporate managers and practitioners and many individuals do not have the required mathematical skills to use the models comfortably and knowledgably.
Fortunately since the beginning of the 2000s technology has developed to bring the application of real options to a position where calculus is no longer a necessary tool. Instead, we can use lattices and algebraic solutions that are easy to implement and easy to understand (Copeland & Antikarov, 2003). A specific goal of this research is to use an options analysis method that is easy to understand and present to the senior management of organisations.
14
The work of (Copeland & Antikarov, 2003) has been instrumental in providing real options practitioners with the tools to develop practical models that can be used in a wide range of scenarios. Their work is continuously referenced in papers and articles on ROA.
(Dezen & Morooka, 2002) make use of these relatively simpler techniques compared to those developed through the 1990s to value alternatives for deepwater field development. Similar to the four step approach used by (Copeland & Antikarov, 2003), Dezen & Morooka use a three step approach which first builds the cash flow model and calculates the present value for each development plan. Secondly they identify the options present in each development plan and determine the variables needed for the equation developed by (Black & Scholes, 1973). In the third and final step they calculate the expanded NPV of the project or the value of the project including flexibility. Dezen & Morooka conclude that “As a decision making tool, Real Option Valuation can assist the process of selecting the optimal field development plan by providing to the company the insight into the value of managerial flexibility.” Although this approach is easy to follow it makes use of a simple hypothetical field development and not an actual project, which is not the intention of this research which will also use a slightly more complex technique.
In a similar paper by (Dezen & Morooka, 2001) they propose that a field development using a FPSO may have a larger NPV than a subsea tieback to an existing facility, however by not valuing the option to defer the project to the last minute, which is possible in the subsea option because the development timeline is a lot shorter, the company may undertake an investment that is not as attractive as another development alternative. This could also be framed another way due to the volatility in the oil price, because by been able to delay the decision to invest gives the ability to avoid a down turn in the oil price and to also take advantage of any information that can still be acquired.
2.4 Real Option Valuation Methods
There is a wide range of literature on the topic of real options and its benefits but unfortunately few of these delve into the mechanics of the different approaches used and fewer still do this in a manner that is easily understood by the average practitioner. (Borison, 2005) provides an easy to follow comparison and critique of each of the more widely used concepts in ROA focussing on the fundamentals rather than granular details. By using a
15
simplified example of a firm evaluating the possible acquisition of an undeveloped natural gas field in the United States, (Borison, 2005) looks at the applicability, assumptions and mechanics surrounding each of the approaches.
As the research presented in this report uses only one of the five concepts presented by Borison it is worth giving a short introduction to the step by step mechanics of each as presented by Borison.
The Classic Approach (No Arbitrage, Uses Market Data)
1. Identify a portfolio of traded investments that replicate the underlying asset in question and calculate its price and volatility
2. Size the investment relative to the replicating portfolio 3. Apply the equation developed by (Black & Scholes, 1973)
The Subjective Approach (No Arbitrage, Subjective Data)
This is the same as the classic approach except the value and volatility of the underlying investment is subjectively estimated
The Market Asset Disclaimer (MAD) Approach (Equilibrium Based, Subjective Data)
This is the approach used for this research and the methodology followed is as per Section 3 of this report.
The Revised Classic Approach (Two Investment Types)
1. Determine if the investment in question is dominated by public (market) or private (corporate) risks.
2. If public risks, apply the classic approach 3. If private risks, use decision tree analysis
The difficulty with this is that generally in reality there is a mix of both public and private risks which leads to the final concept.
The Integrated Approach (Two Risk Types)
In understanding the assumptions of this approach Borison cites earlier work from (J. Smith & McCardle, 1998) which states that ”the basic idea of the integrated valuation procedure is
16
to use option pricing methods to value risks that can be hedged by trading existing securities and decision analysis procedures to value risks that cannot be hedged by trading.” The approach is then designed around the fact that most investment decisions have to consider both public and private risks. In the case of an undeveloped oil or gas field the private risk is the amount of reserves and the public risk is the price of oil or gas per unit of measurement. In summary it is clear that each of these approaches has differing assumptions leading to different mechanics. Perhaps the most important point to draw from this comparative exercise is that a practitioner of real options needs to understand the limitations and benefits of each of these approaches and select the one that best suits the investment in question, the information that is available and just as importantly the time and resources available for evaluation looking to achieve the level of scrutiny and quality that is deemed to be reasonable and practical.
Large engineering project by their nature come loaded with risks and when using the integrated approach it is vitally important that the risks are identified and evaluated at an early stage. (Mattar & Cheah, 2006) present the notion of private risk which, in this case, may either be correlated with the market or be unique. Mattar & Cheah also add that private risks have two additional characteristics in that they represent a substantial portion of the investor’s current wealth and they are either not tradable in the securities markets or inhibited from trading by large agency costs. The authors show that it is important to distinguish between unique and private risks and demonstrate that “the methods chosen for pricing private risk can lead to decisively different real options values, exercise strategies and development policies. Effectively, the difference in real option values can be interpreted as a form of private risk premium.
2.5 Limitations of Real Options
When making a comparison between tools for valuing capital investments it is important that both the benefits and limitations of each concept are researched and although a vast majority of the literature explores the value of real options there is some work which questions the justification for using real options and cautions the practise of using a tool which can over value a project.
17
(Eschenbach, Neal, Henrie, Baker, & Hartman, 2007) conclude that the value of real options is more limited than many suggest. They suggest as an example that using a higher hurdle rate forces projects to wait until profitability is high, similar to a deferral option, although they do concede that it’s difficult to translate risk into the hurdle rate and it’s subjective. The authors analyse four case studies for different industry sectors and conclude that options are only needed when the NPV is marginal or slightly negative. In the experience of the authors most economic evaluations provide a clear Yes/No answer once the parameters have been analysed and weak models or indicators are often adequate. This is certainly true, if the information at hand clearly points to a profitable project meaning that the company should stop the analyses and execute the project. There is no point in paralysing the decision making process with over analysis. To quote the authors “The payoff comes from doing good projects – not from doing better-than-needed analysis.”
While (Eschenbach et al., 2007) provide a valuable critique they also highlight some important benefits of real options in how it forces the analyst to contemplate the value of flexibility and to consider multiple options at time zero that may otherwise have been ignored. A major failure of real options can lie not in the technique or method used but rather in management. If management fail to exercise their options optimally then this can destroy value. (Copeland & Tufano, 2004) state that “the real reason real options sometime turn out to be less valuable than predicted by models is that managers don’t exercise their option rights in a timely rational manner.” To demonstrate this point (Copeland & Tufano, 2004) use a simple stock put option example with a one year maturity presented to shows that by not being alert the option holder can destroy up to 64% of the option value depending on its volatility.
(Copeland & Tufano, 2004) also advise that companies will find real options much more user friendly if they move away from the Black Scholes Merton model which is essentially a cookie cutter approach to option valuation and invest time to build binomial spreadsheets and follow the Market Asset Disclaimer approach.
18
2.6 Linking the benefits of Real Options Analysis to the Corporate Balance Sheet
In the most general form, the Value at Risk (VaR) measures the potential loss in value of a risky asset or portfolio over a defined period for a given confidence interval (Damodaran, 2007). The secondary objective of this research report is to try link the ROA to the calculation of the project VaR and quantify the improvement in the VaR due to flexibility that ROA evaluates. This can then be used as an input into determining the projects leverage ratio assuming the project is analysed as a stand alone company or financed through the structures of Project Finance.
Unfortunately very little relevant literature has been found on this approach. There is, however, a large amount of work in the area of determining the optimal amount of debt and equity in financing corporate expansion projects. (Sarkar, 2011) as part of his work on optimal expansion financing used a real options model in a ‘trade-off theory’ setting to derive the optimal finance package and optimal investment trigger.
In this field of work the real options approach seems to generally be used in determining the timing of the investment decisions which unfortunately does not assist with the intention of this research which is to rather show how the output of a projects real options analysis can contribute to the financial risk assessment as well as the analyses of the project’s sustainability and therefore its influence on the debt/equity ratio.
The work by (Trigeorgis, 1993) provides the best ground work into the secondary objective. His paper has two main sections, first it presents a comprehensive review of all the literature on real options up to 1993 which is summarised in a table presenting the various categories of real options, the sectors of industry where they are important and which authors have analysed them.The second part ”takes a first step towards extending the real options literature to recognize interactions with financial flexibility.”(Trigeorgis, 1993)
(Trigeorgis, 1993) initially assumes all equity financing and evaluates four different options in an oil extraction and refinery project example. The options are to defer, expand, abandon and to default on future investment outlays. In the next step the paper extends the analysis into a venture capital context and looks at the impact on value for the equity holder. (Trigeorgis, 1993) evaluates the benefits if staged financing and how this creates options such
19
as an option for the lender to abandon or the option to review the financing terms later in the project depending on the optimal execution of abandonment and expansion options and how the risk profile for the project has subsequently changed at the different stages. (Trigeorgis, 1993) concludes that the interactions between a firm’s operating decisions and financial decisions can be significant especially in large projects with high uncertainty and long duration with multi-staged investments or growth opportunities. Understanding these interactions and designing a flexible financing deal that recognises the value and reflects the evolution of the project risks over the life of the project can mean a difference between success or failure.
20
3
RESEARCH METHODOLOGY
3.1 Research Approach and Strategy
The crux of the research approach is to use an existing or past project as a case study to achieve the objectives outlined in Section 1.2. As the author has an engineering background in the upstream oil and gas industry the project was selected from the portfolio currently held by his employer. This made it possible to access the project specific data required for the research.
The first step in selecting the right project was to define some selection criteria. Real options have the greatest value when three key factors come together and these were used as the basis for the project selection criteria.
Original NPV analysis should have a marginally positive or if possible a marginally
negative NPV (if the project has a large NPV then the probability of exercising options that provide flexibility will be low, conversely if the NPV is hugely negative then no amount of flexibility is going to make it look attractive)
There should be significant uncertainties in key areas (size of asset, price of
inputs/outputs, Production volumes etc.)
Mangers must have flexibility to respond to uncertainty as they receive new information
over time i.e. have the ability to expand, contract, abandon the project
Lastly, the project needs to be a past project in order to have results on which to base the findings.
In reality the main driver for project selection was availability of data and information because oil and gas development projects by their nature are executed over a long time period and in some cases the right level of data was not available. In the end the project selected provided a happy medium between the selection criteria and this limitation.
Once the project was selected and a solid understanding gained on how the project was executed through the Plan of Development Document and the Production Sharing Contract a large portion of time was dedicated to learning and understanding the methodology around Real Options Analysis. This was predominately text book research with specific reference to (Copeland & Antikarov, 2003) and (Mun, 2006). This was supplemented with secondary
21
literature sources on the topic of Real Options which is presented in the Literature Review above.
3.2 Data Collection
Project economic data was gathered through a series of discussion or informal interviews with the company’s Economic Manager. There was little electronic information available resulting in the bulk of this data been collected as hard copies that had been filed away in archives. This information consisted of emails, project specific reports and contracts, presentations made within the joint venture, numerous print outs of spreadsheets and outputs from software used to model the reservoirs.
All this information was collated and analysed in order to determine the data to be used to build the base case for the project. This is essentially all the inputs used in defining the original project specifics that were used to model the project and base the execution decision on. This was a time consuming task as the source data contained a large number of model runs that formed part of the sensitivity analysis carried out at the time making it difficult to distinguish between the base case and up or downside sensitivity runs.
Discussions were also held with the company Development Manager to gain an understanding into the concept selection phase of the project and a basic insight into the sub-surface characteristics that drove the concept decision. The Development Manager was also able to give a brief on where the project currently is today and provide the production data collected to date for the field.
3.3 Data Analysis Methods
3.3.1 The Four Step Process
The analysis of the information and data on the selected project followed the four step process as described by (Copeland & Antikarov, 2003) and conceptually shown below.
22
Figure 3.1: Four Step Process (Copeland and Antikarov, 2003)
Step 1: The base case NPV was derived from the source data and compared well with NPV figures shown in JV Partner presentations. This step also included a review of the business strategy at the time taking cognisance of the competitive advantage, goals for growth and technical approaches or advantages with a view to identifying the flexibilities that can be brought into the project in Step 3.
Step 2: This includes identifying the key sources of uncertainty relevant to the project and developing an understanding of how the present value develops over time.
Step 3: The flexibility the managers had at their disposal in order to respond to uncertainty as it evolved was identified and an event tree developed to incorporate these options. An important part of this step is that this is where the flexibility has altered the risk characteristics of the project and therefore the cost of capital has changed. Each of these options are then valued during the ROA in step 4. The event tree gives the ability to identify what the options are at each node.
Step 4: Conduct a real options analysis valuing the project using algebraic methodology and an excel spreadsheet. The ROA results include the base case NPV without flexibility plus the option (flexibility) value.
3.3.2 Binomial Lattice
The real options model that was developed made use of the binomial tree lattice and replicating portfolio approach. As the projects value has the ability to go negative the additive process rather than the multiplicative process was used in developing the binomial tree. In the additive process the up and down movements of the tree are calculated on the basis of the initial project present value (PV) and the estimate of the volatility of the project rate of return.
Compute base case NPV
(without flexibility) Model the uncertainty Identify and incorporate flexibility in the project Conduct Real Options Analysis
23
The present value of the project was taken from the base case NPV model and an estimate of the volatility of returns then used to construct the binomial lattice. The volatility of returns is based on a Monte Carlo analysis of the sources of uncertainty. The Monte Carlo analysis transforms the multiple uncertainties that drive the value of the project into a single uncertainty which is the distribution of returns on the project. This single estimate of volatility is what is needed to build the binomial tree.
The Monte Carlo simulation gives a probability of the projects value however as mentioned above the volatility needed for the binomial tree is the volatility of the rate of return. To convert the values the following formula is used from (Copeland & Antikarov, 2003):
ln
Equation 3.1: Volatility of Projects Rate of Return
For t=1, this is a simple transformation that helps to convert between consecutive random draws of present value estimates in a Monte Carlo program and the standard deviation of the rate of return (project volatility).
3.3.3 The Replicating Portfolio Approach
The solution to a binomial lattice can be obtained in two ways. The first is the risk neutral probability approach and the second is the use of market replicating portfolios. The original intention was to use the Risk Neutral Probabilities approach as it is easier to construct within Excel. However during this process it was determined that this approach does not work with additive trees and the switch had to be made to the replicating portfolio approach. It is worth noting that this nuance was not clearly distinguished in the literature. The use of a replicating portfolio is more difficult to understand and apply, but the results obtained from replicating portfolios are identical to those through risk neutral probabilities (Mun, 2006), when using multiplicative trees.
The replicating portfolio approach consists of m units of a twin security and B units of the risk
free bond and uses the assumption called the Market Asset Disclaimer (MAD) (Copeland & Antikarov, 2003). This basically states that the value of the cash flows of the project without
24
flexibility derived from the base case NPV calculation is the best unbiased estimate of the market value of the project were it a traded asset.
The replicating portfolio approach values the option through the equation which is determined in (Copeland & Antikarov, 2003).
1 Where:
Cu = the up step value of the project with flexibility
Cd = the down step value of the project with flexibility
Vu = The up step value of the project without flexibility (The value of the underlying)
Vd = The down step value of the project without flexibility
V0 = The underlying project value in the previous time step
rf = Risk free rate
Equation 3.2: Value of the project with flexibility
This provides the value of the project including flexibility or the options at any point in time in the tree. By determining the maximum between the value of the project and the value of the option it can be decided whether or not to exercise the option. By valuing each time step in a backwards process from the end of the tree the final value of the project, including flexibility can be determined.
3.3.4 Value at Risk
The project value at risk is calculated using Monte Carlo simulation which is one of the three methods described by (Damodaran, 2007).
3.4 Limitations
The information that was gathered for the project was presented in annual time steps. To take full advantage of the real options process the time steps should coincide with the periods at which management can make decisions. This could be monthly or at quarterly or even
25
biannual business reviews or perhaps when ever the Joint Venture partners meet. More time steps means a greater granularity can be achieved leading to an enhanced accuracy of the process. It was not possible to change the annual phasing of the capital and operational expenses as well as the annual production volumes into smaller time steps so the research had to remain with annual time steps.
Real options analysis is a process and therefore as it has been noted there was some difficulty experienced in trying to frame a project that has already been evaluated and executed into a real options model. The lesson taken from this is that ROA is a tool that needs to be incorporated in the decision making process right from the very beginning so that the data used in the analysis can be structured in a format that compliments the real options model.
26
4
RESEARCH FINDINGS, ANALYSIS AND DISCUSSION
4.1 Base Case NPV Analysis
The source data contained numerous NPV model outputs of spreadsheets making it difficult to determine exactly what the base case was that was originally evaluated. The Plan of Development and Production Sharing Contract along with presentations and other data on reserves provided a clearer picture of what the base case was and it was decided that the most practical solution was to build the base case NPV model from scratch using all the information collected as a platform to work from rather than rely on spreadsheet models from unknown authors.
Once the base case model for the TLP concept was constructed the cost data for the subsea option was then used to build an NPV model for the subsea concept that was also under consideration. The DCF for both options are provided in Appendix 1 & 2
Where possible the same assumptions and methodology that was used in the source data spreadsheets and printouts was used to build the NPV model for this research. The NPV model forms the basis of the ROA and needs to be constructed in the same way as those that evaluated the project did so at the time.
Unless otherwise indicated all results, figures and tables refer to the Base Case of the TLP Option.
4.1.1 Assumptions
Some of the basic assumptions made in the model are:
The current year of the model is 2004
The inflation rate throughout the life of the project is 2.5% and all costs incurred after 2004 are subject to inflation
The first year of production is 2007
The last year of production is 2026
The life of the project is 22 years (2004 to 2026)
Company overheads and loan repayments have not been included
27
4.1.2 Reserves
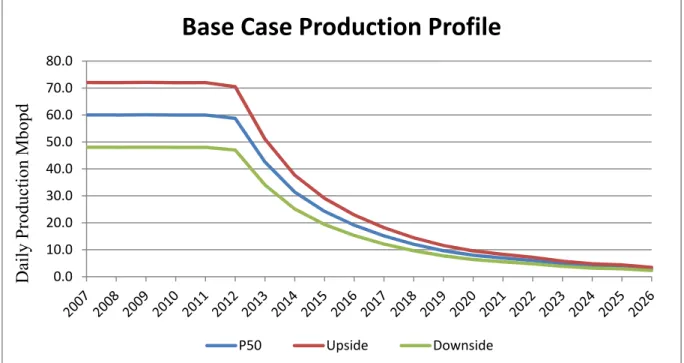
The amount of recoverable reserves in place as presented in the POD is 201 MMbbl. This amount presents the most likely scenario or P50 case. P50 meaning that there is a 50% chance of exceeding this amount. Modelling the reservoir and determining the amount of recoverable reserves has a number of uncertainties in terms of reservoir properties, porosity, trap size and geometry, seal containment, pressures and so forth. It is therefore not an exact science and the amount of recoverable reserves is a major source of uncertainty within the upstream oil & gas industry.
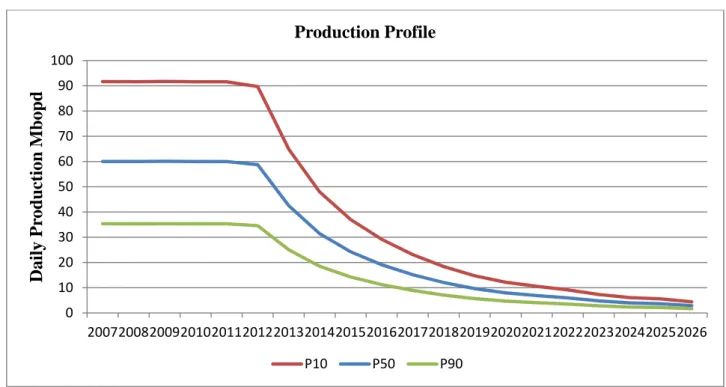
The P50 production profile for the field is shown below along with an upside and downside case, as presented in the source data, which is simply +/-20%. These two cases were part of the many sensitivities cases originally run which is why they are shown here.
Figure 4.1: Base Case Production Profile
As it can be seen from the above curve the production has a peak plateau for approximately six years and then has a rapid decline down to the end of the life of the field.
4.1.3 Oil Price
The oil price for the NPV calculation is modelled in same way as that found in the original data. From 2004 to 2008 Brent forward curve values are used and for the rest of the project
0.0 10.0 20.0 30.0 40.0 50.0 60.0 70.0 80.0
Daily Production Mbopd
Base
Case
Production
Profile
28
duration a base oil price of $21/bbl adjusted for inflation is used. The oil price is also subject to a -$1 quality premium.
4.1.4 Capital Investment Costs
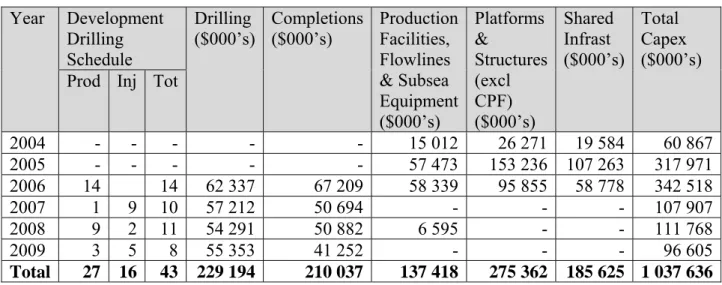
The capital expenditure and phasing is given for both the TLP and Subsea options in Appendix 3 & 4. A summary of these is provided in the Table Below. The author of this spreadsheet is unknown and therefore cannot be referenced however these costs do correlate with what is presented in the POD.
Table 4.1: Capital Costs – TLP Option Year Development Drilling Schedule Drilling ($000’s) Completions ($000’s) Production Facilities, Flowlines & Subsea Equipment ($000’s) Platforms & Structures (excl CPF) ($000’s) Shared Infrast ($000’s) Total Capex ($000’s) Prod Inj Tot
2004 - - - - - 15 012 26 271 19 584 60 867 2005 - - - - - 57 473 153 236 107 263 317 971 2006 14 14 62 337 67 209 58 339 95 855 58 778 342 518 2007 1 9 10 57 212 50 694 - - - 107 907 2008 9 2 11 54 291 50 882 6 595 - - 111 768 2009 3 5 8 55 353 41 252 - - - 96 605 Total 27 16 43 229 194 210 037 137 418 275 362 185 625 1 037 636
Table 4.2: Capital Costs – Subsea Option Year Development Drilling Schedule Drilling ($000’s) Completions ($000’s) Production Facilities, Flowlines & Subsea Equipment ($000’s) Platforms & Structures (excl CPF) ($000’s) Shared Infrast ($000’s) Total Capex ($000’s) Prod Inj Tot
2004 - - - - - 34 883 14 290 19 839 69 011 2005 - - - - - 143 044 21 435 109 942 274 422 2006 14 14 64 786 88 056 76 500 - 62 222 291 565 2007 1 9 10 58 342 74 298 - - - 132 640 2008 9 2 11 49 453 67 012 6 595 - - 123 061 2009 3 5 8 54 203 74 395 - - - 128 598 Total 27 16 43 226 785 303 761 261 021 35 725 192 004 1 019 296
The difference between the two options is $18 340 000 which is less than 2% on an investment that is over a billion dollars.
29
4.1.5 Operating Costs
Operating costs have been adjusted for inflation and come to a total expenditure over the life of the project of $799 190 494.
4.1.6 Abandonment Costs
Abandonment refers to not only the plugging and abandoning of all wells in order that they pose no threat to the environment but it also includes the removal of all production facilities and equipment and the re-instatement of the seabed to its original condition as per government or industry regulations. The abandonment costs were estimated to be $65 400 000, making an adjustment for inflation and assuming an abandonment year of 2026 this value is $115 406 539. Under the terms of the PSC the JV has to pay in to an abandonment fund each year in order to ensure the necessary funds are available at the end of the field life. Payment into the fund starts two years after first production. This equates to a value of $6 411 419 each year from 2009 to 2026.
4.1.7 Summary of Production Sharing Contract Terms
Production Sharing Contracts or Agreements are awarded by governments to an oil company which then explores and develops the field in terms of the requirements contained within the PSC. The PSC stipulates the Royalties that need to be paid as well as any other signing or production bonuses. The company is also permitted to use the money from the produced oil to recover capital and operational expenditure, this is termed Cost Oil. The balance of the revenue is then termed Profit Oil and is split between the government and the JV under the terms of the PSC.
The terms of the PSC under which this project falls are summarised as follows:
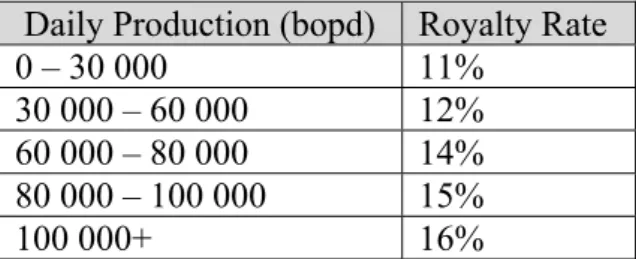
Royalty
30
Table 4.3: Royalty Rate
Daily Production (bopd) Royalty Rate
0 – 30 000 11% 30 000 – 60 000 12% 60 000 – 80 000 14% 80 000 – 100 000 15% 100 000+ 16% Bonus Payments
Bonus payments are not cost recoverable and are made to the government at the following stages:
Production rate > 30 000 bodp ($3 000 000)
Production rate > 60 000 bopd ($3 000 000)
Production rate > 100 000 bopd ($4 000 000)
Cost Recovery (Cost Oil)
The JV is allowed to recover almost all capital investments and operating costs from post-royalty revenues. There is an annual cost recovery ceiling of up to 70% of post post-royalty revenues; any unrecovered costs are carried forward to the next period. The full amount of the operating expense can be included in the cost recovery pool in the year of outlay. Capital expenditures however are gradually transferred to the cost recovery pool via a four year straight line depreciation.
Profit Oil
Once the JV has recovered the eligible costs in each given year the remainder or Profit Oil is divided between the JV and the government as per the table below:
Table 4.4: Profit Oil
Cumulative Production (MMbbl) JV Share Government Share 0 – 200 80% 20% 200 – 350 70% 30% 350 – 450 60% 40% 450 – 550 50% 50% 550+ 40% 60%
In addition to this, 5% of the JV share of profit oil is assigned to the State Oil Company. Finally the remaining revenues are subject to a 25% corporate income tax.
31
The sliding scale of all these parameters is accounted for in the spreadsheet model so that when the Monte Carlo analysis is run as part of the next step in modelling the uncertainty these determinants of the projects present value are properly captured.
4.1.8 Discount Rate
Company has used a standard discount rate of 10% in calculating the NPV. This value will therefore also be used for the purposes of this research.
4.1.9 Results & Sensitivity Analysis
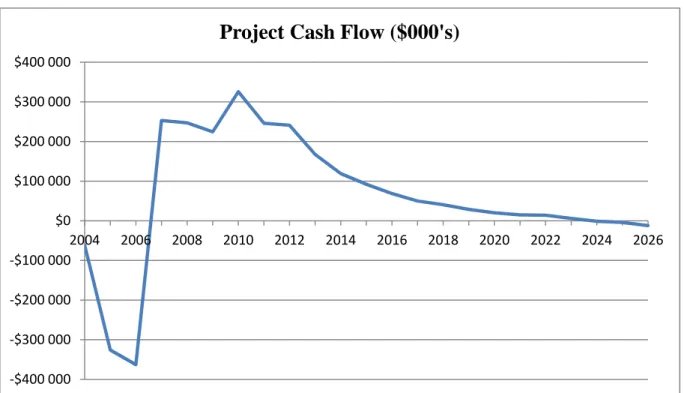
The main output from the NPV model is the project cash flow and other indicators that can be used in the decision making process. The cash flow for the project is depicted below with cumulative net cash flow for the project totalling: $1 391 044 389
Figure 4.2: Project Cash Flow
A useful indicator to take from this exercise is the Development Costs per barrel of recovered reserves. The values given include for inflation.
Capex/bbl $5.47 Opex/bbl $3.99 Total $9.46 ‐$400 000 ‐$300 000 ‐$200 000 ‐$100 000 $0 $100 000 $200 000 $300 000 $400 000 2004 2006 2008 2010 2012 2014 2016 2018 2020 2022 2024 2026
32
The internal rate of return for the Project is a healthy 24%
A summary of the NPVs for the project is provided in the table below: Table 4.5: NPV Summary Discount Rate TLP ($000’s) Subsea ($000’s) 8% $598 753 $594 682 10% $475 324 $476 210 12% $371 198 $376 248
These values compare very well with those found in a JV partner presentation which was $481MM and $479MM for the TLP and Subsea options respectively using a 10% discount rate.
The summary of the NPV analysis of both options shows very similar and relatively strong NPVs and IRR. It may therefore be argued that given these numbers why is there a need for ROA? As it shall be demonstrated the real options process provides the opportunity to identify the flexibility of both concepts and value that flexibility. Flexibility can come at great cost which can sometimes make it uneconomical and therefore ROA is the tool that can ensure this is properly evaluated.
In this particular case, given the hugely successful outcome of the project more could possibly have been done to prepare for future expansion. The ROA process is able to identify the large potential upside and give management the justification for making those preparations. These preparations may have insignificant costs but if anticipated early on can save time and money in the long run.
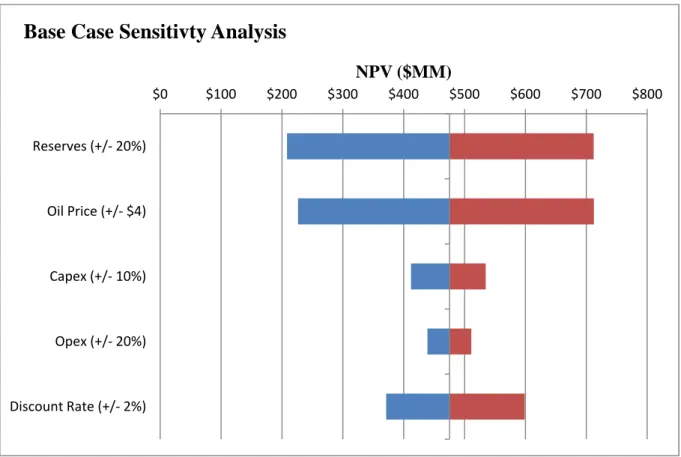
In line with the traditional DCF approach to valuing a project a sensitivity analysis has been done on a number of the inputs: see Figure 4.3 below. The results of the sensitivity analysis provide the information required to determine the major uncertainties which the project faces. The sensitivity of the oil price is very pronounced even with a small increase of $4, considering that the model uses a dollar per barrel price of $21 adjusted for inflation and in reality the price rose to over $90/bbl during the production plateau period of the project.
33
Varying the total number of recoverable reserves between 160MMbbl and 240MMbbl also provided a significant variance in the NPV. Given that the impact of the development costs is relatively small compared with oil price and reserves it shall be ignored as an uncertainty for the purpose of this research and assessing the contribution that ROA can make to the evaluation process. There is also little the project can do to respond to variances in the estimates of capital and operating costs but the project does have the flexibility to respond to changes in the anticipated reserve volumes and oil price.
Figure 4.3: Sensitivity Analysis Tornado Diagram
4.2 Modelling the Uncertainty
4.2.1 Oil Price Uncertainty
Mean-reverting versus Geometric Brownian Motion Price models
Initially it was anticipated that because it is a commodity the price of oil would follow a mean reverting process. (J. Smith & McCardle, 1999) assessed both a Geometric Brownian Motion (GBM) Price model and a Mean-reverting Price model. They stated that the Brownian Motion model was the most frequently used in real options literature however the managers they were performing the study for argued against this saying that when prices were high compared to a
$0 $100 $200 $300 $400 $500 $600 $700 $800 Reserves (+/‐20%) Oil Price (+/‐$4) Capex (+/‐10%) Opex (+/‐20%) Discount Rate (+/‐2%) NPV ($MM)
34
long run average, oil companies invest in new projects and more production capacity is brought online and older production that was expected to come offline, stays online for as long as possible. Therefore as a result of the increased supply, prices are driven back down towards the long run mean. The managers also stated that conversely, when prices are low less new production comes online creating a higher demand, driving the prices back up towards the long run mean.
This theory see