Deanship of Graduate Studies
Al-Quds University
E-Learner Recommendation Model Based on Level of
Learning Outcomes Achievement
Abeer Hasan Abdelrahim Mousa
M.Sc. Thesis
Jerusalem-Palestine
E-Learner Recommendation Model Based on Level of
Learning Outcomes Achievement
Prepared By:
Abeer Hasan Mousa
B.Sc. Computer Engineering from - Birzeit University
- Palestine.
Supervisor: Dr. Badie Sartawi
A Thesis Submitted in Partial Fulfillment of the
Requirements for the Degree of Master of Science in
Computer Science /Department of Computer Science
Faculty of Science &Technology /Deanship of
Graduate Studies /Al-Quds University.
I
Dedication
I dedicate my thesis to my family. A special feeling of gratitude to my
loving parents, whose words of encouragement and push for tenacity ring
in my ears. I also dedicate this dissertation to my beloved husband and
my wonderful kids, and I will always appreciate their patience,
encouragement and all they have done for me. I also dedicate this
dissertation to anyone who have supported me throughout the process.
Thank you all
II
Acknowledgement
First and foremost, praises and thanks to the God, the Almighty, for His showers of blessings throughout my research work to complete the research successfully.
I would like to express my deep and sincere gratitude to my research supervisor, Dr. Badie Sartawi who inspired and taught me since the days I began working on this thesis. I appreciate all his contributions of time, ideas and support to bring this work to the life.
Besides my advisor, I would like to thank the rest of my thesis committee: Dr. Ahmad Ewais and Dr. Kamel Hashem for their encouragement, insightful comments, and questions.
My sincere thanks also go to Dr. Rashid Jayousi for his continues support, encouragement and bright ideas and for Dr. Jehad Najjar for his guidance and observations to work in the frst days.
I would like to acknowledge my father Dr. Hasan Yousef for his continues help and support. And my mother whose love and guidance are with me in whatever I pursue. Also, I owe a debt of gratitude to my loving and supportive husband Dr. Rami Mousa and my three wonderful children Omar, Mumen and Lamar.
III
Abstract
Students in any learning environment differ in their level of knowledge, achieved learning outcomes, learning style, preferences, misunderstand and attempts in solving and addressing problems when their expectations are not met.
When a student searches the web as an attempt to solve a problem, he suffers from the large number of resources which are, in most cases, not related to his “needs”, or may be related but complex and advance. The result of his search might make him more confused, scattered, depressed and finally result in wasting his time which – in some cases -may have negative effects on his achievements.
From here comes the need for an intelligent learning system that can guide students based on their needs. This research attempts to design and build an educational recommender system for a web-based learning environment in order to generate meaningful recommendations of the most interested and relevant learning materials that suit students’ needs based on their profiles1
. This can be achieved by accessing students’ history, exploring their learning navigation patterns and making use of similar students’ experiences and their success stories.
The study proposed a design for a hybrid recommender system architecture which consists of two recommendation approaches: the content and collaborative filtering. The study concentrates on the collaborative recommender engine which will recommend learning materials based on students’ level of knowledge, looking at active students' profiles, and achievements in both learning outcomes and learning outcomes levels making use of similar students’ success stories and reflecting their good experience on active student who are in the same level of knowledge.
The design of the collaborative recommender engine includes the “learning” module from which the engine learns past students’ access pattern and the “advising” module from which the engine reflects the experience of similar success stories on active students.
The content base recommender engine with its suggested stages is considered as future work, the research used the k-mean cluster algorithm to find out similar students where five distance function are used: Euclidean, Correlation. Jaccard,
1
IV
cosine and Manhattan. The cosine function shows to be the most accurate distance function with the minimum
SSE but the highest processing time that doesn’t differ a lot when compared the rest functions. The best number of clusters for the selected dataset was determined using three methods Elbow, Gap-statistic and average Silhouette approach where the best number of cluster shows to be three. The research used the two result rating matrices of similar good and good students with Learnings material in order to calculate learning material weights and rank them based on highest weights which results in a final recommendation list.
Keywords
Recommender system, digital libraries, learning outcomes, collaborative filtering, Ranking, adaptive e-learning systems
V
Table of Content
Dedication ... i
Acknowledgement ... ii
Abstract ... iii
List of Tables ... vii
List of Figures ... vii
Terms and Definitions ... xii
Introduction ... 1 1.1 Research Overview ... 2 1.2 Motivation ... 2 1.3 Research Questions ... 3 1.4 Research Goals ... 3 1.5 Research Contributions ... 4 1.6 Literature Reviews ... 4 1.7 Thesis Outline ... 8 Educational Theory ... 9 2.1 Learning Approaches ... 10 2.2 Learning Taxonomy ... 10
2.2.1 Bloom's taxonomy theory ... 11
2.2.2 Bologna Declaration ... 14
2.3 E-Learning and adaptive e-Learning systems ... 15
2.4 Intelligent Tutoring System ... 16
Knowledge Discovery ... 18
Introduction ... 19
3.1 Data Mining in Recommender Systems ... 19
3.2 Sampling ... 20
3.3 Data Distribution Models ... 22
3.4 Distance and Similarity Measures ... 27
3.4.1 Euclidean distance ... 27
3.4.2 Correlation Distance (or Pearson correlation distance) ... 28
VI
3.4.4 Cosine Similarity ... 31
3.4.5 Manhattan (or City-Block) Distance ... 32
3.5 Analysis Process ... 33 3.5.1 Cluster Analysis ... 34 3.5.2 K-means Algorithm ... 34 Recommender System ... 51 Introduction ... 52 4.1 Recommender system... 52
4.2 Recommendation in learning management systems ... 53
4.3 Recommendation Approaches ... 54
4.3.1 Content-based recommender system ... 54
4.3.2 Collaborative recommendation approaches ... 55
4.3.3 Hybrid Recommendation Approaches ... 56
4.3.4 Challenges and Issues ... 56
4.4 Collaborative Recommender system algorithms ... 57
4.4.1 Memory-based algorithms ... 57
4.4.2 Model-based algorithms ... 58
Methodology ... 59
Introduction ... 60
5.1Recommender Engine Architecture ... 60
5.2 Collaborative Recommender Approach ... 64
5.3 Data preparing – Creating the Dataset ... 66
5.4 Data Model ... 69
5.5 Matrix types ... 71
5.6 Students’ responses indicators ... 73
5.7 Recommender Engine Setup – Inputs and configuration ... 74
Results and Discussions ... 77
6.1 Generated Data Statistics ... 78
6.1.1 Students’ achievements in a learning outcome ... 78
6.1.2 Students’ achievements in a Course ... 79
6.1.3 Students’ trends in levels of learning outcomes ... 80
6.2 Students’ Similarity ... 81
6.2.1 Building the Matrix ... 82
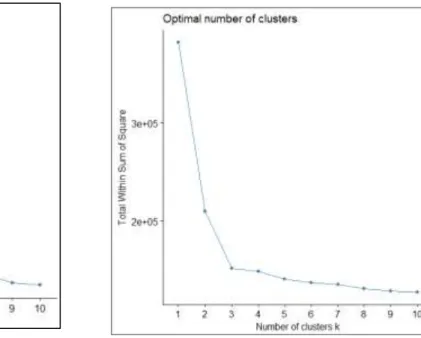
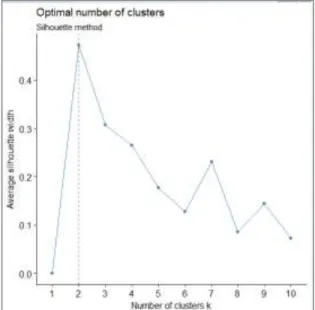
6.2.2 Choosing the number of clusters “K” ... 87
6.2.3 Applying k-means method using five different distance methods ... 93
VII
6.2.5 Applying K-means method using R ... 105
6.3 Learning Material Recommendation ... 108
Conclusion ... 112 7.1 Conclusion ... 113 7.2 Limitations ... 114 7.3 Future Work ... 114 References ... 115 ... 140
List of Tables
Table 2. 1 Bloom’s taxonomy vs Anderson/Krathwohl levels, definitions and verbs 13 Table 5. 1 Database tables classified into three layers ... 70Table 6. 1 Students’ trends in the levels of learning outcome in course ... 81
Table 6. 2 Learning outcomes and learning outcomes levels for each course, learning outcomes levels. ... 84
Table 6. 3 Students achievements in levels of learning outcomes ... 85
Table 6. 4 Active to Similar Student Absolute Average Difference ... 101
Table 6. 5 Rating matrix of best students ... 108
Table 6. 6 Rating matrix of best students ... 109
Table 6. 7 Two recommendation list is generated for good similar students and good students for an active course ... 109
Table 6. 8 Recommendation Lists based on good students and similar good students weight ... 111
List of Figures
Figure 2. 1: Original Bloom Taxonomy primary level in cognition domain (1956). . 12VIII
Figure 2. 2: Revised Taxonomy (2000-2001), Anderson and Krathwohl primary level
in cognition domain. ... 12
Figure 2. 3:Adaptive e-learning Architecture [24] ... 16
Figure 3. 1:Main steps and methods of a data mining problem ... 20
Figure 3. 2: Normal distribution for student marks based on random generted data set ... 23
Figure 3. 3:Poisson distribution ... 24
Figure 3. 4:Binomial distribution ... 25
Figure 3. 5:Probability mass function ... 26
Figure 3. 6: The Euclidean Distance between 2 variables in 3-dimensional space .... 28
Figure 3. 7: Student’s achievement in 30 learning outcome ... 29
Figure 3. 8: Correlation coefficients between students using data analysis in excel .. 29
Figure 3. 9:Correlation distance between students using R where correlation distance is compliment for Correlation coefficient ... 29
Figure 3. 10: Learning outcome achievement summary per student ... 30
Figure 3. 11: Similarity between students based on Jaccard distance ... 31
Figure 3. 12: Similarity based on Jaccard distance ... 31
Figure 3. 13:Two-dimensional illustration of Euclidean distances between two points ... 32
Figure 3. 14: Cosine similarity between a set of four students ... 32
Figure 3. 15: Manhattan distance between four students using R ... 33
Figure 3. 16:Two-dimensional illustration of city-block distances between two points ... 33
Figure 3. 17: Basic k-means algorithm steps ... 35
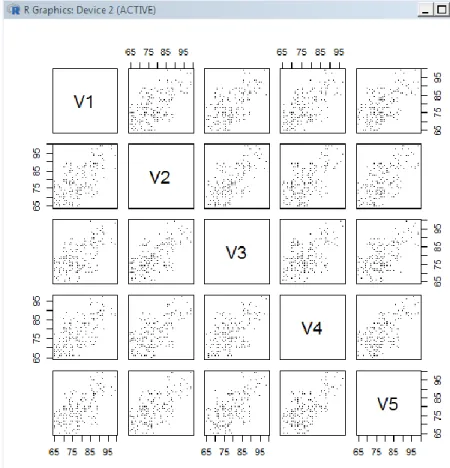
Figure 3. 18: 200 hundred student marks in 30 learning outcomes represented in R . 36 Figure 3. 19: Scatterplot matrix of the first five learning outcomes for 200 students 37 Figure 3. 20: k-mean cluster for the first ten learning outcome of 200 student using R ... 38
Figure 3. 21: Number of Students in each cluster ... 38
Figure 3. 22: Four cluster plot for the first ten learning outcomes of 200 student ... 39
Figure 3. 23: Plot of k-means of four-clusters solution for student achievement in learning outcome ... 40
IX
Figure 3. 25: Applying Elbow method on all learning outcome for 200-students data
set ... 41
Figure 3. 24: Applying Elbow method on the first 10 learning outcome for 200 students data set ... 41
Figure 3. 26:Applying Silhouette method on all learning outcomes for 200 students 42 Figure 3. 27: Applying Silhouette method on the first 10 learning outcomes for 200 students... 42
Figure 3. 28: Applying Gap Statistic method on all learning outcomes for 200 students... 43
Figure 3. 29:Applying Gap Statistic method on the first 10 learning outcomes for 200 students... 43
Figure 3. 30: Applying NbClust package on student data set ... 44
Figure 3. 31:D index to determine the number of index ... 45
Figure 3. 32: Cluster plot for the first ten learning outcomes of 200 students where k = 2 ... 46
Figure 3. 33: Cluster cohesion ... 47
Figure 3. 34: Cluster separation ... 47
Figure 3. 35:Plot of within-groups sum of squares error against number of clusters . 48 Figure 3. 36: SSE against the number of tested clusters for both the actual and 250 randomized matrices ... 49
Figure 3. 37: Absolute difference between the actual and random SSE against the cluster solutions... 50
Figure 4. 1: matrix of users’ rates on nine items ... 55
Figure 5. 1: Overall architecture for an E-Learning recommender engine ... 62
Figure 5. 2: Block diagram for the proposed model of Educational Recommender System – Collaborative Approach ... 66
Figure 5. 3: Normal distribution of students’ marks ... 68
Figure 5. 4:Data model in recommender engine ... 70
X
Figure 6. 2: Marks distribution for a learning outcome ... 79
Figure 6. 3: Students achievements in “Mathematical Expression and Reasoning for Computer Science” in 2007 ... 80
Figure 6. 4: Generated sparse matrix for student learning outcomes where the student’s Id is printed at the beginning ... 83
Figure 6. 5: building Student 17012006 spars Matrix for Learning Outcomes ... 83
Figure 6. 6: The spars matrix of learning outcomes levels for student 17012006 ... 86
Figure 6. 7: Log file while generating the sparse matrix for student's learning outcomes levels ... 86
Figure 6. 8: Elbow method for sparse matrix of learning outcome Levels ... 88
Figure 6. 9:Elbow method for sparse matrix of learning outcome ... 88
Figure 6. 10: Elbow method for dense matrix of levels of learning outcome ... 89
Figure 6. 11: Elbow method for dense ... 89
Figure 6. 12: Silhouette approach on sparse matrix of learning outcomes Levels ... 90
Figure 6. 13: Silhouette approach on sparse ... 90
Figure 6. 14:Applying average Silhouette approach on dense matrix of levels of learning outcomes ... 91
Figure 6. 15:Applying average Silhouette approach on dense matrix of learning outcomes ... 91
Figure 6. 16: Gap statistic method on sparse matrix of learning outcomes ... 92
Figure 6. 17: Parameters for clustering process ... 93
Figure 6. 18:Similarity Results based on clustering process ... 94
Figure 6. 19: Statistics dashboard for clustering process ... 94
Figure 6. 20: General statistics on different distance function ... 95
Figure 6. 21: Average time and memory usage indicators ... 95
Figure 6. 22: Required to actual number of cluster indicators ... 96
Figure 6. 23: Clustering process page showing the results of clustering operation .... 97
Figure 6. 24: Abdelrahman and Haleema marks in course “CSC495H1” ... 98
Figure 6. 25: a Hussein and Haleema marks in course “CSC495H1” ... 98
Figure 6. 26: Ayoub and Haleema marks in course “CSC495H1” ... 99
Figure 6. 27: Sana and Haleema marks in course “CSC495H1” ... 100
Figure 6. 28: Active to similar students’ absolute average using correlation vs cosine distance... 102
XI
Figure 6. 29: Active to similar students’ absolute average using cosine distance when
k=6 ... 102
Figure 6. 30: Active to similar students’ absolute average using cosine distance when k=4 ... 102
Figure 6. 31: Gap between junior active & similar student marks - batch 421 ... 104
Figure 6. 32: Gap between senior active & similar student marks ... 105
Figure 6. 33: Convergence of similar students’ marks ... 105
Figure 6. 34: K-mean analysis for senior and junior students ... 106
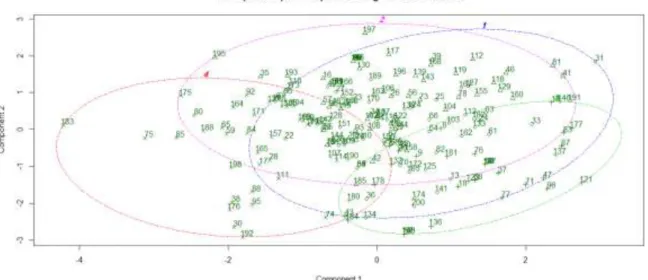
Figure 6. 35: using the clusplot command to show clustering results in R... 106
Figure 6. 36: Cluster plot for junior students’ analysis ... 107
Figure 6. 37:Cluster plot for senior students’ analysis... 107
Figure 6. 38: Recommender engine setup page ... 110
List of Appendices
Appendix A ... 118SSE R Script... 119
Generating Data Set Scripts ... 123
XII
Terms and Definitions
Active Student: Is an under graduate student who register for the current academic semester for at least one course and is waiting a recommendation list of learning material
Active Course: Is the course which is taken by an active student in the current academic semester.
Similar Student: Are those students who are clause in their achievement to the active student.
Good Students: Those students who achieved high marks in an active course.
Senior Student Students in his fourth year in university.
Junior Student Student in his third year in university.
High Marks: Are marks which are higher than the mark configured in the recommender engine setup page; refer to section 5.7 for more details.
Learning Material: Are those helping material such as papers, presentations, summaries, videos and any other helping material which helps the student to enhance his achievement
Strongly Recommended Materials
materials are those materials which appear to have a strong relationship with a student’s better significant results in a certain course.
Users: Are those who use any type of recommender system, users could be customers, students, employees ...etc.
Active users Is the user who will be recommended with a set of items that seems to be useful for him based on the recommender system approach.
Student current status Is defined by the set of learning outcomes accomplished by his achieved marks.
Items General term for the set of output recommendation, Items Could be products, learning material, CVs and others. This depends on the environment in which the recommender engine works.
XIII
tf–idf representation Term frequency–inverse document frequency, a numerical statistic that reflect how important a word is to a document
Efficiency Is the computational complexity of the algorithm
ILT Is the driver of research and development around Learning Technologies and the relevant learning platforms, standards and practices at Al-Quds University
QLearn platform will be developed to address the pitfalls in current online learning platforms like (Learning (Course) Management Systems). Qlearn is an outcome-based system and will enable effective mapping between learning objectives, learning objects and assessment using keywords mapping between learning objects and learning outcomes
1
Chapter 1
2
1.1
Research Overview
Instructors and academic staff in the educational institutes have a large amount of learning materials depending on their courses. These learning materials are a perfect match for course learning outcomes and students’ different needs. At the same time, students are always searching for learning material related to their courses in order to increase their understanding and achievement level. But when students search the web, they really suffer from the large number of resources, which in most cases are not related to their needs and make them more confused, scattered and depressed. All of this result in wasting time and may have negative effects on student achievements.
An e-Learning Recommendation System (LRS) is a solution for this problem. The LRS will match between learning materials and students’ needs based on their academic profile, achievement level and learning outcomes required by their active courses.
LRS will build its experience and decide on a “Strongly Recommended Learning Material” based on previous similar students’ profile, their achievements in certain courses and related Learning materials that they used.
1.2
Motivation
Most of educational recommender system focuses on the accuracy of predicting learning materials and how much these learning materials match a student’s active course. The main target in any adaptive e-learning system is to minimize the gap between student needs and the knowledge provided in order to make the learning process easier and more interesting.
This research aims to design an LRS that focuses on the accuracy of predicting learning materials based on student’s needs and gap of knowledge between him and the provided course, making use of the learning patterns of similar students who were in the same level of knowledge as the active student but succeed to achieve high marks in the active course.
Students’ knowledge was determined based on their academic profile and achievement level of learning outcomes. The LRS will suggest learning materials based on students’ needs and will result in a “strongly recommended learning material” based on students’ weaknesses, which results in building a coherent knowledge and a deeper understand for their course.
3
Students’ needs and weaknesses are discovered through their academic achievement in learning outcomes and in learning outcome levels for each taken course and its related courses. So, a student who is weak in the “understanding” level needs more learning material that help him advance in this level.
The suggested LRS will build it’s experience significantly based on better results and achievement of previous students who took the same course and were in the same knowledge level as the active student but differ in the high achievement they gain in the active course. This can be fulfilledby discovering the relation between the high achievement of those students and their interaction with learning materials so the LRS can reflect their good experience on active students.
1.3
Research Questions
1. How can we build an effective LRS that matches between course learning outcomes, learning materials and students’ needs in order to gain higher educational achievement levels?
2. How does LRS measure the student needs? In other word, how can the LRS measure student achievements level in each learning outcome related to the course, and decide learning material based on that?
3. How can the LRS build its experience in order to enhance its recommendation for students?
4. A group of students may all register in the same course and may all have completed the same previous courses, but of course their achievement level differs. So, the gained knowledge will differ from one student to another.
Can the suggested LRS take this point into consideration and give its recommendation to each student based on their Knowledge (not just on achieved courses)? How can these learning materials being ranked, fit students’ needs and draw the road map of correct Knowledge construction?
1.4
Research Goals
1. To solve the overload problem and huge number of learning materials when using digital learning libraries which may cause students to become confused, scattered and depressed.
4
2. To build an effective LRS that matches between student knowledge (which is based on his academic profile and achievements) and his active courses' learning outcomes, to find out learning materials which are suitable for the students’ needs in order to gain higher educational achievements level.
3. To rank the recommended results according to students’ needs, starting from the easiest learning material to the hardest. In other words, starting from the strongly recommended materials
4. To find out an effective mechanism in which the suggested LRS will build its experience in order to enhance its recommendation for students.
1.5
Research Contributions
1. Assessing student knowledge level based on their achieved learning outcomes and outcomes levels.
2. Find similar students with the same level of knowledge.
3. Make use of similar students’ success stories and reflect their experience in using learning material on active students in order to enhance their achievements and help them gain higher marks.
4. The design of the suggested recommender engine guarantees that the engine will overcome the cold start problem due to the content base approach which will work as primary recommender in the absence of history information on either course or student profile.
5. Recommending learning materials based on student knowledge, making use of student profile and achievement in learning outcomes and learning outcome levels.
1.6
Literature Reviews
The aim of this research is to build an LRS that evaluates student knowledge based on their academic profile and achievement level, then suggests learning material based on student profile. Researchers in this area have provided different approaches.
5
Jamil Itmazi (2010) presents a new proposal of recommendation algorithm in learning management system which could automatically recommend suitable learning objects from a big list of digital libraries based on an integration between the digital library and the learning management system. The algorithm is considered as a hybrid recommendation system which consists of some RS approaches; content-based system, collaborative filtering, rule-based filtering and demographic-based system.
The study depends on content-based system as a primary approach to detect similarities among learning items of current course to retrieve a list of related learning objects. The retrieved list will be subjected to teacher recommendation in order to classify the heights priority objects. The list will then pass into a collaborative filter, which acts as a complementary approach to organize the priorities of the recommendations in which all similar students with same profiles (department and school) are found to calculate their average rating for learning objects.
After that, the list of learning objects will pass through a demographic base filter which is related to student profile such as student specialization, study year level, faculty and department. Finally, the list will pass through a rule-based filtering which will filter the incoming recommended digital objects upon a set of rules which were put by the system administrator or the students themselves.
In the same context, Khairil Ghauth & Nor Abdullah (2011) propose a new e-learning recommender system framework that uses content-based filtering and good learners’ ratings to recommend learning materials. The research depends on the student profile and achievements in addition to the strategy of good readers to recommend learning objects for the students.
Good readers are those students who completed a course with a mark over 80% by using other learning material and rating them. The researcher depends on those rating to recommend learning materials to other students. The results show a significantly positive impact on the learning outcome of the students by at least 13.8%. The proposed recommender system is prone to the ‘cold start’ problem, in which the system is not able to calculate or predict the good learners’ rating for the items if the good learners’ ratings are unavailable.
6
Tiffany Ya TANG (3002) introduced smart recommendation for an evolving E-Learning system. The system has the ability to find relevant content on the web and then personalize and adapt them based on the system observations of its learners and their accumulated rating.
The system can crawl the web to get new papers and connect these papers with system courses using a “paper maintenance model” which crawl citeseer for new papers. The system cluster learners according to their browsing activities to find out similarities between them. The paper maintenance model add papers when crawling the web and deleting papers according to learners assessment.
Two major techniques were adopted: collaborative filtering and data clustering. There are two kinds of collaboration in the system, one is the collaboration between the system and users; and the other is the collaboration between the system and the open Web.
John Tarus, Niu and Khadidja (2017) proposed a recommendation technique which take into consideration the learner characteristic such as learning style, study level and skill level which can influence the learner’s preferences learning. The recommendation technique combines a collaborative filtering and ontology to recommend personalized learning materials to online learners.
The recommender system used the learner ontology in order to incorporate the characteristic of learners in the recommendation process to achieve better personalization and accuracy in e-learning recommendations. Also, the ontological knowledge is used by the recommender system at the initial stages in the absence of ratings to alleviate the cold-start problem. So, both ratings and ontological knowledge are used in computing similarities and generating recommendations for the learner.
Sunita B Aher and Lobo L.M.R.J. (2012) proposed a course recommender system that uses a combination of machine learning algorithms to identifying the behavior of students interested in a particular set of courses. Different combinations of data mining algorithm like (1)classification & association rule algorithm, (2)clustering & association rule algorithm, (3)association rule mining in classified & clustered data and (4)combining clustering & classification algorithm in association rule algorithms or simply the association rule algorithm.
7
The study looked mainly at the number of students interested in each course in the e-learning system and found out that the combination clustering, classification & association rule algorithm is the best combination.
Maria Gogaa & others (2014) designed a framework of intelligent recommender system which can predict first year student performance and recommend necessary actions for improvement. The study believes that various predictors at various time and different locations contribute to the outcome of students and evidence that students’ background information contribute immensely to the early prediction of student success.
Pensri Amornsinlaphachai (2013) synthesize a learning model using the Student Teams - Achievement Divisions (STAD) technique with a suggestion system according to learners' capability to decrease learners' weakness[2]. the research results in a learning model comprises of 5 modules that are (1) test module, (2) evaluation module, (3) suggestion module, (4) community module and (5) knowledge bank module.
The results derived from experts’ evaluation are disclosed that the model is appropriate to 3 aspects that are (1) learning content, (2) design based on theories and (3) media and technology. Moreover, the experts accept the usability of the model in a high level.
In fact, the architecture of the suggested recommender system in this study is a hybrid of two recommender approaches: Content-based and collaborative filtering. Each approach works separately and gives its own recommended list of learning materials and learning materials weight, the final stage of the recommender system is the ranking model which results in a final recommender list with the items and their final weights ranked from the highest to lowest.
This architecture guarantees that the LRS will keep working even if no history for a course exists (cold start problem), in this case the recommendation will depend mainly on the content base filter whereas the collaborative filtering approach will gain experience with time. On the other hand, the collaborative filtering approach is considered as a main recommender engine whenever a history exists and can give more accurate results and gain more experience with time. The collaborative filtering works mainly on the similarity among students based on their achievement
8
in previous learning outcomes, it suggests best match learning materials - which match active courses- based on previous success stories for similar students.
1.7
Thesis Outline
The thesis in chapter one gives an overview on the research and declares the research motivation, questions, goals, contribution and also gives fast reviews for some studies in the same context. Chapter two gives a small review on the new trends in education and learning theory which concentrates on learning outcomes and their importance in measuring students’ knowledge level. In chapter three some pattern and methodologies in knowledge discovery are highlighted, as they are used in the research, whereas in chapter four a fast review on recommender approaches and recommender engines in e-learning is given.
Chapter five describes the architecture and methodology of the suggested recommender engine and chapter six discusses and analyzes the results. Chapter seven summarizes the research and the research conclusion.
9
Chapter 2
10
2.1 Learning Approaches
Designing learning modules and programs have two approaches: “Teacher-Centered” and “student-centered”. The “Teacher-Centered” approach is considered the traditional way of teaching where teachers decide on the content they intend to teach on the program, and plan how to teach the content in the learning period [16]. Kathly drown (2003) mentioned new challenges facing classroom teachers such as legislative mandates for school renewal, diverse student needs and technological advices, which makes this approach not working for a growing number of diverse, student population.
The “student-centered” approach, which is also referred to as “Outcome Based”, is considered as the new international trends in education. According to the constructive learning theory, learning is defined as “active process in which learners are active sense makers who seek to build coherence and organized Knowledge”. This constructive learning theory acts as the source of developing this new trend of learning [50]. “student-centered” approach focuses on what the students are expected to be able to do at the end of the program or learning period. [16]
Fan Yang and Zheng-hong Dong (2017) in their learning theory of constructivism considered each student as a unique individual with personalized needs, learning styles, learning preferences, knowledge levels, and knowledge backgrounds. Under their learning theory, teaching approaches are designed according to learning outcomes and does not focus on the teacher-centered learning environment. It puts more emphasis on self-paced learning by providing access to education at any time, any place, and taking into account students’ differences.
2.2
Learning Taxonomy
A taxonomy is a classification system which is categorized as shared language that orders things in some way.
Learning taxonomy is defined as a tool which “provides the criteria of assessing student learning performance to see if students can achieve their learning outcomes” [17].
According to ECTS Users’ Guide, learning outcomes are defined as “statements of what the individual knows, understands and is able to do on completion of a learning process” [48]
11
(American Association of Law Libraries) defines learning outcome as “statements that specify what learners will know or be able to do as a result of a learning activity. Outcomes are usually expressed as knowledge, skills or attitudes”.
(University of New South Wales, Australia) defines learning outcomes as “explicit statements of what we want our students to know, understand or be able to do as a result of completing our courses.”
The University of Toronto in its “Developing Learning Outcomes” guide defines learning outcomes as “statements that describe the knowledge or skills students should acquire by the end of a particular assignment, class, course, or program, and help students understand why that knowledge and those skills will be useful to them. They focus on the context and potential applications of knowledge and skills, help students connect learning in various contexts, and help guide assessment and evaluation.”
Learning taxonomy is categorized in three domains: cognitive (thinking), affective (Emption), and psychomotor (kinesthetic). Each domain has a taxonomy associated with it and is divided into several levels, each learning outcome is evaluated by one of these levels. The most common learning taxonomy in cognition domain is Bloom’s taxonomy.
2.2.1
Bloom's taxonomy theory
Bloom’s Taxonomy which is also referred as original Taxonomy “is a classification of the different objectives and skills that educators set for their students (learning objectives)”. It is being increasingly widely used in the design and assessment of learning outcomes, it is a set of three hierarchical models used to classify educational learning objectives into levels of complexity and specificity.
The original levels by Bloom et al. (1956) were ordered as follows: knowledge, comprehension, application, analysis, synthesis, and evaluation as shown in Fig. 2.1.
12
Figure 2. 1: Original Bloom Taxonomy primary level in cognition domain (1956).
Original Bloom Taxonomy proposed that our thinking can be divided into six increasingly complex levels from the simple recall of facts at the lowest level to evaluation at the highest level. The revision of
original Taxonomy was developed in much the same manner in 2000-2001 by Anderson and Krathwohl. One of the major changes that occurred between the old and the newer updated version is that the two highest forms of cognition have been reversed. In the older version the listing from simple to most complex functions was ordered as knowledge, comprehension, application, analysis, synthesis, and evaluation. In the newer version the steps change to verbs and are arranged as knowing, understanding, applying, analyzing, evaluating, and the last and highest function, creating.
–
Figure 2. 2: Revised Taxonomy (2000-2001), Anderson and Krathwohl primary level in cognition domain. Evaluation Synthesis Analysis Application Comprehension Knowledge Create Evaluate Analyze Apply Understand Remember
13
Table (2.1) presents Bloom’s taxonomy levels (1956) and Anderson/Krathwohl levels (2001) with definitions and sample verbs:
Table 2. 1 Bloom’s taxonomy vs Anderson/Krathwohl levels, definitions and verbs
Bloom’s taxonomy Levels – 1956
Level Definition Sample Verbs
Knowledge This level includes behaviors which emphasize remembering either by recognition or recall of ideas, material or phenomena.
Define, write, name, and list.
Comprehension This level includes the ability to translate, comprehend or interpret information
Summarize, describe and explain
Application “To apply something requires "Comprehension" of the method, theory, principle, or abstraction applied.” (1956)[21]
Compute, solve and apply
Analysis “Analysis emphasizes the breakdown of the material into its constituent parts and detection of the relationships of the parts and of the way they are organized.”(1956)[21]
Analyze, compare
Synthesis This level involves a “recombination of parts of previous experiences with new materials, reconstructed into a new and more or less well-integrated whole”.(1956)[21]
Design, create and develop
Evaluation “Evaluation is defined as the making of judgments about the value -for some purpose- of ideas, works, solutions, methods, material, etc.” It involves using criteria and standards. The judgments may be either quantitative or qualitative. .(1956)[21]
Recommend, Judge
Anderson/Krathwohl levels
Level Definition Sample Verbs
Remembering Recognizing or recalling knowledge from memory. Recognizing, Recalling Understanding Constructing meaning from different types of functions
including oral, written, and graphic communication.
Interpreting Comparing
Applying Executing or implementing procedures in a given situation. Executing Implementing Analyze Breaking material into its constituent parts and detecting how
the parts relate to one another and to an overall structure or purpose. [49]
Organizing
Evaluating “Making judgments based on criteria and standards”. [49] Checking Creating “Putting elements together to form a novel, coherent whole or
make an original product” [49]
Generating Producing
14
Example of Learning Outcomes for “Algorithms and Data Structure” course:
By completion of this course, student should be able to:
1. Define basic static and dynamic data structures and relevant standard algorithms for them: stack, queue, dynamically linked lists, trees, graphs, heap, priority queue, hash tables, sorting algorithms and min-max algorithm.
2. Demonstrate advantages and disadvantages of specific algorithms and data structures. 3. Select basic data structures and algorithms for autonomous realization of simple programs
or program parts.
4. Determine and demonstrate bugs in programs and recognize needed basic operations with data structures.
5. Formulate new solutions for programming problems or improve existing code using learned algorithms and data structures.
6. Evaluate algorithms and data structures in terms of time and memory complexity of basic operations.
[Learning outcome for “Data Structures and Algorithms” course designed by lecturer Toma Rončević at university of split
https://www.oss.unist.hr/sites/default/files/dokumenti/courses/information_technology/enDIP_SIT019_Data_Structu res_and_Algorithms.pdf / page 3
2.2.2 Bologna Declaration
The Bologna Declaration was adopted by ministers of education of 29 European countries in Bologna, Italy to formulate the Bologna agreement leading to the setting up of a common European Higher Education Area (EHEA).
The overall aim of the Bologna process is to improve the efficiency and effectiveness of higher education in Europe as well as promote student and staff mobility throughout the EHEA and beyond, which can guarantee the freely movement of students and graduates between countries by using a supplement which describes the qualification the student has received in a standard format that is easy to understand and compare [16] [14].
15
1. “Adoption of a system of easily readable and comparable degrees” which means the using of learning outcomes as a common language which is clear for all institutes, employers and evaluating qualification. [16]
2. Adopt a system with two main cycles (undergraduate/graduate)
3. Establish a system of credits “European Credit Transfer System” (ECTS)
This depends mainly on evaluating the learning outcomes as the user guide declared: “Credits in ECTS can only be obtained after successful completion of the work required and appropriate assessment of the learning outcomes achieved” [48]
4. Promote mobility by overcoming legal recognition and administrative obstacles
5. Promote European cooperation in quality assurance
6. Promote a European dimension in higher education.
2.3
E-Learning and adaptive e-Learning systems
What does e-learning mean? How does it differ from the traditional classroom-based learning? and what benefits it comes with? e-learning is the learning process using electronic technologies or devices (computers, tablets or phones) to access online educational curriculum (course, program or degree) outside of a traditional classroom-based learning. E-learning courses can use verity of techniques such as video, presentation, quizzes, games... etc. [25]
The main benefit of e-learning is that learning becomes accessible for all users around the world as they can select their courses and start to learn at any time during the day with no time restrictions.
In an adaptive e-learning environment, the learning system respond differently based on learner’s needs, style and context. This type of learning is based on the principle that each student is unique and have different background, knowledge level, learning needs, misunderstand and learning outcomes than others.
16
1. Knowledge domain: presents the set of knowledge which will be learned to students 2. Student model: presents the student profile which contains information about the
student’s learning outcomes, knowledge level, preference, learning styles…etc.
3. Tutoring model: presents the intelligence which matches between the students’ needs based on their unique background and the appropriate content in the knowledge domain to minimize the gap between the student and the knowledge and making the process of learning easier.
4. User interface: presents the interaction gate between students and the system. [24] The following diagram shows an adaptive e-learning architecture with its five blocks.
Figure 2. 3:Adaptive e-learning Architecture [24]
2.4 Intelligent Tutoring System
“Intelligent Tutoring Systems (ITS) are computer programs that model learners’ psychological states to provide individualized instructions”. These customized instructions are given without any intervention from teachers. [27]
17
The first ITS program was SCHOLAR, which was designed by the computer scientist Jaime Carbonell in 1969, SCHOLAR was a man-to-machine tutorial system which uses templates and keyword recognition. Its job is to teach students about Latin American geography through inquiries and answers on random topics selected by students.
Another early example of ITS is BIP (1976). BIP was a basic instructional program and interactive problem-solving laboratory. Its main job is to assign programming tasks to students based on student learning needs and competencies.
Wenting Ma, et al. (2014) proposed in their paper, the main tasks of an ITS:
1. ITS is a computer system that performs tutoring functions by answering questions, assigning tasks and offering feedback.
2. Compute student inference and based on that either construct a new multidimensional model for students or allocate them within one of the existing models.
3. Use the student model function to adapt the appropriate tutoring functions.
Eight principles of ITS design and development
Anderson et al. (1987) identified a set of eight principle for designing intelligent computer tutors which can be consulted for successful application of such rules.
1. Identify the goal structure of problem space.
2. Provide instructions in the problem-solving context. 3. Provide immediate feedback on errors.
4. Minimize working memory load.
5. Represent student competence as a production set.
6. Adjust the grain size of instruction according to learning principles.
7. Enable the student to approach the target skill by successive approximation. 8. Promote the use of general problem-solving rules over analogy.
18
Chapter 3
19
Introduction
Knowledge discovery in database “KDD” refers to the process of discovering useful knowledge from data using the high-level application of data mining. Data mining is considered as the core part of knowledge discovery where mathematical analysis is used to drive patterns and trends that exist in data [47].
This chapter introduces a sequential steps and procedures of extracting Knowledge form large sets of structured data, concentrating on those steps and procedures which are used in the methodology in “Chapter Five”. The chapter explain how data mining is used in recommender systems and illustrates different types of sampling followed by choosing one of those sampling methods to be used in the study. It also introduces some data distribution models and show how the e-Learning environment matchs the normal distribution model. Finally, the chapter concentrate on clustering analysis process and five main distance functions as they are used in the methodology, highlighting important methods of finding the best number of clusters and measuring the quality of the resulting clusters.
3.1 Data Mining in Recommender Systems
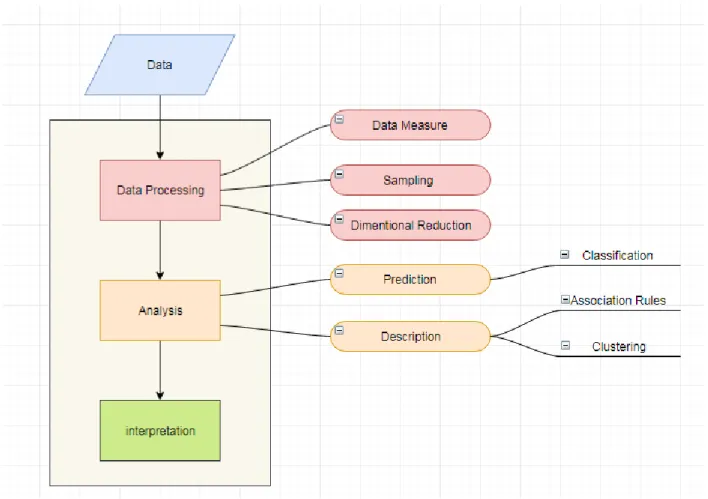
The process of data mining typically consists of three main steps: data preprocessing, data analysis and result interpretation. The data mining methods that are most commonly used in recommender systems are: classification, clustering and association rule discovery.
Figure (3.1) summarizes the main steps in a data mining problem which starts with data processing, analysis and interpretation for results. Data processing include data measures, sampling and dimensional reduction. Analysis could include prediction for future results, making use of current history, supervision data or descriptive and looking for patterns in unsupervised large data set.
20
Figure 3. 1:Main steps and methods of a data mining problem
Data Processing
Data processing is the stage of cleaning, filtering and transforming data to be prepared for the next step of analysis.
3.2 Sampling
Sampling is one of the main techniques in data mining, it is a statistical analysis technique used to select a subset of relevant data from a large dataset in order to identify patterns and trends in the larger dataset. This section discusses some sampling methods in order to choose the appropriate sampling method for the learning environment.
Also, sampling can be done by taking a training dataset which is used for learning and building the analysis model and a testing set to evaluate the created model and its accuracy.
21
An important consideration is the size of the sample set. Sometimes small datasets can tell all about the data, in other cases, increasing the size of dataset can increase the accuracy of the analysis [7]. Sampling method can be classified into two categories: probability sampling and non-probability sampling. In probability sampling there are many methods such as:
1. Simple Random Sampling (SRS) 2. Stratified Sampling
3. Cluster Sampling 4. Systematic Sampling 5. Multistage Sampling
SRS is a statistical model for the selection of a sample contains an n number of sampling units out of the population which have N number of sampling units. In this sampling method, every possible sample of the same size is equally likely to be chosen.
A stratified random sample is obtained by separating the population into mutually exclusive sets where every element in the population is assigned to only one set, or strata, where no elements could be excluded and then drawing simple random samples from each stratum, where samples is taken from all stratum.
Cluster sampling is often used in marketing research in which the total population is divided into groups known as clusters and a simple random sampling is applied on each cluster. The main aim of this type of sampling is to reduce cost and increase efficiency.
Systematic sampling is a statistical model in which the first step is to determine the number of samples “n” to be chosen from the whole population “N”, then every element is selected from the ordered sampling frame where k = N/n.
Multistage Sampling is a complex form of cluster sampling, this type of sampling involves dividing the whole population into clusters and then choosing one or more clusters randomly where each selected cluster is then sampled. For example, dividing a study area into districts followed by choosing random districts, then dividing each district into blocks followed by
22
choosing random number of blocks and finally choosing random samples from the selected blocks.
This research is dealing with students and students' achievements in different learning outcome levels, it is trying to divide students into groups where each student belongs to one group, the members of each group are similar to each other. The target is to find out those students who are similar to the active student and then study their behavior, learning patterns and feedback on learning materials in order to reflect their success learning experience on active students.
As a conclusion, the clusters which includes the active students, are the only clusters which are taken from the whole sets of data as it contains the similar students, based on this the cluster sampling approach is chosen.
3.3 Data Distribution Models
“Things are random” this is a fact about our world. “A random variable is a numerical description of the outcome of an experiment whose value depends on chance” [30]. To design and analyze any experiment, data collection about the phenomena is needed. Good data collection practice involves randomly selecting individuals from the population, or randomly assigning treatments in a controlled experiment.
Probability theory is essential in analyzing human activities which involves quantitative analysis data. It explains how to compute the chance that events will occur based on assumptions about things like the probabilities of the elementary outcomes in the sample space [31]. This section describes briefly some data distribution models for by which to use the appropriate data model for this research which will be discussed in later chapters:
1. Random normal distribution. 2. Poisson distribution.
3. Binomial distribution.
23 Random Normal Distribution:
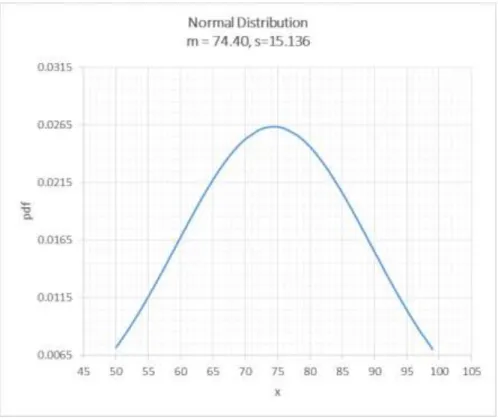
The normal or Gaussian distribution, or the “bell curve”, is based on the assumption that a distribution of values generally clusters around an average. Within the distribution, very high and very low values are still possible, but are less frequent than the ones closer to the average. The probability density function of the normal distribution is:
( |
)
√
( )
Where is the mean distribution, is the standard deviation is the variance.
Figure (3.2) shows the normal distribution of student’s marks with an average of 74.40 and a standard deviation of 15.136:
24 Poisson distribution
Poisson distribution describes the probability of a given number of events “K” occurring in a fixed interval (e.g. time, distance, area or volume). It is an appropriate model when the number of times an event occurs “k” take values: 0, 1, 2, …. and the occurrence of one event does not affect the probability that a second event will occur, where exactly just one event could happen in an instance of time.
The probability of observing k events in an interval is given by the following equation:
P(K event in interval of time) =
Where : average number of events per interval, k: the number of times an event occurs in an
interval.
Figure (3.3) shows Poisson distribution for a set of events with different values for
25 Binomial Distribution
The binomial distribution is used to model a certain number of successes “r” in an “N” independent trials drawn with replacement from a population of size N’.
The probability of one possible way the event can occur is calculated by the equation below: P(Event) = (Number of ways event can occur) * P(One occurrence).
The total number of ways of selecting r distinct combinations of N objects, irrespective of order, is:
( ) (
)
( )
The probability of getting exactly r successes in N trials is given by the probability mass function:
Pr(r;n,p)
=
(
)
( )
26 Discrete Uniformed distribution
Discrete uniform distribution explains finite number of outcomes which are equally likely to happen, it gives its values the same probability to occur. Mathematically this means that the probability density function is identical for a finite set of evenly spaced points.
If there exists n events, each of which have the same probability P(X=x)=1/n; the random variable X follows a discrete uniform distribution and its probability function is:
P(X=x)
=
{
⁄
The cumulative distribution function (CDF) of the discrete uniform distribution can be expressed, for any k ∈ [a,b], as
F(k; a,b) = ⌊ ⌋
Figure (3.5) shows the probability mass function.
27 Conclusion:
The data distribution model used in this research in order to generate student achievements on the level of learning outcome is the random normal distribution which mimics student’s results.
3.4 Distance and Similarity Measures
In this section, a brief overview on various distance similarity measures is discussed as they are used in the research methodology, mainly when applying the k-means on student’s achievements in order to find out similar students. So the first question is: What is similarity and how can it be measured?
Similarity is the measurement that quantifies the dependency between two sequences X and Y where X = { , , , …, } and Y = { , , , …, }, both X and Y are measurements from two objects or phenomena. [34]
A distance function is “a function defined over pairs of data points. The function produces a real (and possibly bounded) value, which measures the distance between the pair of points.”[35]
Distance and similarity measures are very essential in knowledge discovery and recognizing different patterns in data such as in clustering and classification.
3.4.1 Euclidean distance
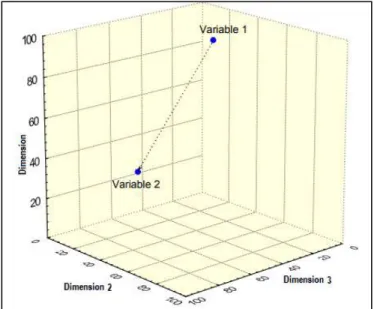
The Euclidean distance or metric is defined to be the straight-line distance between two points in the Euclidean space. In general, for an n-dimensional space, the distance is
d= √∑ ( )
28
Figure 3. 6: The Euclidean Distance between 2 variables in 3-dimensional space
A norm is a function which assign a positive value to vector in the vector space which measures the distance between this it and the zero vector.
An Euclidean norm is the length of the vector X in the n dimensional Euclidean space and measured by:
‖ ‖
=
√∑
(
)
3.4.2 Correlation Distance (or Pearson correlation distance)
Correlation coefficients are used to measure the strength of relationship in statistics, it measures how strong a relationship between two variables is. Pearson’s correlation is a linear correlation coefficient that returns a value between -1 and 1 where +1 means there are a strong positive relationship between two items and -1 means there exists a strong negative relationship and zero denotes that there is no relationship. The following formula calculates the correlation coefficient between two vectors X and Y.
r =
(∑ ) (∑ )(∑ )√[ ∑ (∑ ) ][ ∑ (∑ ) ]
29
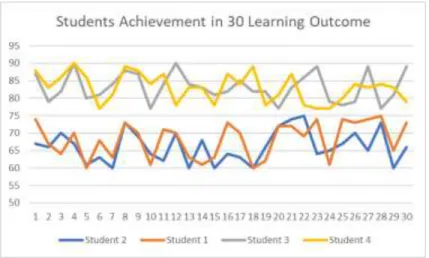
Figure 3. 7: Student’s achievement in 30 learning outcome
From the figure above, it is obvious that student1 and student2 are more similar in their
achievements when compared with student3and student4. when correlation coefficient analysis was applied using excel data analysis, the following results appear as in figure (3.8).
Figure 3. 8: Correlation coefficients between students using data analysis in excel
The figure above shows that there exists a negative correlation between student 1 and 2 with a correlation of 0.472 and positive correlation of 0.312 between student 3 and 4.
when applying the distance correlation analysis using R the following results appear:
Figure 3. 9:Correlation distance between students using R wherecorrelation distance is compliment for Correlation coefficient
30
Figure (3.9) shows that “student 1” is more similar to “student 2” where the correlation distance between them is 0.499 which is the minimum among other students and so it is the shortest distance, in the same time the minimum distance is found between “students 4” and “student 3” and equals to 0.8909 which also denotes that they are both more similar.
3.4.3 Jaccard Similarity Coefficient (Index)
Jaccard coefficient (Index) measures the number of shared members in two vectors and gives a result that has a range between 0 and 100% for which the higher the percentage is, the more the items are similar. Jaccard distance is the complement of Jaccard index where it measures the value of dissimilarity between two vectors.
Equation calculates jaccard Index between two vectors X and Y.
J(X,Y)=|X∩Y|/|XUY|
The following example shows the analysis for the same four students’ marks in the previous section using Jaccard distance. Student’s achievement in each learning outcome is classified as A,B,C,D to make the probability of intersection between marks higher and so giving more accurate similarity calculation.
The example uses the proxy library in R to summarize student’s achievement and find Jaccard distance.
31
Figure 3. 11: Similarity between students based on Jaccard distance
Figure 3.10 shows student achievement summary, counting student achievement in each level, where A indicates that the mark is above 90, B indicates that the mark is between 80 and 90, C indicates that the mark is between 70 and 80 and finally D indicates that the mark is between 60 and 70.
Figure 3.11 calculate the Jaccard distance between students based on the mentioned levels where higher opportunity for intersection is found.
Jaccard distance is recalculated on the same set of students but this time on their achievement as a numerical number from 50 to 100.
Figure 3. 12: Similarity based on Jaccard distance
Figure 3.12 also shows that the distance between student1 and student2 is the minimum which indicate that they are more similar to each other’s, as well as student3 and student4.
3.4.4 Cosine Similarity
Cosine similarity is widely used in data mining, recommendation systems and information retrieval. The cosine of 0 is one, so whenever an angle between two vectors is zero this means they are the same, the smaller the angle between two vectors the more similar they are. Cosine similarity between two non-zero vectors X and Y is represented as:
Similarity = cos(θ)
=
‖ ‖ ‖ ‖
=
∑
32
The red line in figure (3.13) represents Euclidean distance between the two vectors which represent two students student 1 and student 2, the distance d is equals to
d=
√(
)
(
)
Figure 3. 13:Two-dimensional illustration of Euclidean distances between two points
Figure (3.14) shows the cosine similarity between the same set of students, the analysis also shows that student 1 is more similar to student 2, whereas Student 3 is more similar to student 4, where the distance between them were shown to be the shortest.
Figure 3. 14: Cosine similarity between a set of four students
3.4.5 Manhattan (or City-Block) Distance
Manhattan distance measures the shortest distance between two points xi and xj that one would be required to walk if a city is laid out in square blocks (“city blocks”).
This distance is defined by:
33
The matrix bellow shows the Manhattan distance between the four students’ achievements where the shortest distance is found between student1 and student2 which indicates that they are more similar when compared with the two others, and between student4 and student3 which also indicates that they are more similar.
Figure 3. 15: Manhattan distance between four students using R
From the matrix above, it’s obvious that student 1 &2 is more similar to each other when comparing them with the two other students as Manhattan distance between them is the shortest with a distance of 132. For the same reason, student 3 is more similar to student 4 where the distance is 165.
Figure (3.16) illustrates the city-block distances between two dimensional points where the Manhattan distance is measured as |90-60|+|85-75| = 40.
Figure 3. 16:Two-dimensional illustration of city-block distances between two points
34
3.5.1 Cluster Analysis
Clustering analysis is an unsupervised learning method, in which each item (vector) is assigned to a group. Items in the same group are more similar than items in other groups. Similarity between items is measured using distance, where the goal of clustering algorithm is to minimize the distance in each cluster and to increase the distance between clusters. Clustering analysis is best fit when speaking about big dimensionality of features. [7]
Clusters could be distinguished by their various type: (1) they could be partitioned or hierarchized (nested), (2) made exclusive where each item is assigned to a single cluster or fuzzy where each item belong to a cluster with a weighted membership. (3) Partial or complete, where in complete clusters, each item in the population must belong to a cluster. [32]
3.5.2 K-means Algorithm
“The aim of the K-means algorithm is to divide M points in N dimensions into K clusters so that the within-cluster sum of squares is minimized.” [36]
K-means clustering is a type of unsupervised learning where the methods goal is to group observations into a specific number of disjoint clusters “k”, where “k” refers to the number of clusters specified. The results of applying K-means clustering on a data set is: (1) a set of cluster centroids where each centroid is a collection of features that defines the cluster. (2) Each observation in the dataset is labeled to a cluster.
There are various distance measures used to determine to which cluster each observation will be appended, where the cluster algorithm aims to minimize the distance between the centroid and the observation.
Figure (3.17) shows the basic k-means algorithm steps, which starts with initial estimates for the Κ centroids either by random selection from the data or randomly generated. The algorithm then iterates between two steps shown in lines three and four in which: (1) each observation is assigned to the cluster of the nearest centroid (2) centroid s are recomputed by taking the mean for all points in the same cluster. Finally, the algorithm exits when centroids don’t change.
35
Figure 3. 17: Basic k-means algorithm steps
The most commonly used implementation of k-means clustering is the one which tries to find the partition of the n individuals into k groups that minimizes the within-group sum of squares (WGSS) over all variables, it is computed as:
WGSS =
∑
∑ ∑
(
̅̅̅̅̅)
( )“Where denotes the set of ni individuals in the ith group and where x(l) j = 1 ni P i∈Gl xij is the mean of the individuals in group Gl on variable j”[37]
Figure 3.18 represents a matrix of two hundred students’ marks achieved in 30 learning outcomes (
..
), each row in the matrix represents one student, each column represents a learning outcome and each entry represents the student’s mark in the learning outcome.
36
Figure 3. 18: 200 hundred student marks in 30 learning outcomes represented in R
Figure (3.19) represents the scatterplot matrix for
![Figure 2. 3:Adaptive e-learning Architecture [24]](https://thumb-us.123doks.com/thumbv2/123dok_us/619457.2574283/33.918.110.786.409.678/figure-adaptive-e-learning-architecture.webp)