UC Santa Barbara Electronic Theses and Dissertations
TitleVisualization Authoring for Data-driven Storytelling Permalink https://escholarship.org/uc/item/1ks25661 Author Ren, Donghao Publication Date 2019 Peer reviewed|Thesis/dissertation
Visualization Authoring for Data-driven Storytelling
A dissertation submitted in partial satisfaction of the requirements for the degree
Doctor of Philosophy in Computer Science by Donghao Ren Committee in charge:
Professor Tobias Höllerer, Chair Professor Matthew Turk
Professor George Legrady Doctor Bongshin Lee
Professor Matthew Turk
Professor George Legrady
Doctor Bongshin Lee
Professor Tobias Höllerer, Committee Chair
Copyright © 2019 by
TO
My Beloved Grandmother and Grandfather,
Guifen Liu and Tiesheng Ren.
First, I would like to express my special appreciation and thanks to my advisor Prof. Tobias Höllerer for mentoring me throughout the Ph.D. program. Tobias was always encouraging. His advice on both research and my career have been priceless. I would also like to thank my committee member Dr. Bongshin Lee, who offered me multiple internships at Microsoft Research and gave me invaluable guidance on visualization and general human-computer interaction. I also want to thank my committee member Prof. Matthew Turk who gave me helpful comments and feedback, and Prof. George Legrady who helped my development on aesthetics and visual language.
I am very much thankful to my collaborators Matthew Brehmer, Eun Kyoung Choe, Nathalie Henry Riche, Tibor Goldschwendt, and Yun-Suk Chang. This dissertation would not have been possible without their wonderful work.
I would also like to thank my undergraduate advisor Prof. Xiaoru Yuan who intro-duced me to the area of information visualization and guided me through several projects; and my mentor Saleema Amershi who introduced me to the field of interactive machine learning.
During my years at UCSB, I had the privilege to work with the AlloSphere research fa-cility, a unique research instrument. I would like to thank Prof. JoAnn Kuchera-Morin, Dr. Andrés Cabrera, and Dr. Matthew Wright for their help and support with the AlloSphere. I would like to thank my labmates. I received continued help and support from Ehsan Sayyad, Byungkyu (Jay) Kang, Peter Zhe Fu, James Schaffer, Brandon Huynh, Sikun Lin, Yi Ding, Adam Ibrahim, Christopher Hall, Benjamin Nuernberger, Kuo-Chin Lien, and Domagoj Baričević. I would also like to thank my friends at the Media Arts and Technology program, including Jieliang (Rodger) Luo, Jing Yan, Lu Liu, Han-Wei Kung, You-Jin Kim, Weidi Zhang, and Xiaoci Wu.
Rui Zhu, Shunyao Li, Bohan Li, Mengqian Liu, Bozhou Men, and Qingyun Liu.
Finally, thanks are also due to the following funding agencies: U.S. Army Research Office under MURI grant W911NF-09-1-0553; the Office of Naval Research (ONR) un-der contract N00014-14-1-0133, N00014-16-1-3002, and DURIP Instrumentation Grant N00014-13-1-0872; and National Science Foundation (NSF) under grant IIS-1748392.
Education
2013 – 2019 Ph.D. in Computer Science, University of California, Santa Barbara
2009 – 2013 B.S. in Intelligence Science and Technology, Peking University
Research Experience
2013 – 2019 Research Assistant, University of California, Santa Barbara
Summer 2017 Research Intern, Microsoft Research, Redmond
Summer 2016 Research Intern, Microsoft Research, Redmond
Summer 2015 Research Intern, Microsoft Research, Redmond
Teaching Experience
Fall 2013 UCSB CS8 – Introduction to Computer Science
Fall 2017 UCSB CS184 – Introduction to Mobile Application Development
Publications
InfoVis’18 Donghao Ren, Bongshin Lee, and Matthew Brehmer,Charticulator:
In-teractive Construction of Bespoke Chart Layouts, IEEE Transactions on
Visualization and Computer Graphics (InfoVis’18), 25 (1), 2019
3Best Paper Honorable Mention Award
BELIV’18 Donghao Ren, Bongshin Lee, Matthew Brehmer, and Nathalie Henry
Riche,Reflecting on the Evaluation of Visualization Authoring Systems,
in Proceedings of BELIV 2018: Evaluation and Beyond — Methodological Approaches for Visualization
VRST’18 Donghao Ren, Bongshin Lee, and Tobias Höllerer,XRCreator: Interactive
Construction of Immersive Data-driven Stories,in Proceedings of the 24th
ACM Symposium on Virtual Reality Software and Technology (VRST’18) (Poster)
Presence’18 Renate Häuslschmid,Donghao Ren, Florian Alt, Andreas Butz, and
To-bias Höllerer,Personalizing Content Presentation on Large 3D Head-Up
Displays,PRESENCE: Virtual and Augmented Reality, 27 (1), 80–106, 2019
PacificVis’17 Donghao Ren, Matthew Brehmer, Bongshin Lee, Tobias Höllerer, and
Eun Kyoung Choe,ChartAccent: Annotation for Data-Driven Storytelling,
and Transparent GPU Support for Information Visualization Rendering, Computer Graphics Forum (EuroVis’17), 36 (3), 179–188, 2017
VINCI’17 Jieliang Luo,Donghao Ren, and George Legrady,Anamorphic fluid:
Ex-ploring spatial organization and movements of images in a simulated fluid
environment,in Proceedings of the 10th International Symposium on Visual
Information Communication and Interaction, 2017
VAST’16 Donghao Ren, Saleema Amershi, Bongshin Lee, Jina Suh, and Jason D.
Williams,Squares: Supporting Interactive Performance Analysis for
Multi-class Classifiers,IEEE Transactions on Visualization and Computer
Graph-ics (VAST’16), 23 (1), 61–70, 2017
VR’16 Donghao Ren, Tibor Goldschwendt, Yun Suk Chang, and Tobias Höllerer,
Evaluating Wide-Field-of-View Augmented Reality with Mixed Reality Sim-ulation,in Proceedings of IEEE Virtual Reality (VR’16), 2016
InfoVis’14 Donghao Ren, Tobias Höllerer, and Xiaoru Yuan,iVisDesigner:
Expres-sive Interactive Design of Information Visualizations,IEEE Transactions
on Visualization and Computer Graphics (InfoVis’14), 20 (12), 2092–2101, 2014
PacificVis’14 Donghao Ren, Xin Zhang, Zhenhuang Wang, Jing Li, and Xiaoru Yuan,
WeiboEvents: A Crowd Sourcing Weibo Visual Analytic System,in
Pro-ceedings of IEEE Pacific Visualization Symposium (PacificVis’14) Notes, Yokohama, Japan, 2014
VAST’14 Xiaoru Yuan, Zhenhuang Wang, Zipeng Liu, Cong Guo, Hongwei Ai,
andDonghao Ren,Visualization of Social Media Flows with Interactively
Identified Key Players,in Proceedings of the IEEE Conference on Visual
Analytics Science and Technology (VAST’14) (Poster), 291–292, 2014
InfoVis’13 Xiaoru Yuan,Donghao Ren, Zuchao Wang, and Cong Guo,Dimension
Projection Matrix / Tree: Interactive Subspace Visual Exploration and
Anal-ysis of High Dimensional Data,IEEE Transactions on Visualization and
Visualization Authoring for Data-driven Storytelling by
Donghao Ren
Data-driven storytelling is the process of communicating insights and findings that are supported by data, forming a visualization-based narrative. However, most current visualization creation tools either only support fixed sets of designs or require an in-depth understanding of programming concepts. To enable non-programmers to create custom visualizations for data-driven storytelling, we design interactions and implement user interfaces for visualization authoring. In the first part of this dissertation, we in-troduce and evaluate a series of three visualization authoring tools using traditional user interfaces: (1) iVisDesigner, which uses a data-flow model and enables users to author visualizations by specifying mappings from data to graphics interactively; (2) ChartAccent, a tool for annotating a given visualization; and (3) Charticulator, which allows users to design custom layouts interactively. We then reflect on the evaluation of visualization authoring user interfaces. In the second part of the dissertation, we ex-tend our approach to multiple presentation media or display environments, including traditional 2-dimensional screens, large projection-based virtual-reality (VR) systems, and head-mounted virtual/augmented reality displays (HMDs). To leverage such immer-sive visualization environments, we ported and extended the iVisDesigner authoring approach to projection-based virtual reality. To facilitate the development of immersive visualizations, we built a visualization library called Stardust, which provides a famil-iar API to utilize GPU processing power in a cross-platform way. Finally, we present Idyll-MR, a system for authoring data-driven stories in virtual and augmented reality.
usability, and performance, as well as portability across platforms. In summary, our con-tributions enable larger audiences to create visual data-driven stories using different presentation media, leading to an overall enriched diversity of visualization designs.
Curriculum Vitae vii
Abstract ix
1 Introduction 1
1.1 Motivation . . . 1
1.2 Outline . . . 4
1.3 Contributions and Impact . . . 5
1.4 Permissions and Attributions . . . 6
2 Related Work 8 2.1 Data-driven Storytelling . . . 9
2.2 Visualization Authoring Systems and Toolkits . . . 10
2.3 Constraint-based Authoring . . . 19
2.4 InfoVis. in Immersive Environments . . . 20
Part I
Interactive Visualization Authoring (Canvas-Based)
26
3 iVisDesigner: Interactive Design of Information Visualizations 30 3.1 Introduction . . . 30 3.2 Design Philosophy . . . 34 3.3 Design . . . 34 3.4 Implementation . . . 47 3.5 Example Applications . . . 49 3.6 Evaluation . . . 54 3.7 Discussion . . . 59 3.8 Conclusion . . . 604 ChartAccent: Authoring Annotation for Data-Driven Storytelling 62 4.1 Introduction . . . 62
4.4 Evaluation: Reproduction Study . . . 79
4.5 Discussion and Future Work . . . 87
4.6 Conclusion . . . 91
5 Charticulator: Interactive Construction of Bespoke Chart Layouts 93 5.1 Introduction . . . 93
5.2 Charticulator . . . 96
5.3 Evaluation . . . 113
5.4 Discussion and Future Work . . . 118
5.5 Conclusion . . . 123
Part II
Visualization Authoring for Immersive Environments
124
6 A Simple Authoring System for Immersive Visualization 127 6.1 Introduction . . . 1276.2 Visualization Placement . . . 128
6.3 Visualization Linking . . . 129
6.4 Integration with Virtual Environments . . . 130
6.5 Stereo Modes . . . 131
6.6 Mixed Reality Simulation . . . 133
6.7 Implementation Details . . . 137
7 Stardust: A Library for Cross-Platform GPU-based Visualization 140 7.1 Introduction . . . 140
7.2 Stardust Design . . . 144
7.3 Architecture and Implementation . . . 148
7.4 Examples . . . 153
7.5 Performance Evaluation . . . 157
7.6 Discussion and Future Work . . . 160
7.7 Conclusion . . . 163
8 Idyll-MR: Declarative Authoring of Immersive Data-driven Stories 164 8.1 Introduction . . . 164
8.2 Design of Idyll-MR . . . 166
8.3 Examples . . . 178
8.4 Limitations and Future Work . . . 183
9 Reflecting on the Evaluation of Visualization Authoring Systems 188
9.1 Introduction . . . 188
9.2 Challenges . . . 190
9.3 Reflection on Existing Approaches . . . 192
9.4 Opportunities . . . 201
9.5 Conclusion . . . 207
10 Discussion and Future Work 209 10.1 Expressivity vs. Learnability . . . 209
10.2 Reusability and Interoperability . . . 211
10.3 Dynamic, Interactive, and Animated Visualizations . . . 213
10.4 Immersive Visualization Authoring User Interfaces . . . 214
10.5 Beyond Visualization Authoring . . . 215
10.6 Deployment of Visualization Authoring Tools . . . 217
11 Conclusions 219
Chapter 1
Introduction
1.1
Motivation
Data-driven storytelling is the process of communicating insights and findings that are supported by data. Visualizations play an important role in data-driven storytelling. Highly customized visual representations of data that are tailored to the specific purposes and insights increases the effectiveness of communication. Currently, most visualization creation tools either only support fixed sets of designs or require an in-depth understand-ing of programmunderstand-ing concepts. To enable non-programmers to create custom visualiza-tions for data-driven storytelling, we design interacvisualiza-tions, implement user interfaces, and develop programming libraries for visualization authoring.
Before discussing the visualization authoring tools, we first introduce the basic con-cepts of information visualization, visual analytics, data-driven storytelling, and visual-ization authoring.
Information Visualization Information visualization is the study of visual
computer-supported, interactive, visual representations of abstract data to amplify cognition.“ Well-designed visualization shows data in meaningful ways and allows readers to gain insights. In this dissertation, unless specified otherwise, we also use word “chart” to refer to a data visualization.
There are two primary purposes of information visualization: analytics and presen-tation, as discussed below.
Visualization for Analytics Visual analytics a field that focus on facilitating analytical reasoning through the use of interactive visual interfaces [2]. Typically, a visual analytic user interface makes heavy use of visualization techniques, interaction paradigms such as linked views and dynamic queries, as well as data mining algorithms.
Visualization for Presentation Visualizations can also be used for presentation pur-poses. They are increasingly used among practitioners to tell stories that are supported by data. Researchers have explored the scope of visual data stories [3] or narrative
visu-alizations [4]. In this dissertation, we follow Leeet al.[3]’s scope ofvisual data stories:
a visual data story consists of a set of story pieces (findings or insights) that are sup-ported by data; most of these pieces are visualized with appropriate annotation (e.g., labels, pointers) or narration (e.g., text) to clearly convey the message; and finally, these pieces are connected together in a meaningful way (spatial or temporal order) to support
the overall presentation goal. The practice ofdata-driven storytelling is the act of using
visual data stories for presentation. This dissertation focuses on designing visualizations for presentation purposes.
Visualization Authoring While visualizations are very useful for analytics and presen-tation, it is not easy to design and implement them. We use the term “visualization author-ing” to denote the act of constructing information visualizations from data. Visualization
authoring can be done by drawing, programming, or using visualization construction tools [5]. Drawing visualizations, either on paper or using a computer-based drawing tool, is a tedious task because visualizations often contain many graphical elements (consider a scatterplot of a thousand points). On the other hand, programming a visualization re-quires the understanding of computer science concepts such as variables, functions, and loops. While visualization libraries (e.g., ProtoVis [6] and D3 [7]) can drastically reduce the complexity of a visualization program, understanding the concepts in these libraries such as data mapping and selection still requires considerable programming experience. Visualization construction tools do not require programming. However, most existing tools (e.g., Microsoft Excel) only support a fixed set of templates which prevent the design of novel visualizations. More powerful tools, such as Lyra [8], are often hard to learn. The primary focus of this dissertation is the design, implementation, and evaluation of visualization authoring tools.
Visualization in Virtual and Augmented Reality Virtual reality (VR) uses various dis-play systems such as head-mounted disdis-plays (HMDs), projection-based environments (e.g., CAVEs) combined with computer graphics to generate virtual environments. Aug-mented reality (AR), instead of creating a purely virtual environment, augment the real world with virtual content. VR/AR displays constitute a promising medium for informa-tion visualizainforma-tion because of the vastly available workspace (much more extensive than regular screens or even grids of regular screens), and the ability to display 3D objects and draw connections between objects (virtual and virtual, virtual and real, or real and real) in the workspace. Most current visualization authoring tools work on desktop environ-ments and design 2D visualizations. In the second part of this dissertation, we explore visualization authoring for virtual and augmented reality environments.
Thesis Statement
A wide variety of information visualizations can be constructed with well-designed interactive interfaces without resorting to programming, thus pro-viding a creative toolbox for data-driven storytelling. Authoring tools can also ease the cross-platform creation and deployment of visualizations, enabling data-driven storytelling in immersive environments.
1.2
Outline
We attempt to prove the first part of this statement by designing, implementing, and evaluating multiple interactive visualization authoring tools. We address the second part by extending the tools we created to virtual and augmented reality and develop a system to facilitate the authoring of immersive data-driven visual stories.
This dissertation consists of three parts. In the first part, we address the problem of visualization authoring in desktop environments. We introduce a series of three visual-ization construction tools including iVisDesigner (Chapter 3), ChartAccent (Chapter 4), and Charticulator (Chapter 5). iVisDesigner allows users to construct visualizations by specifying data mappings and transformations in its user interface. ChartAccent focuses primarily on creating annotations on existing visualizations. Charticulator helps users specify custom layouts, and improves upon existing systems to support the creation of a large set of visualization designs without programming.
In the second part, we look into the authoring of visualizations in immersive environ-ments including virtual and augmented reality (VR and AR). First, we propose a simple tool for creating immersive visualizations (Chapter 6), which was subsequently used in a user study that evaluates the effect of field of view (FOV) on the comprehension of
wide-field-of-view linked visualizations [9]. Then, we design a new visualization library called Stardust that allows users to write cross-medium visualization code in JavaScript (Chap-ter 7). Finally, we bring all the pieces together by building a new tool called Idyll-MR for immersive data-driven storytelling using visualizations and other graphical components (Chapter 8).
The third part concludes this dissertation by reflecting on the evaluation of visual-ization authoring systems, discussing the issues and limitations of current work, and presenting directions for future research.
1.3
Contributions and Impact
This dissertation makes the following contributions:
• New systems for interactively authoring (iVisDesigner and Charticulator) and an-notating (ChartAccent) visualization, and evaluations of these systems by demon-strating the range of afforded designs and usability studies. In addition, we present a study of current annotation practice, and reflect on methods for evaluating for interactive visualization authoring systems.
• A scalable programming API and library (Stardust) for cross-platform visualization authoring, with its evaluation by efficiency measurements and demonstrations of supported platforms.
• A system for authoring immersive visual data-driven stories (Idyll-MR), and eval-uations of the system through a demonstration of the range of afforded designs. We have released iVisDesigner, ChartAccent, Stardust, and Charticulator to the public. The tools themselves will help the community of visualization designers, journalists, or
even the general public to communicate data better through custom bespoke visualization designs. We hope that our work will provide more visualization design possibilities for a broad audience.
1.4
Permissions and Attributions
1. The content of Chapter 3 is the result of a collaboration with Tobias Höllerer and Xiaoru Yuan. © 2014 IEEE. Reprinted, with permission from Donghao Ren, Tobias
Höllerer, and Xiaoru Yuan,iVisDesigner: Expressive interactive design of information
visualizations,IEEE Transactions on Visualization and Computer Graphics[10], Nov.
2014.
2. The content of Chapter 4 is the result of a collaboration with Matthew Brehmer, Bongshin Lee, Eun Kyoung Choe, and Tobias Höllerer. © 2017 IEEE. Reprinted, with permission from Donghao Ren, Matthew Brehmer, Bongshin Lee, Eun Kyoung
Choe, and Tobias Höllerer,ChartAccent: Annotation for data-driven storytelling,
Proceedings of IEEE Pacific Visualization Symposium (PacificVis)[11], Apr. 2017.
3. The content of Chapter 5 is the result of a collaboration with Bongshin Lee and Matthew Brehmer. © 2018 IEEE. Reprinted, with permission from Donghao Ren,
Bongshin Lee, and Matthew Brehmer,Charticulator: Interactive construction of
be-spoke chart layouts,IEEE Transactions on Visualization and Computer Graphics[12],
Aug. 2018.
4. The content of Chapter 7 is the result of a collaboration with Bongshin Lee and
Tobias Höllerer, and has previously appeared inComputer Graphics Forum[13]. ©
Sons Ltd. Published by John Wiley & Sons Ltd. Reprinted, with permission from the authors and the publisher.
5. The content of Chapter 9 is the result of a collaboration with Bongshin Lee, Matthew
Brehmer, and Nathalie Henry Riche, and has previously appeared inProceedings
of BELIV 2018: Evaluation and Beyond – Methodological Approaches for
Visualiza-tion[14]. Reprinted, with permissions from the authors.
Although I am the first author of all these previously published papers, the research presented in this dissertation is a result of close collaboration with my advisor Tobias Höllerer and co-authors including Bongshin Lee, Matthew Brehmer, Eun Kyoung Choe, and Nathalie Henry Riche.
Related Work
This work builds on top of a rich research landscape of information visualization frame-works, toolkits, systems, as well as the understanding of virtual and augmented reality. We begin our review of related work by discussing influential theoretical background on information visualization and data-driven storytelling. We then give an overview on visualization programming frameworks and interactive visualization construction tools, annotation support, as well as visualization systems and user studies in immersive environments.
Information visualization is the study of visual representations of data. S. Card et
al.[1] define information visualization as“the use of computer-supported, interactive, visual
representations of abstract data to amplify cognition.“ Any expressive system facilitating
flexible mappings of data to visual variables owes a lot to the semiological research of Bertin [15, 16]. Mackinlay [17] provided further foundation and presented automated tools for powerful modular visualization design. Shneiderman [18] analyzed the data
types and tasks in information visualization, and presented a taxonomy for them. Cardet
al.[19] organized previous visualization designs, and presented categorization of data
or analytical purposes. In this dissertation, we primarily focus on visualizations for pre-sentation purposes. This leads to the following discussion about data-driven storytelling.
2.1
Data-driven Storytelling
Visual data-driven storytelling often involves the use of information visualization techniques to support or complement a written or spoken narrative. Segel and Heer [4]
refer to this form of storytelling asnarrative visualization, and in their proposed design
space of narrative visualization, they indicate the importance of textual and graphical annotation as well as visual highlighting. Kosara and Mackinlay [20] have emphasized the importance of annotation and highlighting in visual data-driven storytelling, particularly
in the context of live presentations. In an effort to scope visual data stories, Leeet al.[3]
emphasize the need of the intended message in stories and the role of written explanations or annotations that help the viewer capture the message. They also identify that, to make it easier to tell data-driven stories, it is useful to support the easy creation of custom
annotations through direct manipulation and reuse of existing story elements. Stolperet
al.[21] identify seven common annotation techniques used to communicate narrative and
explain data in popular data-driven stories. In addition, Choeet al.[22] provide empirical
evidence of the important role of annotation through an analysis of the design choices used in live presentations by self-tracking enthusiasts or “quantified selfers.” Hullman and Diakopoulos [23] consider annotation to be one of the four editorial layers in this genre of storytelling, alongside the layers of data, visual representation, and interactivity; and while there are certainly a number of tools and techniques that address these other
layers, support for the annotation layer remains underdeveloped. Boyet al.[24] studied
the engagement factor in data-driven storytelling; Maet al.[25] explored storytelling in
Our work is informed by prior research on visualization theories and models, as well as research on data-driven storytelling. In our demonstrations and evaluations of iVis-Designer and Charticulator, we highlight its coverage of the information visualization design space. To guide our design of ChartAccent, we conduct a survey of current anno-tation practices and summarized the findings as a design space of annoanno-tations. We use Leeet al.[3]’s scope of visual data stories to guide the design of Idyll-MR.
2.2
Visualization Authoring Systems and Toolkits
There is a variety of existing interactive tools and programming frameworks for visualization authoring. In this section we discuss the related programming frameworks and languages, interactive visualization authoring tools for visualization authoring. We also discuss frameworks and tools for data-driven storytelling purposes.
2.2.1
Programming Frameworks and Languages
There is a large collection of programming frameworks, and languages for simplifying visualization programming.
Programming toolkits General-purpose drawing APIs such as OpenGL, HTML5 Can-vas, and Processing [26] define programming interfaces to draw low-level elements. Even for experienced programmers, it is a tedious process to create visualizations with these APIs. Thus, visualization frameworks have been created for better abstraction. The
Info-Vis Toolkit [27] and Improvise [28] provide a set of basic widgets. Chiet al.[29] proposed
a spreadsheet approach. “behaviorism” [30] uses three graphs to represent dynamic visu-alizations. To create novel designs, users need to create new widgets or inherit existing
transforms abstract data into visualizable form by a filtering process, and renders the
visualizable form by using aviewprocess. It allows for advanced integration of existing
operators to create novel techniques, but typically users will need to define new operators in the process.
Declarative models and languages Declarative models and languages for information visualization have been presented, including the Grammar of Graphics and its implemen-tation ggplot in R [33, 34]. ProtoVis [35, 6] provides a declarative language for information
visualization, designed and implemented in Java and JavaScript. Bostocket al.designed
D3.js [7], a JavaScript library for creating web-based visualization designs. It facilitates the manipulation of DOM elements with data. Vega [36] employs a reactive data-flow model and support visualization by adding a variety of support modules, such as scales and layout transformations. Vega-Lite [37] is a high-level declarative language that com-piles to Vega. All of these programming frameworks require users to write computer programs or formal specifications to create visualization designs.
GPU-based visualization rendering GPU-based rendering has been widely used in scientific visualization tools. For instance, GPUs are used for accelerating volume ren-dering [38], particle and glyph renren-dering [39]. The Visualization Toolkit [40] uses GPUs extensively for scientific visualizations. However, most of these techniques are limited to data that has existing 2D/3D spatial structures. Customization of visual encoding and data binding is limited to the domain of usage. Our work focuses on information visual-ization where there can be a wide variety of visual mapping and encoding, and existing spatial representations are not guaranteed to exist.
For information visualization, several research projects recently utilized GPUs for accelerating visualizations. For example, SplatterJs [41] provides extensive support for
scatterplots with WebGL rendering techniques and the FluidDiagrams [42] system im-plements bar charts, line charts, parallel coordinates, and cone tree visualizations [43]. SandDance [44] uses WebGL to efficiently render instance-based visualizations for large datasets and enable smooth transitions between layouts. imMens [45] uses the GPU for efficient data transformation and rendering, but it does not allow customization of GPU-rendered graphical marks. GPU acceleration has also been successfully applied for edge bundling [46]. These visualizations are custom-made, and thus developers of such systems have to write GPU shaders, convert data to buffers, and execute rendering commands. They also provide fixed sets of visualization templates or modules instead of providing developers flexibility in creating their own visualizations.
While GPU-based techniques can significantly improve performance, they are chal-lenging to implement and thus not accessible to developers without expertise in the computer graphics pipeline and shader programming. While compilers (e.g., Sh [47] and Brook [48]) can make GPU acceleration accessible through common programming lan-guages such as C/C++, they are not designed to support information visualizations. In Chapter 7, we present Stardust. It provides visualization developers a simple and familiar programming interface to leverage GPU processing power. We anticipate that developers with D3 expertise could easily adopt Stardust.
2.2.2
Interactive Visualization Authoring Tools
Both the research community and the industry have explored the space of interactive visualization authoring tools. These tools aims at enabling non-programmers to construct information visualizations.
General-purpose graphics tools General-purpose vector graphics software, such as Inkscape and Adobe Illustrator, is widely used for graphical design, and we drew some
inspiration for our user interface from such products. While it is possible to create vi-sualizations with general-purpose design tools, they are not specifically designed for creating visualizations. For example, there is no support for parameterizable mapping from data to graphics and non-trivial layouts. Graphical items have to be constructed and positioned individually.
In the following paragraphs we discuss different approaches for interactive visu-alization construction user interfaces. Our discussion follows the categorization from Grammel et al.’s survey [49] of visualization construction user interfaces.
Dataflow systems Dataflow-based systems, such as ConMan [50], AVS [51], IRIS Ex-plorer [52], and VisTrails [53] use a pipelined approach and flow diagrams to represent the progress from data to visualization. These systems are particularly good at defin-ing data transformations, but not very flexible for defindefin-ing interlinked mappdefin-ings from data to graphical elements. In addition, pipeline-based systems focus on representing the pipeline itself, there is little screen estate left for displaying and editing the visualizations. Our work provides an integrated representation and manipulation of graphical mappings, with all graphical elements created, presented and edited in the same canvas which dom-inates the user interface, allowing for better understanding of the overall visualization design.
Template editors A lot of commercial software has the functionality to interactively create visualization designs for data, for example the chart feature in Microsoft Excel and similar spreadsheet software, various chart creation tools such as Plot.ly [54], Chart-Blocks [55], RAWGraphs [56], and Quadrigram [57]. Many web-based systems, for in-stance ManyEyes [58], Sense.us [59], or CommentSpace [60], include visualization cre-ation user interfaces to support parts of their workflow. Although some of these systems
provide richer sets of customizable options, they all follow the template editor approach. In this approach, the author selects data and chooses a predefined visualization template (e.g., bar chart, line chart, etc.), and then configures the template by adjusting its options in a panel. This widely used approach clearly lacks expressivity — users are unable to create custom visualizations that are not covered by the set of tempaltes.
Shelf-configuration Shelf-configuration [49] is an alternative approach to template editors. In such user interfaces, an author maps data attributes to encoding channels of marks, such as x, y, color, size, and shape. The system synthesize the visualization based on its internal rules. For instance, to create a scatterplot, the author chooses the circle mark type, and maps two numerical data attributes to the x and y encoding channel. To color the scatterplot by a third categorical data attribute, the author maps the data attribute to the color encoding channel. Tableau Desktop [61] is a highly sophisticated state-of-the-art commercial visualization system following the shelf-configuration method. It provides good flexibility for visualization designs. While the shelf-configuration approach offers more expressivity, it still lacks fine-grained control and flexible combination or layout of graphical elements.
Visual builders Visual builders take a lower-level approach. In such user interfaces, authors can manipulate basic graphical elements, bind data to them, and configure their
appearances. For multivariate data, Claessenet al.[62] allow users to position axes and
put scatterplots and links between them interactively. However, it only supports mul-tivariate data and axis-based visualization designs. Sketch-based interactions, like in SketchStory [63] and SketchInsight [64] have been explored. While sketch-based interac-tions are very intuitive, these systems currently only support a very limited set of designs. Bret Victor presented a tool [5] that allows users to define drawing procedures with
geo-metrical constraints, which are parametrized in an interactive canvas. It requires procedu-ral thinking, where users define loops to draw simple visualizations such as a scatterplot. In Chapter 3, we present iVisDesigner, which uses a declarative approach, where loops
are defined implicitly bydata selectors. SageBrush [65] uses “partial prototypes” to define
spatial properties for “graphemes”, and supports editing of primitive properties. iVis-Designer expands on this theme by enabling data transformation and generation, and supporting interaction with designed visualizations. Lyra [8] is a very recent addition to the interactive visualization design landscape. Based on the JSON-based declarative visualization grammar Vega [66], it allows users to define visualizations interactively by constructing scales, guides and marks. Sophisticated layouts and transformations are enabled via transformation pipelines. Lyra and Vega only operate on tabular datasets, while our work iVisDesigner also supports hierarchical datasets with a fixed schema and references between data items. Lyra is more oriented towards designing a single piece of visualization, while our system focuses on canvases that allow users to draw and link different designs. Furthermore, iVisDesigner supports designing basic interactions such as brushing and linking. To ease the creation of marks from data items, Data Illustra-tor [67] uses a repetition and partition operaIllustra-tor for multiplying marks. However, the repetition and partition grid can handle only simple layouts such as grid and horizontal and vertical stacking, and these layouts only work with primitive shapes. To create lay-outs with a complex glyph, chart creators have to manually overlay multiple groups of marks that are individually laid out. VisComposer [68] combines visual programming, textual programming, direct manipulation, and surrogate objects for chart creation. Dif-ferent visual encoding design choices can be arranged in a scene graph editor to create complex charts. However, VisComposer supports only a fixed set of compositions and requires programming to create additional visual encodings. In Chapter 5, we present Charticulator, which prioritizes layout as a deliberate design choice. With multiple levels
of partial layout specifications, chart creators can construct a wide range of chart layouts. Charticulator also supports layouts incorporating several alternative coordinate systems. Furthermore, Charticulator allows chart creators to export their designs into reusable chart templates which can then be imported into other visualization systems such as Microsoft Power BI (Figure 5.9).
2.2.3
Frameworks and Tools for Data-driven Storytelling
Beyond authoring a single visualization, there are multiple tools to support the driven storytelling practice. For example, Ellipsis [69] supports the easy creation of data-driven stories by combining programming and the configuration of annotations, param-eters, and scenes. DataClips [70] supports the authoring of data-driven videos. Timeline Storyteller [71] enables people to author and present expressive data-driven stories with time-based data (e.g., sequences of events).
Annotation support Here we have a specific look into annotations because they are critical to data-driven storytelling. Many contemporary visualization tools provide lim-ited annotation support, particularly in the domain of business intelligence [72]. Anno-tation functionality also features prominently in tools intended for collaborative visual analysis, such as ManyEyes [58], sense.us [59], and CommentSpace [60], as the ability to annotate a chart allows people to share their insights with others. In the following, we give further consideration to tools that support data-driven or data-aware annotation, and to annotation support in interactive visualization authoring tools.
In the context of visualization, annotation can mean more than the mere addition of textual and graphical elements to an existing chart. Annotation functionality can be implemented in such a way that annotations are aware of the data being visualized. Heer and Shneiderman’s refer to “data-aware annotations” [73], or graphical and textual
elements that appear in response to the interactive selection and brushing of visual marks that correspond to data [74]. This concept is realized in Click2Annotate [75] and Touch2Annotate [76], in which the semi-automated annotation of data items is facilitated
via simple direct manipulation interactions. In a prototype tool by Heeret al.[74], a set
of annotations for data items can appear in response to query criteria as well as selection and brushing interactions, and their tool decides which annotations to show based upon a relevance ranking.
Kandogan [77] introduced the concept of just-in-time annotation, in which a chart
is automatically annotated as a person interacts with it. Similarly, Bryan et al.[78]
in-troduced an approach for automatically annotating charts depicting time-oriented data during interactive exploration based on visual salience and significant features in the data. Altogether, these data-driven approaches certainly eliminate the tedium of manu-ally annotating data items in a chart, though it could also be argued that these approaches take too much control away from the person using the system: they neither provide full control over which data items are annotated, nor do they provide control over the form or content of these annotations. Moreover, these approaches are predominantly geared toward data analysis tasks, and while many annotations in the context of visualization do correspond with specific data-bound graphical elements, every annotation in a chart should not be required to directly reference the underlying data. In Chapter 4, we present ChartAccent, which focuses more on the task of augmenting a chart for communication, combining both data-driven and manual annotation. With ChartAccent, we provide more freedom in terms of deciding which items get annotated and in terms of the form and con-tent of these annotations, leveraging a data-driven approach when needed. Finally, while data-aware annotations that are triggered by interactive selection certainly fall under our purview, we do not wish to downplay the importance of static (i.e., non-interactive) forms of annotation when presenting a chart to an audience. This view is reflected by
The New York Times’ deputy graphics director Archie Tse, who recently argued that the
best form of visual storytelling is oftenstatic[79].
Many recent interactive visualization authoring environments or visualization con-struction interfaces [49, 80] attempt to balance simplicity with an expressive range of vi-sual encoding choices. However, they generally lack a support for annotation — especially data-driven annotation. With general-purpose chart authoring tools such as those of-fered in Microsoft Excel, chart authors are limited to selecting individual items or data series and modifying their visual encoding; data-driven operations such as selecting and annotating data items within a particular value range, for example, are not supported. As a result, an author will typically create a chart with a tool such as Excel and subse-quently export it to a graphical editing tool such as Adobe Creative Suite to manually add annotations [81, 82], and in doing so awareness of the underlying data is lost.
Recent interactive visualization authoring tools such as Lyra [8] and our work iVis-Designer are more expressive than general-purpose tools like Excel in terms of visual encoding design choices. Although authors can create data-driven annotations with these tools, their learning curve is significant, and the annotation process is particularly tedious. We also draw inspiration from Mr. Chartmaker [83], the interactive charting
tool used internally atThe New York Times, which provides some data-driven annotation
support via direct manipulation and selection of individual data items; we build upon these capabilities in ChartAccent by introducing data-driven selections in addition to annotation via manual selection.
Tableau Desktop [61] also provides several options for annotating charts, some of which overlap with ChartAccent. For example, Tableau allows a person to add trend lines to a chart, and text annotations of marks in Tableau can be data-driven, referencing marks’ underlying data attributes. However, ChartAccent goes beyond Tableau in various aspects. In Tableau, three annotation targets are explicitly denoted when interacting with
a chart: ax,y point, a rectangulararea, or any selectedmark(s). With ChartAccent, we
consider a wider set of annotation targets informed by our survey of 106 annotated charts, including both one- and two-dimensional ranges and other targets listed in Section 4.2.2. In addition, highlighting marks in ChartAccent is simpler and more flexible than Tableau, without requiring explicit set creation; selected marks can be highlighted directly without affecting unselected marks.
It is certainly possible to author a chart with precise control over annotation using visualization programming libraries and packages such as ggplot2 [34] or D3.js [7], or us-ing libraries specific to data-driven annotation and labellus-ing such as swoopyDrag.js [84] or labella.js [85], or by using the Hanpuku D3-Illustrator bridge tool [82]. With ggplot2 in particular, chart authors can add sophisticated data-driven annotations such as trend lines or annotations relying upon more complex statistical models. However, although these approaches offer precise control, they require programming skills and can only provide asynchronous feedback to the author; with ChartAccent, we opt for an inter-active visualization authoring environment that requires no specialized programming knowledge and provides instant feedback to the author.
2.3
Constraint-based Authoring
Prior work has incorporated mathematical constraints for designing user interfaces, diagrams, and some forms of graphs. An early example is ThingLab [86], which involves connecting geometrical objects (e.g., lines, points) using constraints via mouse and key-board interactions. Later, Fogarty and Hudson created the GADGET toolkit [87] to incor-porate numerical optimization for user interface systems. Beyond research prototypes, the Android development ecosystem recently introduced ConstraintLayout [88] as an option to specify widget positioning in user interfaces: an interactive constraint editor
in Android Studio facilitates constraint authoring by allowing developers to specify con-straints via drag-and-drop interactions. However, these existing interactive constraint-based authoring approaches only support a fixed set of objects or widgets.
Constraint-based approaches have also been applied to data visualization. GLIDE [89]
is a constraint-based graph visualization system that allows people to specifyvisual
orga-nization features such as symmetry, alignment, or clustering, whereupon these features
are translated to geometrical constraints. Delaunay [90] supports similar constraints for visualizing hierarchical data. The TRIP system [91] employs a constraint-based
ap-proach for visualization and animation, where the constraints are specified as a visual
structure representation in Prolog. These existing approaches either focus on graph or
tree visualizations, or they use programming languages for constraint specification. With Charticulator, we set out to enable the creation of bespoke charts without programming, so we investigated ways to efficiently specify common layout constraints via a set of well-designed user interactions and by incorporating data binding into these constraints.
2.4
InfoVis. in Immersive Environments
The second part of this dissertation is about visualization authoring for immersive environments. In this section, we discuss the related work on this topic.
2.4.1
Understanding Immersive Factors
It is important to consider the results of previous experiments on immersion fac-tors [92], as they can provide valuable hints for designing information presentations in VR/AR experiments. In this thesis we mainly consider the factor of field of view (FOV), which is critical for visualizations that attempt to utilite a vast virtual space and connect data together through visual links. Arthur [93] studied the effects of FOV on task
perfor-mance and participant comfort. Covelliet al.[94] experimented FOV in pilot performance
in flight training scenarios. Joneset al.[95] found that in medium-field VR, peripheral
vision is an important source of information for the calibration of movements. Raganet
al.[96] examined the effects of varying FOV in terms of a visual scanning task as part of
virtual reality training. Higher field of view led to better training performance. The
re-sults generally indicate that higher FOV leads to better performance. However, Knappet
al.[97] found that limited FOV of HMDs is not the cause of distance underestimation in
VR. Ballet al.[98] showed that the opportunity for physical navigation is more important
than increased FOV for display walls.
Tracking artifacts including latency and jitter are also of research interest in virtual
reality. Venturaet al. [99] studied the effects of tracker reliability and field of view on
a target following task using an HMD as the simulator. This study examined the same overall types of immersion parameters as our work here, but wide-FOV AR was not con-sidered, as the maximum FOV was limited by the simulator HMD, and tracking artifacts were limited to interruptions of varying length. A low FOV proved detrimental to user
performance, as did prolonged sensor dropout periods. Buker et al. [100] studied the
effect of latency on a see-through HMD and determined that simulator sickness could be reduced by predictive tracking compensation.
Our understanding of FOV in AR is still limited [101]. Researchers have explored the
effect of field of view with actual AR prototype devices. Van Nguyenet al.[102] developed
a wide FOV AR display. Using a similar setup, Kishishitaet al.found that a distribution
of annotations in the peripheral vision decreases target discovery rate [101], and task-performance differences between in-view and in-situ annotations become smaller as the FOV approaches 100 degrees and beyond [103]. Although they explored wide FOVs, their annotations are relatively small and point-based, compared to what we used in our experiment.
Conducting AR user studies is challenging. With AR technology still far from a stan-dardized technology, display devices suffer from low resolution, low field of view, latency, improper occlusion, and other perceptual problems [104]; the capabilities of devices dif-fer a lot from one to another, and many AR immersion parameters are currently not achievable, especially in the mobile AR domain [105].
Usability evaluations in AR have been performed regarding questions of perception, performance and collaboration [106] using a range of evaluation techniques [107, 108]. In our experiment, we employ objective measurements on task time, correctness and head movement speed, subjective measurements from pre- and post-study questionnaires and informal feedback from participants.
There are currently no commercial solutions yet for truly wide FOV mobile AR, even though it has been the focus of both academic and industrial research [109, 110, 111]. Likewise, low latency and high-precision tracking is still a challenging problem, particularly for mobile AR. Impressive progress has been made at some cost of hardware bulk and expense [112].
Immersive Visualization Researchers have also recently developed tools specifically to help people create more expressive chart designs (e.g., Data-Driven Guides [113], Lyra [8], Data Illustrator [67], InfoNice [114], Charticulator [12]) or easily augment charts with manual and data-driven annotations (ChartAccent [11]). However, these authoring systems are designed for traditional desktop environments. While several immersive data-driven visualization systems have been demonstrated by now [115, 116, 117] and
Isenberget al.recently discussed opportunities and challenges for immersion in visual
data-driven stories, there has been limited research on how to facilitate the creation of immersive data-driven stories [118].
exploration. Donaleket al.[119] designed a system for collaborative immersive visualiza-tion with basic visualizavisualiza-tions for scientific data. ViSTA Widgets [120] provides reusable building blocks for 3D user interfaces. ImAxes [121] enables people to explore multivari-ate data by manipulating axes in a virtual environment and exploring the visualizations
that emerge from various combinations of axes. Leet al. [122] proposed a system that
supports distributed (involving remote users) creative collaboration. DXR [116] enables both interaction of and programmatic construction of 2D/3D visualizations in Unity us-ing a declarative framework inspired by Vega-Lite [37]. IATK [117] allows a Unity user to create complex linked visualizations in immersive environments, however, it doesn’t yet provide direct support for collaboration or constructs for data-driven storytelling. Dataspace [123] enables a hybrid immersive analytics scenario, but it does not support authoring extensively.
Researcher have also conducted empirical studies to compare different techniques
designed for immersive data analytics. For example, Cordeilet al.[124] compared
HMD-and CAVE-style virtual reality in network analysis. Bach et al. [125] compared three
visualization environments — a desktop with mouse & keyboard against the tangible input with Microsoft HoloLens and with a handheld tablet — with 3D scatterplots for four
tasks. Yang et al., [126] reported three studies conducted to compare different spatial
encodings of global flow networks for immersive analysis. Dataspace [123] enables a hybrid immersive analytics scenario, but it does not support authoring extensively.
Although many tools exist to support the authoring of data-driven stories or im-mersive analytics, to our knowledge, currently none of the existing authoring systems support the creation of immersive data-driven stories.
Similarly, there is a paucity of systems that allow for cross-platform authoring of data visualizations or data stories. Our system, Idyll-MR, enables authors to create data-driven visualizations and stories that can be experienced on different conventional and
immersive platforms: web, virtual reality, and augmented reality. Authoring can also occur on any of these platforms, or, for best usability, on a combination of platforms, and even by a collaborative team of authors with different media competences.
2.4.2
Rendering in Immersive Environments
Researchers have explored large display walls [127] and immersive environments such as CAVEs [128]. The growth of virtual and augmented reality suggests a stronger need for supporting a wide variety of display environments, and efficient rendering is of particular importance in these environments. Although more research is needed to understand when 3D and 2D visualizations are preferable in these environments, enabling more designers to support them can facilitate the exploration of the design space and thus improve our understanding about it.
There are many libraries, frameworks, and engines that support rendering in Virtual Reality (VR) and Augmented Reality (AR), such as FreeVR [129], OpenSG [130], Process-ing [26], TechViz [131], Unreal Engine [132], and Unity Game Engine [133]. However, there is little support for building complex information visualizations. Developers have
to manually map data items to graphical marks. In a recent demo, Leet al.introduced
b3.js [134], which supports bar charts, scatterplots, and surface plots in VR displays such as the Oculus Rift. However, it only supports a fixed set of visualizations, and depends on many other libraries. Stardust, in contrast, focuses on solving the data binding problem. It does not provide a set of predefined visualizations, but exposes an easy-to-use API for specifying and manipulating GPU-rendered marks.
Different display environments have different ways of content rendering. For example, some stereoscopic displays employ tilted view frustums; full-surround spherical displays use Omnistereo [135]. We designed the Stardust’s core API to be platform-independent
thus allowing developers to customize the platform-dependent part. In our current ver-sion, we provide support for WebGL in normal 2D, 3D, and WebVR. By integrating with its rendering library, Stardust visualizations also can be rendered in the AlloSphere [136], a full-surround spherical multi-projector display environment. With these display en-vironments we have supported, we demonstrate a web-based coding playground that allows developers to create visualizations using Stardust and run them without modifi-cation in multiple display environments including WebGL, Cardboard, HTC Vive, and the AlloSphere.
Interactive Visualization Authoring
(Canvas-Based)
of three interactive visualization authoring tools including iVisDesigner, ChartAccent, and Charticulator. The three tools focus on three important aspects of visualization authoring for data-driven storytelling: data mapping, annotation, and layout, respectively.
iVisDesigner We first present iVisDesigner, a web-based user interface that enables users to interactively design information visualizations for heterogeneous datasets with-out the need for textual programming. iVisDesigner uses a data-flow framework to repre-sent the visualization design. The user maps data items to graphical elements by choosing a data collection, and (optionally) specify filters in a property panel. Attribute mappings are specified in the property panel and a style panel. iVisDesigner also supports com-monly used transformations, such as aggregation, formula-based data transformation, force-directed graph layout. These transformations are represented as nodes in the data-flow graph and exposed as extra data items and/or attributes which can be mapped to graphical attributes. Finally, iVisDesigner also enables a visualization designer to cre-ate end-user interactions such as range selection and item dragging. We demonstrcre-ate iVisDesigner’s expressiveness through a set of example visualizations, and evaluate its usability with user evaluation.
ChartAccent iVisDesigner is a tool for visualization construction. However, simply presenting raw charts is not sufficient for data-driven storytelling because the presenter also needs to create annotations, such as arrows and highlights to direct attention, num-bering to facilitate the narrative, and value lines, texts, and images to provide contextual information. In Chapter 4, we first conduct a survey about current annotation practice. Based on the resulting design space of annotations, we design ChartAccent, a tool to an-notate existing charts. We demonstrate ChartAccent’s effectiveness by presenting usage
reproduce annotations with ChartAccent.
Charticulator iVisDesigner and similar tools such as Lyra [8] use a data-flow model which enforces a uni-directional mapping from data to graphics. This model well captures
the traditional concept of visual mappings, such as mapping data tox,y,width,height
values. However, data mapping alone cannot directly represent a wide range of charts. Layout transformations are often required. For example, in a basic horizontal bar chart,
we need to figure out the widths andxpositions of the bars. The usual way is to specify
layout computations such as xi = left +i × (width + step). More complex formulas
will be required to support multi-column bar charts, stacked bar charts, or full-width stacked bar charts. Data-flow systems often resort to layout transformation modules, each module performs a specific layout. In Chapter 5, we present a new tool called Charticulator, which focus on designing expressive layouts. Charticulator transforms a chart specification into mathematical layout constraints and automatically computes a set of layout attributes using a constraint-solving algorithm to realize the chart. It allows for the articulation of compound marks or glyphs as well as links between these glyphs, all without requiring any coding or knowledge of constraint satisfaction. Furthermore, thanks to the constraint-based layout approach, Charticulator can export chart designs into reusable templates that can be imported into other visualization tools. In addition to describing Charticulator’s conceptual framework and design, we present three forms of evaluation: a gallery to illustrate its expressiveness, a user study to verify its usability, and a click-count comparison between Charticulator and three existing tools. Finally, we discuss the limitations and potentials of Charticulator as well as directions for future research.
actions), and allow for many visualizations that are not possible or very tedious to create with iVisDesigner. In addition, it is theoretically possible to use Charticulator output as input to ChartAccent.
iVisDesigner: Interactive Design of
Information Visualizations
3.1
Introduction
Programming frameworks for information visualization such as Prefuse [31], Proto-Vis [35] or D3.js [7] provide very useful abstractions for visualization designs that make programming easier and more elegant. Frameworks can utilize existing programming languages, such as JavaScript in the case of D3.js, or new programming languages, as in the case of Processing. However, they all require textual programming, which limits use to a population of coders, or otherwise imposes a fairly steep learning curve. Most of these frameworks require iterating back and forth between programming and execution stage, and thus adjustment of parameters can be cumbersome.
On the other hand, some information visualization toolkits support interactive ways
The contents of this chapter have been previously published inIEEE Transactions on Visualization
and Computer Graphics. © 2014 IEEE. Reprinted, with permission from Donghao Ren, Tobias Höllerer, and
Xiaoru Yuan,iVisDesigner: Expressive interactive design of information visualizations,IEEE Transactions on
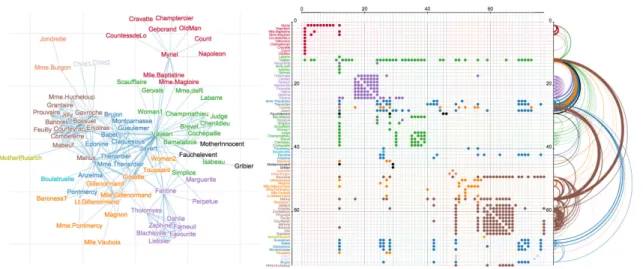
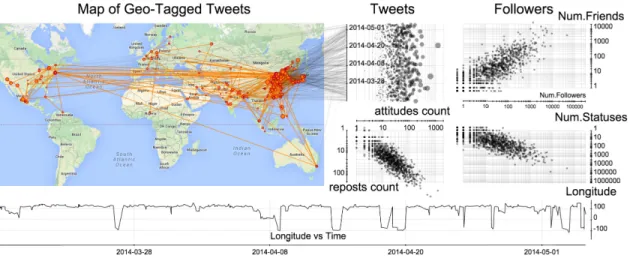
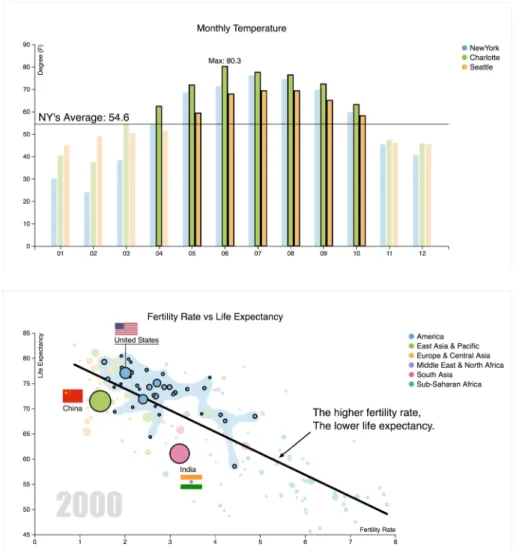
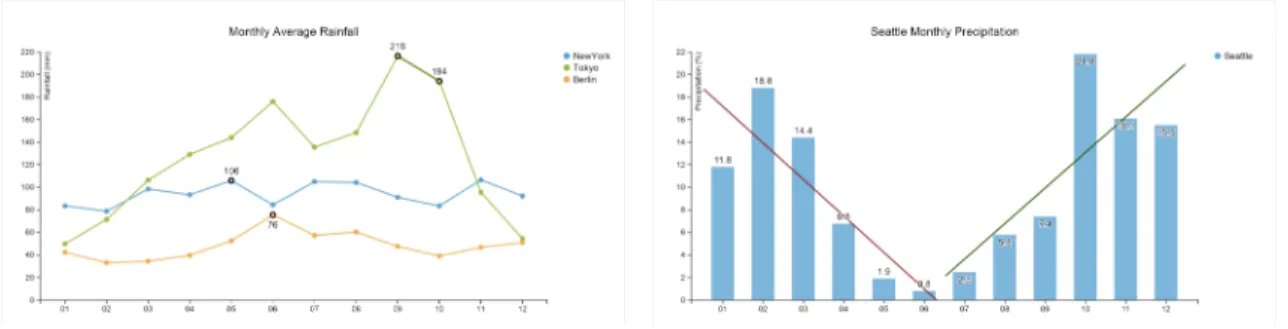
(1) Beijing Air Pollution Dataset (2) Friends of a Weibo User (3) Server Monitoring Data
(6) Parametric Plot (5) Geospatial Data from Tweets
(4) Parallel Coordinates
Figure 3.1: Example visualization designs created in iVisDesigner.
of creating visual designs [49], from early pipeline-based systems [51] to more unified approaches [62, 137, 8]. These systems are easy to use, and generally offer a What You See Is What You Get editing experience, which greatly assists parameter tuning. However, compared to textual programming, they are generally less expressive. For example, the Flexible Linked Axes toolkit [62], which inspired parts of our visualization functionality, only covers axis-based designs for multidimensional data visualization, arguably a small portion of the whole design space. There is a need for highly flexible toolkits that support a wide spectrum of visualization designs.
In this chapter, we present iVisDesigner, a web-based system that enables users to design information visualizations for heterogeneous datasets interactively, without the need for textual programming. Compared with other approaches such as Flexible Linked Axes [62] and Gold [138], and commercial software such as Microsoft Excel and Tableau, iVisDesigner focuses on expressiveness and modular visualization design flexibility, cov-ering a wider range of the information visualization design space.
Expressiveness in iVisDesigner is supported by its underlying framework and user interaction provisions. The framework utilizes a flexible internal representation of visu-alization designs, which is carefully exposed in a unified user interface. Users specify designs via a mouse or pen-based user interface in a web browser, utilizing drag and drop, sketching, and context menu elements. The system supports visual analytics tasks, such as brushing and linking, and visualization customizations, both during visualization design and interactive exploration of data in completed designs. Users can embed the designed visualizations into existing websites or web-based applications by inserting a piece of JavaScript provided by iVisDesigner.
The main contribution of this work is an expressive framework to represent visual-ization designs for different types of data, allowing users to interactively arrange visual elements in different ways, combining and linking different types of visualizations. We discuss our design decisions, implementation choices, as well as system limitations, and demonstrate the expressiveness of our system by presenting a variety of example appli-cations on different types of datasets. We provide evaluation of our system in form of a performance analysis and an informal user study. Our prototype system exhibits high expressiveness compared with existing systems, while maintaining good performance and usability.
The chapter is organized as follows: We first present the design of the framework and user interaction, followed by notable implementation details. Next we discuss example applications to exemplify coverage of the information visualization design space. We then present system evaluation in the form of performance measurements and an informal user study. Finally, we discuss overall results and limitations.
(1) Menu Bar (3) Schema Panel (2) T ools Panel (5) Style Panel (4) Objects Panel (6) Pr operty Panel (7) Canvas Figur e 3.2: The interface of iVisDesigner .(1) Menu Bar: Commands for loading or saving visualization designs, vie w settings, login and logout. (2) T ools Panel: T ools for mo ving obje cts ar ound, cr eating ne w obje cts and changing the vie w .Gr oup ed into differ ent categories. (3) Schema Panel: Sho ws the structur e of the dataset. Allo ws sele ction. (4) Obje cts Panel: Sho ws the obje cts curr ently in the visualization design. Allo ws sele ction. (5) Style Panel: A djust graphical styles for curr ently sele cte d obje cts. (6) Pr op erty Panel: A djust pr op erties of curr ently sele cte d obje cts. (7) The canvas to draw the visualization. In this example ,a visualization of Beijing Air Pollution data is pr esente d. Ther e ar e tw o linke d vie ws, the left vie w sho ws the timeline plots of PM2.5 inde xes for each measur ement station on top of a map ,the right plots sho ws the tr ends of the PM2.5 inde xes, wind str ength, temp eratur e and humidity .This visualization is designe d solely thr ough user interaction with iVisDesigner , without te xtual pr ogramming.
3.2
Design Philosophy
The framework of iVisDesigner is designed to represent visualizations that support interactive user manipulation, all within a web-based interface and canvas. The high-level design choices of iVisDesigner are based on the following idea: Allowing for interactive visualization creation, editing and interaction in an unified interface, where the space is dominated by a canvas showing the emerging visualization. We focus on enabling users to freely place graphical elements and links between them, instead of simply designing a chart or template visualization.
Our overall approach can be characterized as introducing support for data influx and manipulation to the common usage paradigm of interactive vector-based drawing soft-ware. By allowing users to define mappings from data to graphical elements, we enable them to directly create and manipulate groups of elements simultaneously, which tremen-dously reduces the amount of work to create visualizations. Transformed, aggregated, or otherwise generated data can be attached to the dataset, providing more capabilities, such as histograms and graph layouts. Graphical elements can be manipulated via drag-ging and brushing, which affects the underlying data attributes, enabling the design of interactive visualizations.
3.3
Design
In this section, we present the workflow and design details of iVisDesigner. We first give an overview of our framework, which is designed to represent visualizations, render them, and allow users to manipulate them interactively. We then discuss our user interface design, explaining how users can create and edit the different components.
Data Enumeration/
Decomposition Mapping
Mapping
Reference/Linking
Attached Data
Aggregation, Layout, etc
Graphics
User Manipulation
Objects (Circle, Axis, Scatter, etc) Data Selector
Generators
Modify Data by Inverse Mapping
Data Representation
Data Source
User Interaction
Figure 3.3: The framework of iVisDesigner. Data is first being enumerated by user-de-fined data selectors, and then passed to different mapping objects. These objects may refer to each other, and finally generate the graphics or attach generated data back to the data representation. Users can also manipulate the graphics, and modify the underlying data if permitted.
3.3.1
Framework
The framework of our system is illustrated in Figure 3.3. Data is loaded from the Data Source, transformed into an internal representation, and then enumerated or
de-composed into individual elements by variousData Selectors. The decomposed elements
are then passed intoObjectsfor visual mapping or data generation. For visual mapping,
the resulting graphical elements are simply rendered on the canvas. For data generation, the results are additional data attributes (e.g., a histogram) that can be attached back to the data representation. In addition, users can create and attach new data from scratch, for example, creating a range of integers from 1 to 100 for numbering purposes. Multiple mappings and transformations can co-exist in the same visualization, and can refer to each other.
Our data representation is based on a hierarchical model similar to JSON, but allows for references among objects. Each data items is a set of key-value pairs. A value can be a single data item, an array of data items, a primitive value (number or string), or a
reference to another data item. The structure of the dataset is defined by a fixedSchema, which stores a definition of the data structure. This requires the items in a single array
to be homogeneous,i.e., they must be of the same type and structure. This ensures that
we can perform mappings from each array of objects to graphical elements in a unified way. Given that the arrays in a given dataset are homogeneous, it is easy to construct a schema for a dataset automatically.
This dataset definition is relatively more expressive than tabular structures. For ex-ample, in Figure 3.2, the depicted dataset contains a set of air-probing stations, each with a set of measurements, which are visualized individually on the map, and collectively on the timeline plot. Users can place small visualization designs for inner-level data within a larger plot.
Users can createattached databy creating special objects in the system. These can,
for example, compute basic statistics or run a force-directed layout algorithm.
Data Selectors, which are automatically created from user interaction, are used to select a set of data items or values from the dataset. While Data Selectors are created via the UI (e.g., by clicking on an entry of the Schema panel or selecting from a dropdown menu in the Property panel), they also do have a syntax (string representation), where [array] means an enumeration of all the elements in the array, and field means a particular field from the current object. The Data Selectors can be specified in a path-like
manner, joined by “:”. For example,[cars]:acceleration means an enumeration of
all (sayn) cars in the dataset, taking the value of the acceleration field for each, resulting
in an array ofnnumbers.
Reference fields can also be selected with the Data Selectors. For example, the selector [edges]:&sourcewill select the source nodes for the edges in a graph (nodes are stored
in a separate array), and[edges]:&source:valuewill select thevalueattributes of the
Axis1 (MPG) Axis2 (Displacement) Scatter1 (MPG) Circles1 (Cars) Axis2 Scatter Circles Cars Axis1 Data Graphics (1) Basic Scatterplot
(2) Scatterplot with Parallel Coordinates
AxisN Curves Cars Axis1 Data Graphics ... Color Mapping
Figure 3.4: Two basic visualization designs: (1) Scatterplot (2) SPPC, as in [139]. The scatterplot consists of twoAxes, aScatter and aCirclesobject, withAxesandScatter
objects providing location information for theCirclesobject, which maps cars to circles.
A visualization consists o


![Figure 3.4: Two basic visualization designs: (1) Scatterplot (2) SPPC, as in [139]. The scatterplot consists of two Axes, a Scatter and a Circles object, with Axes and Scatter objects providing location information for the Circles object, which maps cars t](https://thumb-us.123doks.com/thumbv2/123dok_us/629961.2575885/51.918.189.727.157.538/visualization-scatterplot-scatterplot-consists-scatter-circles-providing-information.webp)