1
HEALTH ECONOMICS RESEARCH GROUP (HERG)
BRUNEL UNIVERSITY
Current Use and Potential
Value of Cost-effectiveness
Analysis in U.S. Health Care:
The Case of Medicare National
Coverage Determinations
A thesis submitted to Brunel University for the
degree of Doctor of Philosophy
James D. Chambers
2
Preface
Acknowledgments
I am extremely grateful to my supervisors, Professor Martin Buxton and Dr. Joanne Lord for their attentive supervision, guidance and encouragement throughout the development of this thesis. I am also grateful to Professor Stephen Morris who provided supervision throughout the early part of my study. I feel very fortunate to have had the opportunity to work with each one of them and their guidance and advice has been truly invaluable.
To my Mother and Father, I owe you a debt of gratitude that I can never hope to repay. Without your sacrifice and unwavering support I could not have contemplated pursuing a PhD. I would like to dedicate this thesis to you.
I am fortunate to work at the Center for the Evaluation of Value and Risk in Health (CEVR) at Tufts Medical Center in Boston. I am particularly grateful to Dr. Peter Neumann who has been hugely supportive and has allowed me the flexibility to continue my studies. Also, I owe Sarah Bliss, a colleague at CEVR, thanks for reviewing a draft of my thesis.
3
Published and presented work
Parts of the empirical aspect of this thesis have been published and presented. In 2010 a paper was published in Medical Decision Making pertaining to the research presented in Chapter 5. The citation is as follows:
Chambers JD, Neumann PJ, Buxton MJ. Does Medicare have an implicit cost-effectiveness threshold? Med Decis Making. 2010 Jul-Aug;30(4):E14-27. Epub 2010 Jun 15.
In October, 2011, I received confirmation that a paper related to the empirical work presented in Chapter 6 submitted was accepted for publication in Medical Care. The provisional citation is as follows
Chambers JD, Morris S, Neumann PJ, Buxton MJ. Factors Predicting Medicare National Coverage: An Empirical Analysis. Medical Care. Accepted October, 2011
I presented parts of the empirical work presented in Chapter 7 at the International Society for Pharmacoeconomics and Outcomes Research (ISPOR) meeting in Baltimore in 2011. The citation for this presentation is as follows:
Chambers JD, Cohen JT, Neumann PJ, Lord J, Buxton MJ. Using
Cost-Effectiveness Information to Allocate Medicare Resources – How Much Health for the Money? ISPOR 16th Annual International Meeting, Baltimore May 24th, 2011. Podium presentation
4
Role of the Center for the Evaluation of Value and Risk in Health at Tufts Medical Center
Included in the research presented in Chapter 6, was a variable taken from the Tufts Medical Center National Coverage Determinations (NCD) Database. This variable pertained to an assessment of the clinical evidence presented in each NCD. I was not involved in the data collection process for this variable. All other research presented in Chapter 6 is my own.
This research presented in Chapter 7 was conducted as part of a larger project performed at the Center for the Evaluation of Value and Risk in Health (CEVR) at Tufts Medical Center in Boston. The broader study considered all interventions available to Medicare beneficiaries, not limited to those pertaining to NCDs, and was funded by the
Commonwealth Fund. My role in the project was to perform the requisite research pertaining to CMS NCDs.
Additional data collection was required for research presented in this chapter not collected for the broader project conducted at Tufts Medical Center. This included data required for consideration of expenditures in the year following first use of an
intervention and the impact of a reallocation of expenditures on their distribution across patient populations. All research presented in this chapter is my own work, including the data collection, analysis, and reporting.
5
Abstract
There is a growing recognition that we cannot afford the provision of all new health care technologies, even those that are proven to be beneficial. This is increasingly true in the US, where health care spending is on an unsustainable upward trajectory. US health care spending is greatly in excess of that of other countries; however, with respect to key health metrics, the US health care system performs relatively poorly. Despite this, unlike many other developed countries economic evaluation, and more specifically
cost-effectiveness evidence, is used sparingly in the US health care system. Notably, the Centers for Medicare and Medicaid Services (CMS), administrators of the Medicare programme, state that cost-effectiveness evidence is not relevant to coverage decisions for medical technology and interventions evaluated as part of National Coverage
Determinations (NCDs). The empirical aspect of this thesis evaluates the current use and potential value of using cost-effectiveness evidence in CMS NCDs. A database was built using data obtained from NCD decision memoranda, the medical literature, a Medicare claims database, and Medicare reimbursement information. The findings of the empirical work show that, CMS’s stated position notwithstanding, cost-effectiveness evidence has been cited or discussed in a number of coverage decisions, and there is a statistically significant difference between positive and non-coverage decisions with respect to cost-effectiveness. When controlling for factors likely to have an effect on coverage
decisions, the availability of cost-effectiveness evidence is a statistically significant predictor of coverage. In addition, the quality of the supporting clinical evidence, the availability of alternative interventions, and the recency of the decision are statistically significant variables. Further, when hypothetically reallocating resources in accordance with cost-effectiveness substantial gains in aggregate health are estimated. It is shown that using cost-effectiveness to guide resource allocation has an effect on resource allocation across patient populations and types of technology.
6
Table of Contents
Table of Contents ... 6
List of tables ... 14
List of Figures ... 17
Abbreviations ... 19
1.
Introduction ... 23
2.
Background and Theory ... 32
2.1. Introduction ...33
2.2. The need for economic evaluation in health care ...34
2.2.1. The scarcity of health care resources ...34
2.2.2. Markets in health care ...34
2.3. Economic evaluation in health care ...36
2.3.1. Efficiency in health care ...36
2.3.2. The allocation of scarce resources ...37
2.3.3. Welfarism vs. extra-welfarism ...39
2.3.4. Applying cost-benefit analysis to health care ...40
2.3.5. Extra-welfarism and cost-effectiveness analysis ...40
2.3.6. The equivalence of cost-effectiveness analysis and cost-benefit analysis ...41
2.4. Using economic evidence to inform resource allocation ...43
2.5. Cost-effectiveness analysis ...46
2.5.1. Resource allocation across multiple patient populations ...49
2.5.1.1 League table approach ...50
2.5.2. Mathematical programming ...52
2.5.2.1 Overview ...52
2.5.2.2 Mathematical programming formulation ...53
2.5.2.3 Relaxation of assumptions in the mathematical programming formulation ...55
7
2.5.3. A cost-effectiveness threshold decision rule ...57
2.5.4. Importance of the correct calibration of the threshold ...59
2.5.5. Net benefit approach ...59
2.5.6. Relaxation of assumptions ...61
2.5.7. Using cost-effectiveness information with incomplete information ...62
2.5.7.1 Searching for a threshold ...62
2.5.7.2 The Sendi, Gafni and Birch (SGB) method ...65
2.5.8. Disinvestment of health care programmes ...66
2.5.9. Criticisms of cost-effectiveness analysis ...67
2.6. The cost-effectiveness threshold ...70
2.6.1. Deriving the cost-effectiveness threshold ...71
2.6.1.1 Assigning a monetary value to life ...71
2.6.1.2 Linking the threshold to GDP per capita ...73
2.6.1.3 Insight from other industries ...75
2.6.2. Valuations of the cost-effectiveness threshold ...77
2.6.3. Characteristics of a cost-effectiveness threshold ...79
2.6.3.1 Implicit vs. explicit thresholds ...79
2.6.3.2 Hard and soft cost-effectiveness thresholds ...80
2.6.4. ICER threshold values or ranges proposed by individuals or institutions ...84
2.6.4.1 The $50,000 per QALY cost-effectiveness threshold ...86
2.6.5. Empirical work into the value of the threshold ...88
2.6.6. Cost-effectiveness acceptability curves ...89
2.7. Chapter summary ...91
3.
Practice ... 92
3.1. Introduction ...93
3.2. Health care system in context ...94
3.2.1. Health care spending ...94
3.2.1.1 Future trends for health care spending ...96
3.2.2. Abundance of health care resources ...97
3.2.3. Key health statistics ...98
3.2.3.1 Life expectancy ...99
8
3.2.5. Global rankings ...100
3.3. Using economic evaluation to inform resource allocation ...102
3.3.1. Countries in which cost-effectiveness evidence plays an integral role in decision-making ...102
3.3.1.1 UK and NICE ...103
3.3.1.2 Sweden and TLV/SBU ...105
3.3.1.3 Australia and the PBAC/MSAC ...107
3.3.1.4 Canada and CADTH ...109
3.3.2. Countries in which cost-effectiveness evidence plays less of a role in decision-making ...111
3.3.2.1 Germany and IQWiG ...112
3.3.2.2 France and HAS ...116
3.3.2.3 US ...119
3.3.3. Inter-country comparison ...122
3.4. The use of cost-effectiveness evidence in the US health care system ...123
3.4.1. The US Panel on Cost-Effectiveness in Health and Medicine ...123
3.4.2. Attempts to incorporate cost-effectiveness analysis into health care ...124
3.4.2.1 Cost-effectiveness and Medicare ...124
3.4.2.2 The Oregon Experiment ...126
3.5. Resistance to cost-effectiveness evidence in the US health care system ...130
3.5.1. American Exceptionalism ...132
3.5.2. The Patient Protection and Affordable Care Act ...132
3.6. Chapter Summary ...136
4.
Introduction to Empirical Work ... 138
4.1. Introduction ...139
4.2. Introduction to Medicare...140
4.2.1. Coverage of medical technology in Medicare ...140
4.2.2. Medicare coverage policies ...141
4.2.2.1 Coverage Determinations ...142
4.3. Empirical work...143
4.3.1. Chapter 5 ...143
9
4.3.3. Chapter 7 ...145
4.4. Choice of a quantitative approach ...146
4.5. Literature review ...146
4.5.1. Literature pertaining to Chapter 5 and Chapter 6 ...146
4.5.1.1 George et al. 2001 ...147
4.5.1.2 Towse and Pritchard 2002 ...149
4.5.1.3 Dranove et al. 2003 ...150
4.5.1.4 Devlin and Parkin 2004 ...152
4.5.1.5 Dakin et al. 2006 ...153
4.5.1.6 Harris et al. 2008 ...154
4.5.1.7 Rocchi et al. 2008 ...156
4.5.1.8 Chim et al. 2010 ...157
4.5.1.9 Devlin et al. 2010 ...158
4.5.2. Literature pertaining to Chapter 7 ...160
4.5.2.1 Cromwell et al. (1998) ...161
4.5.2.2 Zaric and Brandeau (2001) ...162
4.5.2.3 Ratcliffe et al. (2005) ...162
4.6. Methodological approach...164
4.7. Methodology - Generation of database ...166
4.7.1. Identification of NCDs ...166 4.7.2. Decision memoranda ...166 4.7.3. Unit of analysis ...166 4.7.4. Database ...167 4.7.4.1 Coverage decision ...168 4.7.4.2 Quality of evidence ...169 4.7.4.3 Alternative intervention ...170 4.7.4.4 Type of intervention ...171 4.7.4.5 Coverage requestor ...171 4.7.4.6 Date of decision ...172 4.7.4.7 Cost-effectiveness ...172
4.7.4.8 Identification of cost-effectiveness analyses ...173
4.7.4.9 Evaluation of cost-effectiveness studies ...174
4.7.4.10 An example of the literature search for cost-effectiveness studies...178
4.7.4.11 Overview of the cost-effectiveness variable ...179
10
4.7.5. Additional variables required for empirical work presented in Chapter 7 ...184
4.7.5.1 Cost-effectiveness data ...184
4.7.5.2 Incremental costs ...185
4.7.5.3 Cost of an intervention in the first year of its use ...185
4.7.5.4 Incremental effectiveness data ...186
4.7.5.5 Utilisation rates ...187
4.7.5.6 Reimbursement codes ...189
4.7.5.7 Categorisation of interventions ...190
4.7.5.8 Software ...190
4.8. Chapter summary ...190
5.
Empirical Research: Part 1 ... 193
5.1. Introduction ...194
5.2. Objectives and Methods ...195
5.2.1. Objective 1 ...195
5.2.2. Objective 2 ...195
5.3. Results ...198
5.3.1. Literature search findings ...198
5.3.2. Characteristics of cost-effectiveness studies ...207
5.3.3. Findings – Research Objective 1 ...208
5.3.4. Findings – Research Objective 2 ...210
5.4. Discussion ...212
5.4.1. Cost-effectiveness evidence featuring in decision memos ...212
5.4.1.1 Other indications of the relevance of cost-effectiveness evidence ...215
5.4.2. Statistically significant difference between positive and non-coverage decisions with respect to cost-effectiveness ...216
5.4.3. Challenges and limitations ...217
5.4.4. Next Steps ...219
5.4.5. Policy relevance ...220
5.4.6. Chapter summary ...222
6.
Empirical Research: Part 2 ... 224
6.1. Introduction ...225
11
6.2.1. Objective ...226
6.2.2. Methodology ...226
6.2.3. Exploratory analysis of interaction effects ...228
6.2.4. Analyses ...228
6.3. Results ...232
6.3.1. Primary analyses ...232
6.3.1.1 Univariate analyses ...232
6.3.1.2 Multivariate analyses ...234
6.3.2. Controlling for multiple coverage decisions from a single decision memo ...237
6.3.3. Alternative specification of the Date variable ...241
6.3.4. Evaluation of the cost-effectiveness variable ...241
6.3.4.1 Exclusion of cost-per life year studies ...242
6.3.4.2 Addition of cost-effectiveness data from studies published after the NCD245 6.3.4.3 Subdividing the ICER into incremental cost and incremental benefit ...247
6.3.4.4 Including only observations with an associated estimate of cost-effectiveness ...256
6.4. Discussion ...259
6.4.1. Methodology ...259
6.4.2. Overview of research findings ...261
6.4.2.1 Quality of the supporting clinical evidence ...261
6.4.2.2 Availability of alternative interventions ...262
6.4.2.3 Cost-effectiveness ...262
6.4.2.4 Date of decision ...264
6.4.3. Limitations and challenges ...265
6.4.4. Policy relevance ...267
6.4.5. Next steps ...268
6.5. Chapter summary ...272
7.
Empirical Research: Part 3 ... 275
7.1. Introduction ...276
7.2. Objective and Methods ...278
7.2.1. Sample of interventions ...278
12
7.2.2.1 Objective 1 ...280
7.2.2.2 Objective 2 ...285
7.2.3. Datasets ...285
7.3. Results ...286
7.4. Reallocation including only positive coverage decisions ...290
7.4.1. Reallocation including positive and non-coverage decisions ...294
7.4.2. Effect of reallocation on distribution of expenditures ...298
7.5. Discussion ...302
7.5.1. Summary of findings – Gains in efficiency ...302
7.5.2. Summary of findings – Effect of reallocation on the distribution of resources ..304
7.5.3. Limitations and challenges ...305
7.5.4. Policy significance ...309
7.5.5. Next steps ...312
7.6. Chapter summary ...315
8.
Summary and Conclusions ... 316
8.1. Context of thesis ...317
8.2. Background ...318
8.3. Introduction to empirical work ...320
8.4. Key findings of empirical work ...321
8.4.1. Empirical Research: Part 1...321
8.4.2. Empirical Research: Part 2...322
8.4.3. Empirical Research: Part 3...323
8.5. Limitations ...325
8.5.1. Cost-effectiveness evidence ...325
8.5.2. Empirical work presented in Chapter 5 ...326
8.5.3. Empirical work presented in Chapter 6 ...326
8.5.4. Empirical work presented in Chapter 7 ...328
8.5.5. Broader limitations ...329
8.6. Contributions of thesis ...330
13
8.7.1. Empirical Research: Part 1...333
8.7.2. Empirical Research: Part 2...333
8.7.3. Empirical Research: Part 3...334
8.8. Next Steps ...335
8.8.1. Research scope ...335
8.8.2. Improving existing variables ...336
8.8.3. Potential additional variables ...337
8.8.4. Alternative conceptual framework ...338
8.8.5. Expanding scope of reallocation work ...339
8.9. Moving towards value based policies – opportunities and challenges ...340
8.9.1. Moving forward – Challenges, opportunities, and recommendations ...340
8.9.1.1 Restricted authoritative capacity ...341
8.9.1.2 Resistance to the use of cost-effectiveness evidence ...342
8.9.1.3 Acceptance of limitations on health care ...342
8.9.1.4 Ambiguity of decision-making criteria ...343
8.9.1.5 Learn from international experiences ...344
8.9.1.6 Comparative effectiveness ...345
8.10. Conclusions ...346
9.
References ... 349
10.
Appendices ... 387
10.1. Appendix 1 - Assigning monetary values to life – worked examples ...388
10.1.1. Compensating wage method (revealed preference) ...388
10.1.2. Contingent valuation ...388
10.2. Appendix 2 – Email correspondence ...389
14
List of tables
Table 1. Costs and effects of health care programmes available for four groups of patients ... 47 Table 2. League table of available health care programmes ... 52 Table 3. Valuation of a statistical life in road and the railway transport industry. ... 76 Table 4. Explicit, implicit and assumed ICER threshold values in other countries (adapted from Cleemput et al. 2008) ... 78 Table 5. NICE’s application of special circumstances in technology appraisals ... 84 Table 6. Abundance of key health care resources ... 98 Table 7. Inter-country comparison of key health statistics – life expectancy and infant mortality ... 99 Table 8. World Health Organization (WHO) rankings of health care systems ... 100 Table 9. National Coverage Determinations including cost-effectiveness evidence made after enactment of the PPACA legislation ... 135 Table 10. Findings of Towse and Pritchard (2002) ... 150 Table 11. Grading evidence according to net benefit and quality of evidence (USPSTF Guidelines) ... 169 Table 12. Grading of cost-effectiveness analyses ... 178 Table 13. Search strategy and literature search results for the NCD for deep brain
stimulation... 179 Table 14. Identification of served and unserved populations from Medicare claims ... 188 Table 15. Positive coverage decisions associated with an estimate of cost-effectiveness ... 200 Table 16. Non-coverage decisions associated with an estimate of cost-effectiveness ... 205
15 Table 17. Decision memos including discussion regarding cost-effectiveness or citation
of a cost-effectiveness analysis ... 209
Table 18. Variables included in the analysis ... 227
Table 19. Results of univariate logistic regression ... 233
Table 20. Results of multivariate logistic regression ... 235
Table 21. Univariate regression clustering sub-decisions from the same decision memo ... 239
Table 22. Multivariate regression clustering sub-decisions from the same decision memo ... 240
Table 23. Cost-effectiveness studies reporting cost-per life year gained ratios ... 242
Table 24. Univariate regression with cost-per life year studies excluded from the dataset ... 243
Table 25. Multivariate regression with cost-per life year studies excluded from the dataset ... 244
Table 26. Results of multivariate logistic regression – inclusion of cost-effectiveness studies published following the coverage decision ... 246
Table 27. Univariate analysis – Incremental costs and effectiveness ... 248
Table 28. Multivariate regression including incremental cost and incremental effectiveness ... 250
Table 29. Multivariate regression including incremental cost ... 252
Table 30. Multivariate regression including incremental effectiveness ... 254
Table 31. Multivariate regression including incremental effectiveness and excluding quality of evidence ... 255
Table 32. Univariate logistic regression – Only coverage decisions with associated estimate of cost-effectiveness ... 257
16 Table 33. Multivariate logistic regression – Only those variables with an associated
cost-effectiveness estimate ... 258
Table 34. Worked example – Existing distribution of expenditures across available interventions ... 281
Table 35. Worked example – Step 1 ... 282
Table 36. Worked example – Step 2 ... 282
Table 37. Worked example – Step 3 ... 283
Table 38. Worked example – Step 4 ... 283
Table 39. Interventions eligible for reallocation ... 287
Table 40. Reallocation including only positive coverage decisions ... 292
Table 41. Reallocation including positive and non-coverage decisions ... 296
Table 42. Effect of expenditure reallocation on distribution across broad disease classifications ... 299
Table 43. Effect of expenditure reallocation on distribution across different types of interventions ... 299
Table 44. Effect of expenditure reallocation on distribution across patient populations of different sizes ... 300
Table 45. Effect of expenditure reallocation on distribution of resources at the patient level ... 301
17
List of Figures
Figure 1. The fundamentals of economic evaluation (Drummond et al. 2005) ... 44
Figure 2. Cost-effectiveness plane (Black 1990) ... 45
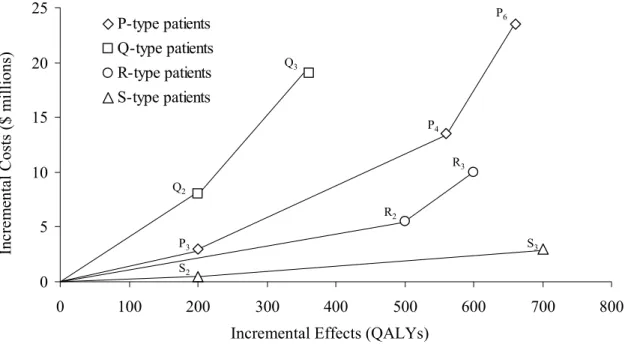
Figure 3. Costs and effects of programmes available to ‘type P’ patients ... 48
Figure 4. Cost-effectiveness space with cost-effectiveness frontiers for each patient population ... 50
Figure 5. Resource allocation using a cost-effectiveness threshold as a decision rule ... 61
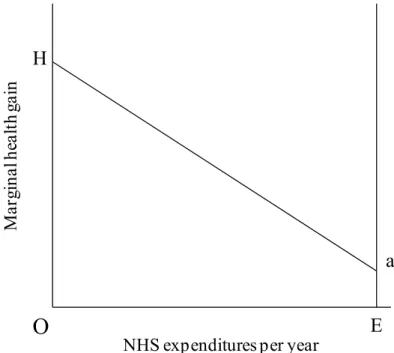
Figure 6. Marginal health gain associated with available interventions in the NHS ... 63
Figure 7. Representation of all health care programmes available to the NHS ... 65
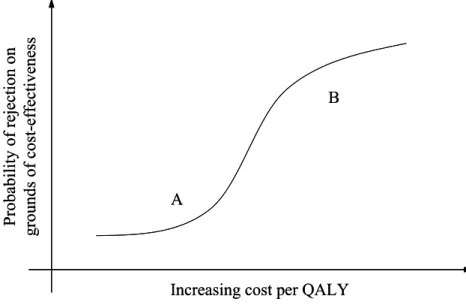
Figure 8. Probability of rejection based on the grounds of cost-effectiveness ... 82
Figure 9. Cost-Effectiveness Acceptability Curve (CEAC) ... 90
Figure 10. Health expenditure as a share of GDP, 2010 (or most recent year available) (OECD 2011) ... 94
Figure 11. Health expenditure per capita, US$ PPP, 2010 (or most recent year available) (OECD 2011) ... 95
Figure 12. Increase in spending on health care as a percentage of GDP ... 97
Figure 13. Efficiency frontier as used by IQWiG ... 114
Figure 14. Separate coverage restrictions in a single decision memo ... 167
Figure 15. Overview of the generation of Cost-effectiveness ... 180
Figure 16. Review process and final sample of coverage decisions with associated estimate of cost-effectiveness ... 199
Figure 17. Grading of cost-effectiveness studies ... 207
18 Figure 19. Overview of findings - Cost-effectiveness of coverage decisions ... 210 Figure 20. Conceptual framework - Production model of CMS decision-making ... 229 Figure 21. Process of identifying final set of coverage decisions for analysis ... 290
19
Abbreviations
AETMIS Agence d’évaluation des technologies et des modes d’Intervention en Santé AHRQ Agency for Healthcare Research and Quality
AMA American Medical Association
AMCP Academy of Managed Care Pharmacy
AN-DRG Australian National Diagnosis Related Groups
AU Australia
AuSCT Autologous Stem Cell Transplantation BBA Balanced Budget Act
BMG Federal Ministry of Health (Germany) BMI Body Mass Index
CADTH Canadian Agency for Drugs and Technologies in Health CAN Canada
CBO Congressional Budget Office
CCOHTA Canadian Coordinating Office for Health Technology Assessment
CDR Common Drug Review
CEA Cost-Effectiveness Analysis
CEAC Cost-Effectiveness Acceptability Curve CEDAC Canadian Expert Drug Advisory Committee CER Comparative-Effectiveness Analysis
CEVR Center for the Evaluation of Value and Risk in Health
CI Confidence Interval
CMS Centers for Medicare & Medicaid Services CNV Classic subfoveal lesions
CPAP Continuous Positive Airway Pressure
CPI Consumer Price Index
CPT Current Procedural Terminology
20 CVZ College voor Zorgverzekeringen
DBS Deep Brain Stimulation
DERP Drug Effectiveness Review Project DoD Department of Defense
DoH Department of Health
DPN Diabetic Peripheral Neuropathy
ECP External Counterpulsation
EQ-5D EuroQol Group 5-Dimension Self-Report Questionnaire ESA Erythropoiesis Stimulating Agents
ESRD End-Stage Renal Disease
FDG 2-Fluorodeoxy-D-Glucose FOBT Fecal Occult Blood Test
G-BA Federal Joint Committee (Germany) GDP Gross Domestic Product
HCFA Health Care Financing Administration HDA Health Development Agency
HEED Health Economic Evaluations Database HIV Human immunodeficiency virus
HTA Health Technology Assessment HUI Health Utilities Index
ICD Implantable Cardioverter Defibrillator ICD-9 International Classification of Diseases
ICER Incremental Cost-Effectiveness Ratio
IDU Intravenous Drug Use
iFOBT Immunological Fecal Occult Blood Testing INR International normalised ratio
IQWiG Institute for Quality and Efficiency in Health Care
ISPOR International Society of Pharmacoeconomics and Outcomes Research LAGB Laparoscopic Adjustable Gastric Banding
21 MBS Medicare Benefits Schedule
MEDCAC Medicare Evidence Development & Coverage Advisory Committee MILP Mixed Integer Linear Programme
MIPPA Medicare Improvements for Patients and Providers Act
MRI Magnetic Resonance Imaging
MSAC Medical Services Advisory Committee
NA Not applicable
NCD National Coverage Determination
NEMA National Electric Manufacturers Association NETT National Emphysema Treatment Trial NHS National Health Service
NHS EED National Health Service Economic Evaluations Database NICE National Institute for Health and Clinical Excellence NNWT Noncontact Normothermic Wound Therapy
OECD Organisation for Economic Co-operation and Development
OR Odds Ratio
OSA Obstructive Sleep Apnea
OTA Office of Technology Assessment P&T Pharmacy and Therapeutics
PBAC Pharmaceutical Benefits Advisory Committee
PBS Pharmaceutical Benefits Scheme
PCORI Patient-Centered Outcomes Research Institute PCT Primary Care Trust
PET Positron Emission Tomography
PhRMA Pharmaceutical Research and Manufacturers Association of America PPACA Patient Protection and Affordable Care Act
PPP Purchasing Price Parity
PTA Percutaneous Transluminal Angioplasty QALY Quality Adjusted Life Year
22 ROC Receiver Operating Characteristic
RYGBP Roux-en-Y gastric bypass
SBU Swedish Council of Technology Assessment in Health Care
SG Standard Gamble
SGB Sendi, Gafni, and Birch
SNM The Society of Nuclear Medicine SSA Social Security Amendments
TA Technology Assessment
TEC Blue Cross Blue Shield Association Technology Evaluation Center TLV Tandvårds- och läkemedelsförmånsverket (Sweden)
TTO Time-Trade Off
UK United Kingdom
US United States of America
USPSTF US Preventative Services Task Force VA Department of Veterans Affairs VBP Value Based Pricing
VIF Variance Inflation Facor
WHO World Health Organization
23
24 There is growing recognition that we cannot afford the provision of all new health care technologies, even those that are proven to be beneficial. This is increasingly true in the US, where health care spending is on an unsustainable upward trajectory, and where current health care spending is twice that of many developed countries in terms of GDP per capita.
The US health care system performs poorly in comparison to others. Ranked 37th by the World Health Organization (WHO) in their global rankings of health care systems, and placed last in the Commonwealth Fund’s 2010 rankings of health care systems in
Australia, Canada, New Zealand, the United Kingdom, Germany, the Netherlands and the US, the US health care system has much room for improvement. Despite health care spending greatly in excess of that in other developed countries, average life expectancy in the US is shorter and infant mortality higher. Further, with respect to health care
resources, the US has fewer physicians and hospital beds per capita compared to other developed countries. Most notable, however, is the lack of universal health insurance coverage in the US, with many US citizens having either no or insufficient health insurance.
There is increasing awareness that resource allocation must be addressed in a systematic rather than intuitive manner. One approach to the prioritisation of resources between competing interventions is to use economic evaluation to assess health care technology. In Chapter 2, I present the theory underpinning the use of economic evaluation, and more specifically cost-effectiveness analysis, to inform resource allocation. I provide a worked example illustrating how a cost-effectiveness decision rule can lead to the efficient
allocation of scarce resources across multiple health care programmes. I describe the league table and mathematical programming approaches as two frameworks for
implementing a cost-effectiveness decision rule. The practicality of both approaches is, however, restricted by the requirement for complete knowledge of the costs and benefits of available health care programmes. Therefore, it is necessary to have a benchmark
25 value, or decision rule, with which to interpret the findings of cost-effectiveness studies. The remainder of Chapter 2 focuses on the cost-effectiveness threshold. I present the various valuations of the cost-effectiveness threshold, including the threshold operated by the National Institute for Health and Clinical Excellence (NICE) in the UK and
thresholds derived through retrospective evaluation of decisions made by various international agencies. I also present the advantages and disadvantages of hard vs. soft and explicit vs. implicit cost-effectiveness threshold valuations, and of cost-effectiveness acceptability curves, used to interpret cost-effectiveness evidence while conveniently evading the question of the value of the cost-effectiveness threshold.
In Chapter 3, I place the US health care system into an international context with respect to spending, abundance of health care resources, and key health statistics. Comparator countries were chosen on the basis that they help illustrate variation in how economic evidence and other factors are considered in the evaluation of health care technologies across jurisdictions. I chose the UK, Sweden, Australia, and Canada as examples of countries in which cost-effectiveness evidence plays a fundamental role in decision-making, and Germany and France as examples of countries in which cost-effectiveness evidence plays a lesser role. In spite of health care spending greatly in excess of
spending in other countries, the US health care system performs poorly across a number of key health metrics. Despite an evident need to increase the return on health care spending, cost-effectiveness evidence is used only sporadically in the US health care system. Notably, and of particular relevance to the empirical aspect of this thesis, Medicare, the largest payer in the US, states that cost-effectiveness is not a factor considered in its coverage decisions. To provide insight into the resistance to cost-effectiveness evidence in the US health care system, I review the failed attempts by Medicare and the state of Oregon’s Medicaid programme to incorporate
cost-effectiveness evidence into decision-making. Finally, I discuss the implications of the recent Patient Protection and Affordable Care Act (PPACA) legislation for the future use of cost-effectiveness evidence in the US, and highlight recent instances in which the
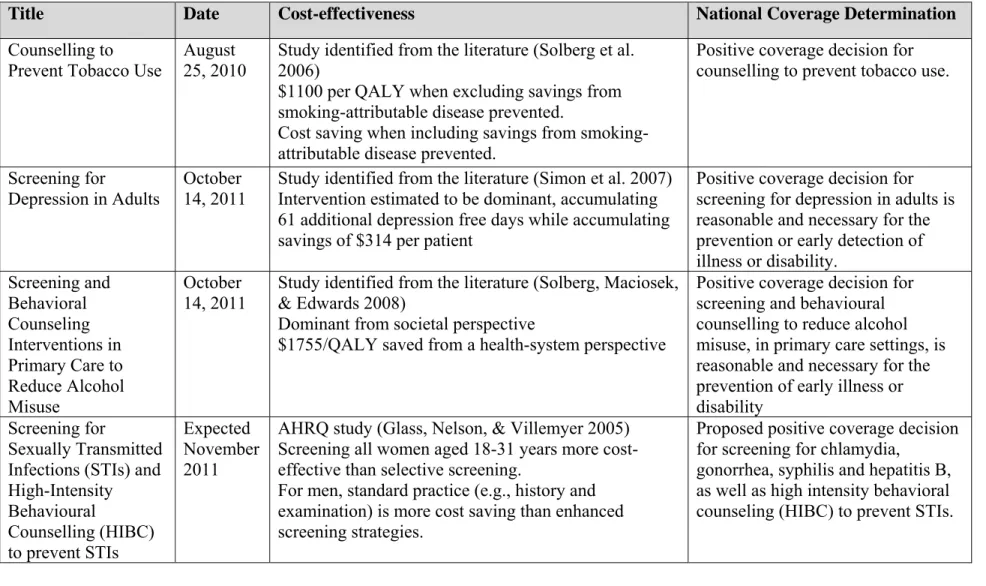
26 Centers for Medicare and Medicaid Services (CMS) used cost-effectiveness evidence in coverage decisions for preventative care.
The foundations of my empirical work are presented in Chapter 4. I chose Medicare, the health insurance programme for Americans aged 65 years and over and those with certain disabilities, as the aspect of the US health care system on which to focus my research. Medicare is the largest payer in the US, providing coverage to 46 million Americans at a cost of $6 billion, approximately 5 % of GDP. Medicare coverage decisions for medical technology have far-reaching influence and are thought to affect private payers’ coverage decisions. This research concerns CMS’s national coverage policies, or National
Coverage Determinations (NCD). National Coverage Determinations are binding to all regional Medicare Administrative Contractors (MACs), and are reserved for interventions deemed particularly controversial or projected to have a major impact on the Medicare programme.
The research objectives for the empirical component of this thesis are as follows: Empirical Research: Part 1
1. To examine NCD decision memos to determine if the presented evidence review is consistent with CMS’s stated position that cost-effectiveness evidence is not relevant to coverage decisions.
2. To determine if there is a difference between the cost-effectiveness of positive coverage decisions and non-coverage decisions.
Empirical Research: Part 2
1. To determine if cost-effectiveness is an independent predictor of coverage decisions included in NCDs when controlling for other factors likely to have an effect on coverage decisions.
27 1. To estimate potential gains in aggregate health achieved from reallocating
expenditures between interventions covered as part of NCDs in a manner consistent with a cost-effectiveness decision rule.
2. To estimate the impact of reallocation on the distribution of expenditures across disease areas (oncology, cardiology, and other) and types of intervention (treatment, diagnostic, and other).
Also in Chapter 4, I describe a literature search I performed to identify studies to help inform the methodological approach for the empirical work. First, I performed a search to identify studies that evaluated the role of cost-effectiveness evidence in coverage and reimbursement decisions, or in recommendations for the efficient use of medical
technology. I identified and reviewed studies that evaluated decisions made by NICE in the US, the PBAC in Australia, CEDAC in Canada, PHARMAC in New Zealand, and an HMO in the US. Second, I performed a search to identify studies that estimated
efficiency gains from alternative approaches for resource allocation.
In the remainder of Chapter 4, I describe the development of the database used for the empirical work. Variables in the database include cost-effectiveness, quality of supporting clinical evidence, availability of alternative interventions, date of decision, coverage requestor, and type of intervention. I primarily generated the cost-effectiveness variable through literature searches, although on occasion a relevant cost-effectiveness ratio originated from the decision memo accompanying the NCD. The variable
classifying the quality of the supporting clinical evidence was generated through review of the decision memo by two researchers at Tufts Medical Center using the US
Preventative Service Task Force (USPSTF) guidelines for grading evidence. I generated the remaining variables from the information presented in decision memos. Additional variables were required for the third piece of empirical work, including incremental cost and incremental QALY gain data, the cost of the intervention in the year following its first use, the existing utilisation rate, and the size of the eligible patient population. The
28 incremental cost and incremental effectiveness data typically originated from the cost-effectiveness studies; the existing utilisation rate and size of the eligible patient population from a Medicare claims database; and the additional cost data required for estimation of the intervention in the year following first use from Medicare
reimbursement codes.
Chapter 5 describes the first piece of my empirical work. As noted, CMS state that cost-effectiveness is not a factor it considers when making NCDs. The first objective of the research presented in chapter 5 was to examine NCD decision memos to identify instances when cost-effectiveness evidence is cited or discussed, thus assessing the consistency of CMS’s behaviour with its stated position on the use of cost-effectiveness evidence. I reviewed each decision memo (n=140) for discussion or citation of cost-effectiveness evidence relevant to the included coverage decisions (n=255). On 14 occasions, a coverage decision was associated with either discussion of cost-effectiveness evidence or a citation of a relevant cost-effectiveness study. Twelve of the 14 coverage decisions were positive, and notably, in each instance the estimate of cost-effectiveness was favourable (maximum ICER of $27,161 per life year gained). The second objective of this research was to determine if there is a difference between positive and non-coverage decisions with respect to cost-effectiveness. I supplemented the estimates of cost-effectiveness identified in decision memos with a series of literature searches to identify published estimates of cost-effectiveness relevant to included coverage decisions. For 64 coverage decisions, an associated cost-effectiveness estimate was identified. Findings show that CMS are covering interventions not cost-effective by traditional standards; nine covered interventions are associated with an ICER greater than $100,000 per QALY and three with an ICER greater than $500,000 per QALY. I used a Mann Whitney U test to determine a statistically significant difference between positive coverage decisions and non-coverage decision with respect to their cost-effectiveness, suggesting that interventions subject to positive coverage decisions tend to be associated with more favourable cost-effectiveness evidence.
29 Chapter 6 describes the second piece of empirical work. This research builds on Chapter 5 and evaluates whether, when controlling for factors that are likely to have an effect on Medicare coverage decisions, cost-effectiveness, or the availability of cost-effectiveness evidence, is statistically significantly associated with the coverage decision. In addition to cost-effectiveness, I accounted for a number of aspects thought to be relevant to
decision-making, with independent variables such as the quality of the supporting clinical evidence, the availability of alternative interventions, intervention type, origin of the request for coverage, and date of the decision included in the model. I estimated the model using binomial logistic regression, regressing the coverage decision (positive/non-coverage) against the independent variables. I performed univariate and multivariate regressions. Compared with interventions estimated to be dominant, those with no associated estimate of cost-effectiveness were approximately five times less likely to receive a positive coverage decision. Interventions associated with good quality supporting clinical evidence were six times more likely to receive a positive coverage decision compared with those associated with insufficient evidence. Compared to interventions with no available alternative, those with an available alternative were approximately eight times less likely to be associated with a positive coverage decision. Finally, coverage decisions made in 2006-2007 were approximately 10 times less likely to be associated with a positive coverage decision than those made in 1999-2001, with interventions considered in more recent time periods increasingly less likely to be associated with a positive coverage decision.
While the findings are insufficient to conclude that CMS coverage decisions are
consistent with cost-effectiveness, it is notable that the availability of cost-effectiveness evidence estimating the intervention to be dominant is associated with the coverage decision. In addition, this research provides insight into the ‘reasonable and necessary’ coverage criterion, suggesting that CMS operate evidence-based coverage policy and highlighting that the availability of alternatives is relevant to decision-making. The
30 findings show that, when controlling for other factors, CMS became more restrictive with respect to coverage over the time period considered.
Chapter 7 describes the third piece of empirical work. In the research presented in Chapter 5, I determined that CMS cover a number of interventions not cost-effective by traditional standards. Coverage of interventions with high ICERs is inefficient as it consumes considerable resources and produces marginal health gains. The research presented in Chapter 7 considers the question of the inefficient use of resources and estimates what gains in aggregate health could be achieved from allocating resources using a cost-effectiveness rule. Specifically, the objectives of the research are to estimate potential gains in aggregate health from reallocating existing expenditures, and to
estimate the impact of reallocation on the distribution of resources across disease areas and types of intervention. To reallocate expenditures between interventions, I simulated disinvestment in relatively cost-ineffective interventions and increased investment in cost-effective interventions through the manipulation of utilisation rates. The findings estimate that substantial gains in aggregate health are achievable from reallocating expenditures to maximise health while maintaining a net change in total expenditure of zero. Further, simply increasing the utilisation of dominant interventions was estimated to yield substantial aggregate health gains and cost-savings. The distribution of
expenditures across disease areas and types of technology following reallocation of resources was different than the existing distribution.
Chapter 8 constitutes the final chapter of this thesis, in which I summarise the empirical work and discuss the key findings. Also, I discuss the limitations of this thesis and the steps that can be taken to further develop its empirical aspects. Finally, I describe how this thesis contributes to knowledge and its policy relevance.
This thesis will contribute to knowledge in a variety of ways. First, it provides the first systematic assessment of the cost-effectiveness of interventions evaluated by CMS
31 through NCDs, illustrating that CMS cover interventions that do not represent good value, although there is a statistically significant difference between positive and non-coverage decisions with respect to cost-effectiveness. Second, it provides the first empirical analysis of CMS NCDs that considers a variety of factors likely to have an effect on coverage decisions. This analysis shows that the quality of the supporting clinical evidence, the availability of alternative interventions, the date of the decision, and the availability cost-effectiveness evidence are associated with coverage decisions. Third, it provides the first attempt to estimate efficiency gains in the Medicare
programme through the hypothetical reallocation of resources using cost-effectiveness evidence. The analysis shows that substantial gains in aggregate health are achievable from using a cost-effectiveness rule to inform resource allocation while maintaining existing levels of expenditures.
Given the recent passing of the PPACA legislation and the ongoing debate surrounding the future of the Medicare programme, this thesis is timely in terms of policy relevance. This research sheds light on the value of interventions offered in the Medicare
programme and shows that CMS have on occasion included cost-effectiveness evidence in their review of the evidence base. The research illustrates the evidence-based nature of CMS coverage decisions and provides an insight into the interpretation of the ‘reasonable and necessary’ criteria operated by CMS. This type of research has the potential to lead to better and more consistent decision-making and increase the accountability of CMS. The research suggests that substantial gains in aggregate health are achievable from reallocating existing expenditures, and that cost-effectiveness evidence has the potential to inform more efficient resource allocation decisions.
32
33
2.1.
Introduction
In this chapter, I describe the role of economic evaluation in the allocation of scarce health care resources. Unlike other sectors of the economy, market forces cannot be relied upon for resource allocation in health care. Economic evaluation offers an
approach to help choose between competing health care interventions to prioritise health care spending.
In the following sections, I describe two methods of economic evaluation,
cost-effectiveness analysis and cost-benefit analysis, and the key differences between them. I provide a worked example using a scenario including multiple health care programmes to illustrate how adherence to a cost-effectiveness decision rule will result in efficient resource allocation. Two frameworks for implementing a cost-effectiveness decision rule are described; the league table approach and mathematical programming. These
approaches are limited by the magnitude of the information requirements. Alternative frameworks such as the ‘searching for the threshold’ and the ‘Sendi, Gafni, and Birch’ are discussed as approaches that are not inhibited by these information requirements.
The requirement of a cost-effectiveness threshold to interpret cost-effectiveness evidence is highlighted and a worked example illustrates how a calibrated threshold can lead to efficient resource allocation. The last section of this chapter focuses on approaches for the derivation of the cost-effectiveness threshold, various valuations of thresholds that are used or have been proposed, and various criteria with which thresholds can be
characterised. Cost-effectiveness acceptability curves (CEAC) are also shown as a method of presenting effectiveness findings that avoids the need for a cost-effectiveness threshold.
34
2.2.
The need for economic evaluation in health care
2.2.1. The scarcity of health care resources
Health care resources are scarce. Consequently, health care systems cannot provide all care that would potentially benefit patients. Decisions must be made as how best to allocate available resources to meet health care system goals. Often referred to as the prioritisation or rationing of resources, resource allocation can be emotive and
contentious.
While currently at the forefront of health care policy debate, the prioritisation of health care resources is not only a recent concern. It has always been the case that doctors have had to judge the reasonableness of the care they provide. (Ubel, 2001; Ubel & Goold, 1997) Williams, 2002 states, “Time and effort and other health care resources devoted to one patient could not be devoted to another, so they had to decide how to allocate these scarce resources so as to do the most good, as they saw it.”(Williams, 2002)
How to allocate scarce health care resources remains a challenge. In many countries specialised institutions have been established to provide guidance on resource allocation, e.g., the National Institute for Health and Clinical Excellence (NICE) in the UK. A principal role of these institutions is to evaluate the evidence base for new and established interventions as a precursor to coverage and reimbursement decisions or to provide guidance to practitioners. It seems reasonable to ask why such institutions are necessary. Similar institutions do not exist in other industries in which market forces are relied upon to drive down costs and to efficiently allocate resources. In the following section, I will discuss why markets are insufficient and inappropriate for health care resource allocation.
2.2.2. Markets in health care
In many industries, markets are the mechanism used to ration goods. The forces that determine the price and quantity of goods in a market are supply and demand. Alone,
35 however, markets are insufficient to ration health care.
In the absence of government intervention, uncertainty, asymmetry of information, and risk preferences for health and health care precipitate the need and desire for health insurance. However, for three principal reasons markets do not work well in health care. (Donaldson et al. 2005;Donaldson 2008;Donaldson et al. 2008) First, insurance
premiums are actuarially unfair. If health insurance was actuarially fair then premiums paid would be equivalent to expenditure incurred. However, in reality, health insurance is actuarially unfair, as the premiums are ‘loaded’ to cover administration costs and achieve profit. Consequently, some who would otherwise have obtained insurance will be priced out of the market. (Donaldson et al. 2005;Donaldson 2008) The second reason is ‘moral hazard’. Moral hazard is the term used to describe how having insurance coverage changes individuals’ behaviour. If a third party, i.e., the insurer, pays for health care, individuals have less incentive to avoid illness or injury and thus are more likely to use health care than if they were uninsured. This will result in cost inflation with health care becoming more expensive without a corresponding increase in health outcomes. (Donaldson et al. 2005;Donaldson 2008) Finally, a well-functioning health insurance market will set premiums in line with individual risk, i.e., low premiums for those at low risk and higher premiums for those at higher risk. This is problematic as individuals at higher risk tend to be those who can least afford insurance coverage. This results in a social problem, as those in most need of health care are those without health insurance coverage. (Donaldson et al. 2005;Donaldson 2008)
Despite circumventing, at least in part, some of the reasons for market failure, the
establishment of publicly funded health care systems do not avoid the problem of scarcity and the need to prioritise available resources. Economic evaluation, as part of a broader health technology assessment (HTA) programme, is one mechanism by which a health care system can work toward achieving value from health care spending. Through the use of economic evaluation, including cost-effectiveness analysis, the relative value of
36 competing interventions can be used to guide resource allocation decisions. There is debate, however, as to the underlying economic framework that should be used when evaluating health care programmes. Debate has focused upon the welfarist and extra-welfarist frameworks; these are discussed below.
2.3.
Economic evaluation in health careEconomic evaluation forms the basis of informing efficient resource allocation. Within the field of health economics, economic evaluation has been defined as a method of ‘‘ensuring that the value of what is being gained from an activity outweighs the value of what is being sacrificed’’. (Williams 1983)
2.3.1. Efficiency in health care
To understand the use of economic evaluation in health care, it is necessary to appreciate different concepts of efficiency. Palmer and Torgerson (1999) describe three concepts of efficiency; allocative, productive, and technical efficiency. (Palmer & Torgerson 1999) Each concept is described below.
Technical efficiency relates to the relationship between resources (capital and labour) and health outcome. An allocation of resources is technically efficient when the maximum health outcome is achieved from a set of input resources. Accordingly, a particular allocation of resources is technically inefficient when the same health outcome can be achieved with less of any one type of input. (Palmer & Torgerson 1999)
Productive efficiency relates to the relationship between health outcome and the cost of input resources. This differs from technical efficiency, which does not account for circumstances where the same health outcome can be achieved with a different
37 combination of inputs. By considering input costs it is possible to choose between
different combinations of resources to maximise health outcome within a budget constraint. With respect to health care interventions, the consideration of productive efficiency facilitates evaluation of the relative value for money of interventions that generate directly comparable health outcomes. (Palmer & Torgerson 1999)
In contrast to technical and productive efficiency, allocative efficiency accounts for the efficiency with which outcomes are distributed across society. Resource use is
allocatively efficient when any alternative allocation of resources results in at least one person being worse off. Absolute adherence to this principle is difficult, as doing so would preclude an allocation of resources resulting in many people benefiting in terms of health gain at the expense of few being made worse off. Consequently, the decision rule has been modified; resource allocation is allocatively efficient when the welfare of the community is maximised. Accordingly, allocative efficiency has its roots in welfare economics. (Palmer & Torgerson 1999)
2.3.2. The allocation of scarce resources
Health care decision makers can take two broad approaches when allocating scarce resources. The first approach is to eliminate system waste, i.e., to reduce spending without affecting the ability to produce specific health care outputs. Waste is present in varying degrees in all health care systems and its reduction is likely a significant source of savings in some health care systems. (Delaune & Everett 2008;Donaldson et al. 2008) One approach to waste reduction is to ensure that care is ‘appropriate’, i.e., that the potential benefits of care outweigh the potential harms. Efforts to evaluate the
appropriateness of care have led to the development of frameworks based upon available clinical evidence and expert opinion to guide when care should be provided. (Brook et al. 1986;Brook 2009;Fitch et al. 2001) Examples include frameworks for gastrointestinal endoscopy, tympanostomy tubes, and coronary angiography. (Froehlich et al.
38 1997;Hemingway et al. 2008;Kleinman et al. 1994)
The second approach is to attempt to prioritise resources in order to maximise return, in terms of health gain, from investment. This requires maximising investment in health care programmes that generate most health benefit from investment and minimising investment in programmes that generate little, or no, return. (Donaldson et al. 2008) To achieve efficient health care spending the allocation of resources must be done in a rational manner. There is debate, however, as to the most appropriate method for health care resource allocation. (Drummond et al. 2005;Gafni & Birch 2006;Holm 1998;Ubel & Goold 1997)
Various criteria are likely to be considered when allocating scarce resources between health care programmes. The nature and strength of the available evidence, the potential impact of a decision on access to care, relative value for money, and the economic consequences of implementation are likely to be criteria in the decision-making process. (Drummond et al. 2005;Folland, Goodman, & Stano 2003;Keenan, Neumann, & Phillips 2006;Neumann 2005) Society’s preferences for the allocation of resources are also important, and may not be in accordance with the maximisation of health. It has been shown that society typically values care for the elderly, the treatment of more severe diseases, and the avoidance of discrimination against people with chronic illnesses or disabilities highly. (Neumann 2005;NICE 2010c;Ubel 2001) It is a challenge for health care decision makers to concurrently account for each of these criteria and it may be necessary for a decision maker to trade off each factor against the magnitude of health gain. (Devlin & Sussex 2011) Across jurisdictions decision makers are, therefore, likely to have unique internal criteria and to allocate health care resources differently.
It is necessary to use a consistent decision-making framework. Without a framework with which to make decisions, a decision maker has to rely on judgement or to assume that what was done before was the best course of action. Relying on previous decisions
39 to guide resource allocation is rarely likely to yield more efficient decisions than the systematic consideration of relevant criteria. (Drummond et al. 2005) It has been suggested that decisions should be fully transparent, must rest upon criteria that stakeholders agree are relevant, and should be revisable following the availability of additional evidence. (Daniels 2000)
2.3.3. Welfarism vs. extra-welfarism
Welfare economics is a branch of economics that uses microeconomic techniques to examine individuals’ preferences, the optimal allocation of resources, and the consequences of resource allocation on social welfare. (Birch & Donaldson
2003;Brouwer et al. 2008;Coast 2004;Johannesson 1995) Cost-benefit analysis has its theoretical foundations in welfare economics. (Jonsson 2009a) Cost-benefit analysis requires the consequences of a health care programme to be measured in monetary units, facilitating a comparison of costs and benefits in commensurate units. The decision rule is simply that if benefits outweigh costs, the health care programme should be
implemented, and if not, it should not be implemented. With its theoretical
underpinnings in welfare economics, cost-benefit analysis is conceptually appealing. The key criterion when considering a redistribution of resources is whether the redistribution represents a potential Pareto improvement (Kaldor-Hicks criterion) in social welfare, i.e., those who gain from a policy change compensate the losers and remain in a preferred position. (Gafni 2006;Sugden & Williams 1979) For example, if willingness to pay for health care is greatest for the wealthiest in society, then a policy change that results in greater health care for the wealthiest would be optimal, as the gainers could compensate the losers and remain better off. Such a policy would therefore benefit society as a
whole, increasing overall social welfare. (Drummond et al. 2005) Cost-benefit analysis is established as the methodology of choice in sectors of the economy other than health care, including transportation and education. (Claxton et al. 2010)
40
2.3.4. Applying cost-benefit analysis to health care
There are a number challenges to applying cost-benefit analysis to health care. Placing a monetary value on health is associated with a number of difficulties. (Ryan et al. 2001) Various techniques exist, including; the human capital, revealed preference, and
contingent valuation approaches (See Section 2.6.1.1 for further details). (Buxton 2005;Drummond et al. 2005a) Each of these approaches has strengths and weaknesses and none is universally accepted. Assigning a monetary value to health is contentious and many decision makers find it difficult, or even unethical, to depend on such valuations. (Weinstein & Feinberg 1980) Maybe the most notable challenge is that methods that place a monetary value on health intrinsically favour the wealthiest in society. (Gold et al. 1996) To date, cost-benefit analysis has been used infrequently to inform resource allocation in health care, with cost-effectiveness analysis the preferred approach. (Drummond et al. 2005)
2.3.5. Extra-welfarism and cost-effectiveness analysis
Given the challenges outlined above, an alternative to the welfarist framework has been favoured within health economics. (Weinstein & Stason 1977) There is a strong ethical appeal that life, particularly life enjoyed in good health, is different from other
commodities. It is argued that healthy life is necessary in order to carry out all other activities and, therefore, should be awarded special moral importance. (Daniels 2008) Extra-welfarism, or the non-welfarist approach, has been embraced as the theory underpinning much of economic evaluation in health care. (Brouwer & Koopmanschap 2000;Coast 2004;Culyer 1989;Sugden & Williams 1979;Tsuchiya & Williams 2010) Extra-welfarism differs from welfarism, for rather than aiming to maximise social
welfare, the objective is to maximise aggregate health, irrespective of initial health status, age, disability, or indeed, willingness or ability to pay. (Birch & Donaldson 2003;Coast 2004) The extra-welfarist approach may be considered ‘utilitarian’ as the distribution of health gains is not considered. (Lord, Laking, & Fischer 2004) However, as the extra-welfarist framework is uniquely focused on health maximisation, resultant resource
41 allocation may not be consistent with society’s preferences. (Dolan & Cookson
2000;Nord et al. 1995;Ubel 2001) The extra-welfarist framework has been suggested to be morally superior to the welfarist approach. As the assigned value of health is
independent of the distribution of wealth in society, it is considered by many to be ‘income free’. (Weinstein & Manning, Jr. 1997) Others suggest, however, that adopting cost-effectiveness analysis in preference to cost-benefit analysis does not avoid
considerations of income distribution. (Donaldson, Birch, & Gafni 2002;Gafni 2006)
The analytical method of choice when considering an extra-welfarist framework is cost-effectiveness analysis. Cost-cost-effectiveness analysis estimates the relative cost per unit of health gained across competing interventions.(Folland, Goodman, & Stano 2003;Garber & Phelps 1997) This may be in terms of the cost per disease specific unit (e.g., reduction in tumour size, reduction in ulcer healing time, etc), the cost per life year, or the cost per QALY gained, often referred to as cost-utility analysis. Cost-utility analysis is the preferred methodology for many decision makers, including national HTA bodies in the UK, Australia, Canada, and Sweden among others (Section 3.3.1). The QALY
incorporates both quality of life and life expectancy into a single unit of health, allowing for comparison across disease areas. (Brazier 2008;Drummond et al. 2005;Weinstein et al. 1996)
2.3.6. The equivalence of cost-effectiveness analysis and cost-benefit analysis
A key difference between cost-effectiveness analysis and cost-benefit analysis can be illustrated by comparing their objectives. While the objective of cost-effectiveness analysis is to determine the least costly way to achieve a goal, the objective of cost-benefit analysis is to determine whether the goal is worth achieving. (Bala, Zarkin, & Mauskopf 2002;Donaldson 1998) There have been, however, various attempts to align the two methods by grounding cost-effectiveness analysis in a welfarist framework. (Garber et al. 1996;Johannesson 1995;Johannesson & O'Conor 1997;Meltzer 1997;Phelps & Mushlin 1991)
42 Researchers have attempted to illustrate circumstances when cost-effectiveness analysis and cost-benefit analysis can be considered equivalent. (Bala, Zarkin, & Mauskopf 2002;Johannesson 1995) Johannesson M (2005) suggests that cost-effectiveness analysis can be interpreted as cost-benefit analysis when the willingness to pay (WTP) per unit of effectiveness is assumed to be constant and the same for everyone. (Johannesson 1995) Bala et al. (2002) suggest less restrictive conditions; WTP for health gain needs to be the same in each patient subgroup, and that the WTP per unit of health gain and the
magnitude of health gain achieved from treatment for a random individual in a given subgroup are independent random variables. (Bala, Zarkin, & Mauskopf
2002;Johannesson 1995)
It has been suggested that an explicit valuation of a unit of health outcome, e.g., the QALY, converts an ICER calculation into a quasi-net benefit criterion. (Drummond et al. 2005) However, the net benefit approach is ‘quasi’ cost-benefit analysis as its theoretical underpinnings remain grounded in an extra-welfarist rather than a welfarist framework; society’s valuation of a QALY is preceded by the assumption that the sole objective of resource allocation is QALY maximisation. Further, it also does not avoid the question of how to value a QALY. (Brouwer et al. 2008)
43
2.4.
Using economic evidence to inform resource allocation
The primary purpose of economic evaluation is to help decision makers address problems due of scarcity in health care resources. (Bryan, Williams, & McIver 2007) Sweden, Australia, and Ontario, Canada were among the first jurisdictions to use economic evaluation to inform health care resource allocation. (O'Donnell et al. 2009) Now, many countries have institutions that consider economic evidence for new and established interventions as a precursor to coverage and reimbursement decisions, or to issue recommendations for the efficient use of health care technology. (Clement et al. 2009;ISPOR 2011;Raftery 2008) Cost-effectiveness analysis, with QALYs as the preferred outcome measure, is the predominant methodology with the Pharmaceutical Benefits Advisory Committee (PBAC) in Australia and NICE in the UK among HTA agencies that require such information. (NICE 2008a;PBAC 2010)
Clinical trials often provide incomplete or insufficient information for decision makers. It is often infeasible for a clinical trial to include all competing interventions, be of sufficient duration, and to include all relevant endpoints. (Drummond et al. 2005) Consequently, the use of decision analytic models has become commonplace as decision makers synthesise evidence into a single analytic framework to inform resource
allocation.
Economic evaluation in health care has been defined as, “the comparison of alternative options in terms of their costs and consequences”. (Drummond et al. 2005) Costs and consequences should be evaluated over an appropriate time horizon, i.e., one over which costs and consequences are likely to differ and thus are discounted accordingly. The fundamental aspects of an economic evaluation are presented in Figure 1.
44
Figure 1. The fundamentals of economic evaluation (Drummond et al. 2005)
An economic model’s structure is dependent on the clinical analytical problem. For example, decision trees are appropriate for acute clinical conditions, i.e., those for which a clinical resolution is reached in a short timeframe. Alternatively, Markov models can be used for chronic conditions where patients progress through a number of clinical, or Markov, states over a longer period of time. (Barton, Bryan, & Robinson 2004;Briggs, Claxton, & Sculpher 2006;Drummond et al. 2005) Other more complex structures are appropriate in certain circumstances. (Caro, Moller, & Getsios 2010;Duintjer Tebbens et al. 2008)
Cost-effectiveness is typically expressed using an incremental cost-effectiveness ratio (ICER). An ICER is the ratio of the difference in costs to the difference in effects between two competing interventions. The ICER can be formulated as follows:
Choice between intervention A and intervention B Intervention B Intervention A Cost of A Cost of B Consequence of A Consequence of B
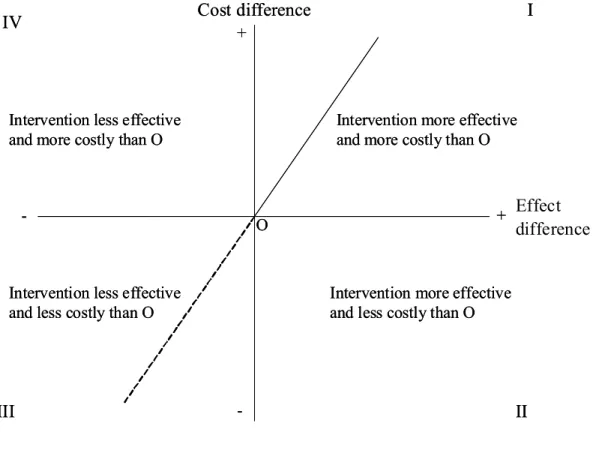
45 The findings of cost-effectiveness analysis can be presented using a cost-effectiveness plane with each quadrant representing a potential outcome (Figure 2). Interpretation is clear when study findings fall in quadrant II or IV. In quadrant II the intervention is dominant, i.e., more effective and less costly than its comparator. In quadrant IV the intervention is dominated, i.e., less effective and more costly than its comparator. However, in order to interpret a study outcome when it falls in quadrants I (intervention is more effective and more costly than the comparator) or III (intervention is less effective and less costly than the comparator) is less straightforward as the decision maker must have some preference for the value of their chosen unit of health gain (e.g., a QALY). This valuation is referred to as the cost-effectiveness threshold (Section 2.6). (Buxton 2005;Eichler et al. 2004;McCabe, Claxton, & Culyer 2008)
Figure 2. Cost-effectiveness plane (Black 1990)
Effect difference + + -I IV III II Cost difference O Intervention less effective
and more costly than O
Intervention more effective and more costly than O
Intervention less effective and less costly than O
Intervention more effective and less costly than O + + -I IV III II Cost difference O Intervention less effective
and more costly than O
Intervention more effective and more costly than O
Intervention less effective and less costly than O
Intervention more effective and less costly than O