University of Mississippi
eGrove
Honors Theses Honors College (Sally McDonnell Barksdale
Honors College)
2019
A Synopsis of Basic Components of Accounting
Julius Jordan Boyd
University of Mississippi
Follow this and additional works at:https://egrove.olemiss.edu/hon_thesis Part of theAccounting Commons
This Undergraduate Thesis is brought to you for free and open access by the Honors College (Sally McDonnell Barksdale Honors College) at eGrove. It has been accepted for inclusion in Honors Theses by an authorized administrator of eGrove. For more information, please [email protected]. Recommended Citation
Boyd, Julius Jordan, "A Synopsis of Basic Components of Accounting" (2019).Honors Theses. 1142.
A SYNOPSIS OF BASIC COMPONENTS OF ACCOUNTING
by
Julius Jordan Boyd
A thesis submitted to the faculty of The University of Mississippi in partial fulfillment of the requirements of the Sally McDonnell Barksdale Honors College.
Oxford May 2019
Approved by
___________________________________ Advisor: Dr. Victoria Dickinson
___________________________________ Reader: Dr. W. Mark Wilder
© 2019 Julius Jordan Boyd ALL RIGHTS RESERVED
This thesis is dedicated to my parents, Julius and Tammy Boyd. Their investment in my education has been the greatest gift I have ever received and I will cherish forever.
TABLE OF CONTENTS
Abstract Page 5
Case I: Glenwood Heating, Inc. and Eads Heaters, Inc Page 6
Case II: Molson Coors Brewing Company Page 16
Case III: Pearson plc Page 24
Case IV: Aero Company Page 34
Case V: Palfinger AG Page 41
Case VI: Volvo Group Page 51
Case VII: Tableau Page 60
Case VIII: Rite Aid Page 67
Case IX: Merck & Co., Inc. Page 76
Case X: State Street Corporation Page 85
Case XI: ZAGG, Inc. Page 94
Abstract
The purpose of this paper is to discuss different components of accounting and discuss how they appear on financial statements. These topics are ones that accountants run into everyday while on the job. Each case covers a company or companies and focuses on one of the major themes of the accounting process for that company. Along with this it also gives us a set of scenarios to discuss. These scenarios forced me to dive deeper into the financial statements to see how this is related to the United States
generally accepted accounting principles. These cases go far beyond the everyday journal entries we see perceived most accountants doing.
In 20X1, Glenwood Heating, Inc. and Eads Heaters, Inc. began operations of selling home heaters. In the beginning, both companies had identical transactions to start their companies, but along the way began to differentiate themselves from one another with usage of different principles, both recognized under U.S. GAAP. With the
comparing and contrasting of each company’s Income Statement, Retained Earnings, and Balance Sheet I will present the first year’s reports for the two companies.
The observation of similar companies in the same industry helps future investors analyze the specifics of a company and to make suggestions for each. With Eads, they took a conservative approach, but it hindered their first-year earnings, which are vital for a company in the first year. Glenwood took a riskier path which makes their first-year report look amazing, but also can be a major risk factor for some more conservative investors
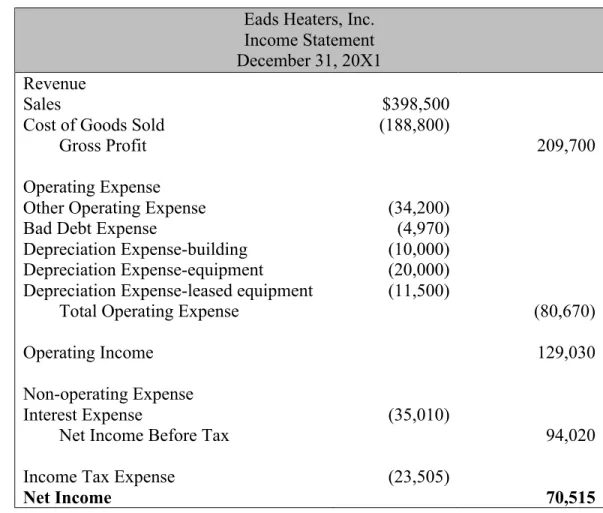
Table 1.1 Eads Heaters Income Statement
Eads Heaters, Inc. Income Statement December 31, 20X1 Revenue
Sales $398,500
Cost of Goods Sold (188,800)
Gross Profit 209,700
Operating Expense
Other Operating Expense (34,200)
Bad Debt Expense (4,970)
Depreciation Expense-building (10,000) Depreciation Expense-equipment (20,000) Depreciation Expense-leased equipment (11,500)
Total Operating Expense (80,670)
Operating Income 129,030
Non-operating Expense
Interest Expense (35,010)
Net Income Before Tax 94,020
Income Tax Expense (23,505)
Table 1.2 Glenwood Heating Income Statement
Glenwood Heating, Inc. Income Statement December 31, 20X1 Revenue
Sale $398,500
Cost of Goods Sold 177,000
Gross Profit 221,500
Operating Expense
Other Operating Expense (34,200)
Bad Debt Expense (994)
Depreciation Expense-building (10,000) Depreciation Expense-equipment (9,000)
Rent Expense (16,000)
Total Operating Expense (70,194)
Operating Income 151,306
Non-operating Expense:
Interest Expense (27,650)
Net Income Before Tax 123,656
Income Tax Expense (30,914)
Net Income $92,742
Both companies had the same sales on record, but for Cost of Goods Sold Glenwood used the FIFO method while Eads used the LIFO method. This is one of the main causes of why their Income Statements are not the same. This, however, does not mean that overtime Glenwood will always have higher Net Income than Eads, but for the first year of business, the prices of the goods were lower at the beginning of the period and higher at the end of the period giving Glenwood and lower Cost of Goods Sold. Eads and Glenwood also used a different rate to calculate Bad Debt Expense. Eads went more conservative and measure 5% of ending Accounts Receivable compared to Glenwood’s estimated 1%. Another difference is in allocated depreciation in the equipment;
depreciation for the equipment will equal out overtime, but for the first year it takes a really big toll on the Income Statement.
Table 1.3 Eads Heaters Statement of Retained Earnings
Eads Heaters, Inc. Statement of Retained Earnings Year Ended December 31, 20X1
Beginning Retained Earnings -
Plus: Net Income $70,515
Less: Dividends (23,200)
Ending Retained Earnings 47,315
Table 1.4 Glenwood Heating Statement of Retained Earnings
Glenwood Heating, Inc. Statement of Retained Earnings Year Ended December 31, 20X1
Beginning Retained Earnings -
Plus: Net Income $92,742
Less: Dividends (23,200)
Ending Retained Earnings 69,542
The retained earnings are still being affected the same way the Income Statement was being affected. We were told that both companies have the same Dividends Declared amount. Also the Earnings per Share rates are $28.98 for Glenwood and $22.04 for Eads. For an investor they would obviously want to invest in the company where they would earn more money. Overtime, these rates will seemingly become closer, but Glenwood’s riskier move made them seem more investable after their first-year of operation.
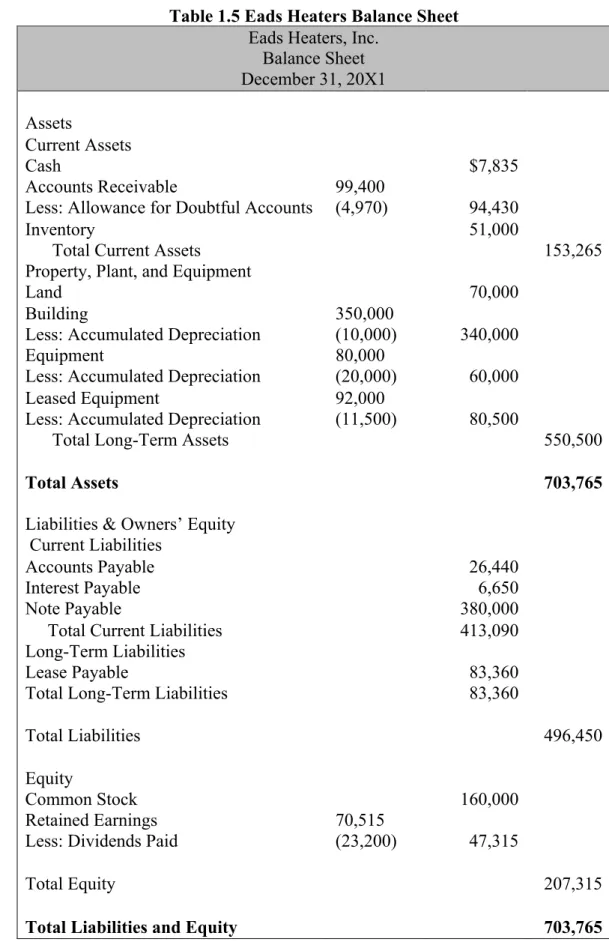
Table 1.5 Eads Heaters Balance Sheet
Eads Heaters, Inc. Balance Sheet December 31, 20X1 Assets Current Assets Cash $7,835 Accounts Receivable 99,400
Less: Allowance for Doubtful Accounts (4,970) 94,430
Inventory 51,000
Total Current Assets 153,265
Property, Plant, and Equipment
Land 70,000
Building 350,000
Less: Accumulated Depreciation (10,000) 340,000
Equipment 80,000
Less: Accumulated Depreciation (20,000) 60,000
Leased Equipment 92,000
Less: Accumulated Depreciation (11,500) 80,500
Total Long-Term Assets 550,500
Total Assets 703,765
Liabilities & Owners’ Equity Current Liabilities
Accounts Payable 26,440
Interest Payable 6,650
Note Payable 380,000
Total Current Liabilities 413,090
Long-Term Liabilities
Lease Payable 83,360
Total Long-Term Liabilities 83,360
Total Liabilities 496,450
Equity
Common Stock 160,000
Retained Earnings 70,515
Less: Dividends Paid (23,200) 47,315
Total Equity 207,315
Table 1.6 Glenwood Heating Balance Sheet
Glenwood Heating, Inc. Balance Sheet December 31, 20X1 Assets Current Assets Cash $426 Accounts Receivable 99,400
Less: Accounts for Doubtful Accounts (994) 98,406
Inventory 62,800
Total Current Assets 161,632
Property, Plant, and Equipment
Land $70,000
Building $350,000
Less: Accumulated Depreciation $(10,000) $340,000
Equipment $80,000
Less: Accumulated Depreciation $(9,000) $71,000
Total Long-Term Assets $481,000
Total Assets $642,632
Liabilities & Owners’ Equity Current Liabilities
Accounts Payable $26,440
Interest Payable $6,650
Note Payable $380,000
Total Current Liabilities $413,090
Equity
Common Stock $160,000
Retained Earnings $92,742
Less: Dividends Paid $(23,200) $69,542
Total Equity $229,542
Total Liabilities and Equity $642,632
In the Balance Sheet we discovered more of the inner workings of the company. As it is concerning that Glenwood only has $426 in cash on hand, I still feel that this would be the better company to invest in. Eads is greatly affected by the Leased
Equipment they have at the moment and even though it does raise their overall Assets, it also brings up their Liabilities.
APPENDIX 1: Supportive Graphs and Charts for Tables 1.1-1.6
1.a Home Heaters Records of Transactions
Home Heaters
Recording basic transactions Transactions Cash Accounts
Receivable
Inventory Land Building Equipment No. 1 $160,000 No. 2 $400,000 No. 3 $(420,000) $70,000 $350,000 No. 4 $(80,000) $(80,000) No. 5 $239,800 No. 6 $398,500 No. 7 $299,100 $(299,100) No. 8 $(213,360) No. 9 $(41,000) No. 10 $(34,200) No. 11 $(23,200) No. 12 Balances $47,340 $99,400 $239,800 $70,000 $350,000 $80,000 = Transactions Accounts
Payable Payable Note Payable Interest + Common Stock Retained Earnings
No. 1 $160,000 No. 2 $400,000 No. 3 No. 4 No. 5 $239,800 No. 6 $398,500 No. 7 No. 8 $(213,360) No. 9 $(20,000) $(21,000) No. 10 $(34,200) No. 11 $(23,200) No. 12 $6,650 $(6,650) Balances $26,440 $380,000 $6,650 $160,000 $313,450
1.b Home Heaters Unadjusted Trial Balance
Home Heaters Unadjusted Trial Balance
Debits Credits Cash $47,340 Accounts Receivable 99,400 Inventory 239,800 Land 70,000 Building 350,000 Equipment 80,000 Accounts Payable 26,440 Note Payable 380,000 Interest Payable 6,650 Common Stock 160,000 Dividend 23,200 Sale 398,500
Other Operating Expense 34,200
Interest Expense 27,650
In the case, we look at the Molson Coors Brewing Company and assessed many attributes of their income statement. We started by defining different parts of the income statement before we assessed the given statements from Molson Coors. Molson Coors is the seventh largest brewing company and is worth around $5 billion. Since being worth so much, their income statement was quite intricate.
I focused on the cash flow of the company and the return of net operating assets. This is basically the income the company generates. In the business world, this is highly important and a huge factor investors look at when they are deciding in what company to invest in. If a company has a high return of net operating assets that usually means the company is working well and a safe one to invest in. In this study, I addressed where Molson Coors Brewing Company was performing well and also the differences that were in their statements.
A. Major Classifications of Income Statement include:
1. Operating Section: First part of the Income Statement that reports the revenues and expenses of the company’s major operations.
(a) Sales or Revenue: This subsection presents sales, discounts, allowances, returns, and other related information. Its main purpose is to get to net amount of sales revenue.
(b) Cost of Goods Sold: This subsection shows the cost of goods that were sold to produce the sales. Once Cost of Goods Sold is found, you subtract it from net sales to get Gross Profit.
(c) Selling Expense: This subsection details the expenses that arise from the company’s attempt to create sales.
(d) Administrative or General Expenses: The subsection list expenses the company’s general administration.
2. Non-operating Section: Second part of the Income Statement that reports the revenues and expenses resulting from secondary activities of the company. In addition, special gains and losses that are infrequent or unusual are normally reported in this section. Generally these items break down into two main subsections.
(a) Other Revenues and Gains: A list of the revenues recognized and gains incurred during the period, generally net of related expenses, from non-operating transactions.
(b) Other Expenses and Losses: A list of the expenses or losses
incurred, generally net of any related incomes, from non-operating transactions.
3. Income Tax: Third part of the Income Statement that reports federal and state taxes imposed on the company’s income from continuing operations.
4. Discontinued Operations: Fourth part of the Income Statement that lists material gains or losses from the disposal of a component of the business.
5. Noncontrolling Interest: Fifth part of the Income Statement that allocates income to noncontrolling shareholders.
6. Earnings per Share: Sixth and final part of the Income Statement that measures the performance of the company during the reporting period.
B. Reason why under U.S. GAAP companies are supposed to provide “classified” income statement.
US companies are required to provide classified income statements in accordance with U.S. GAAP to provide transparency in the interworking of the accounting process of a given company. The classified balance sheet first and foremost breaks down a company’s assets into long-term and current assets. This shows the liquidity of the company or its ability to satisfy short-term debts. The classified income statements also break down a company’s operations even more and can be compared to other company’s to see how they match up in operations and other crucial points. In short, it has the income a company has made over a period of time rather than over the life of the company. It also has it listed in a way investors and directors can understand and clearly see how the company is doing operating wise.
C. Why financial statement users be interested in persistent income?
A financial statement user would be interested in a company’s persistent income because they would have a vested interest in whether a company’s earnings are
sustainable from year to year. It is more dependable for the future because it factors in random events that could have spiked income or lowered it.
D. Definition of Comprehensive Income and difference from net income
Comprehensive Income is a statement of all income and expenses recognized during a specific period. It provides an overview of sales and expenses, including taxes and
interest. Comprehensive Income includes all the gains and losses of a company that make up their net income, but it also includes all the gains and losses in the stockholder’s equity as well.
E. The income statement reports “Sales” and “Net sales.” What is the difference? Why does Molson Coors report these two items separately?
Molson Coors reports Sales and Net Sales on their income statement because of the excise tax. An excise tax is a tax on a good collected for the selling or shipping of the good. Molson Coors has put in their notes that this excise tax was from the shipping of the beer. This tax goes straight to the government from the purchasing of the product so Molson Coors chose to take out this tax at sales so they wouldn’t overstate Net Sales.
F. Consider the income statement item “Special items, net” and information in Notes 1 and 8.
i.In general, what types of items does Molson Coors include in this line item?
Molson Coors lists employee-related charges, impairments, unusual items, termination fees and other gains and losses under Special Items. These types of items are most commonly impairments of intangible assets specifically in the abroad offices in Europe and Canada.
ii. Explain why the company reports these on a separate line item rather than including them with another expense item. Molson Coors classifies these special items as operating expenses. Do you concur with this classification? Explain.
Special items are listed on a different line item than other expenses so the company can differentiate these expenses from the others and also show how irregular they are too. These are separated to provide the user the proper information for comparability of financial statements within the company’s year-to-year reports.
G. Consider the income statement item “Other income (expense), net” and the information in Note 6. What is the distinction between “Other income (expense), net” which is classified a non-operating expense, and “Special items, net” which Molson Coors classifies as operating expenses?
Other Income Expenses are gains and losses that are associated with activities not directly related to the everyday operations of the company. These include facility fees, currency conversion gains and losses, and gain on sale of non-operating assets. The difference between Other Income Expense and Special Items is that Income Expenses are very frequent and usually happen every period while Special Items are infrequent and rarely happen. When they do happen they still must be documented, but they are documented in their own line to show a user that these gains and losses are necessarily normal for the organization.
H. Refer to the statement of comprehensive income.
i. What is the amount of comprehensive income in 2013? How does this amount compare to net income in 2013?
Comprehensive Income in 2013 is $765.4 million while net income is $572.5 million. Net income is lower because it does not factor in the non-operating gains. In the case of
Molson Coors, they are not realizing foreign currency adjustment, pension adjustments, and unrealized gains. The Comprehensive Income focuses on the change in owner’s equity by definition and Net Income focuses on the revenue and expenses of the
company. Net Income is actually a part of Comprehensive Income, but Comprehensive Income also factors in other events and transactions throughout the period that effects owner’s equity too.
ii. What accounts for the difference between net income and comprehensive income in 2013? In your own words, how are the items included in Molson Coors’ comprehensive income related?
There is a $188.7 million difference in the two accounts. This difference comes from accounts that are factored into the Comprehensive Income and not Net Income. These accounts are foreign currency adjustments, pension adjustments, and unrealized gains. These accounts are classified as non-operating gains and they are not in Net Income because Net Income only focuses on the operating income of the business.
J. What is Molson Coors’ effective tax rate in 2013?
Molson Coors’ effective tax rate is 12.8 percent in 2013. This is calculated by dividing the income tax expense (84 million) by total pretax income (654.5 million). Both of these numbers are found in Note 7 on the report.
This case study focuses on the receivables Pearson plc has. Pearson plc is a British company that educational publishing. This company published many academic books. Pearson plc, being in the sales industry, has a great amount of accounts receivable so they are a prime company to hone in on.
With the accounts receivable, I first defined the term and also the close relative to this accounts, notes receivable. After this I discussed the differences between the two. Once the difference was stated, I think took pieces of Pearson plc’s financials and analyzed from the standpoint of receivables. After that I have followed the directions of the case and have broken down the analysis of the different of accounts receivables and explained the differences.
In this case, I learned how big of an umbrella account receivable really is. There is many business components that flow in and out of this account and it is shown through this case. I also tried to promote the importance of proper ledger labeling for this account. In my research of accounts receivable, I found how many companies struggle with the proper labeling of the actions that are happening to this account.
a. What is an account receivable? What other names does this asset go by? Account Receivable is a current asset account that total represents the sales incurred by a company made on credit but expect a cash equivalent of this amount in the recent future. This account is paired with Sales Revenue. Another name for this account would be Trade Receivables which presents an amount to be collected in the near future for a product or service.
b. How do accounts receivable differ from notes receivable?
Notes Receivable refer to the amount to be collected from crediting or allowing a customer to borrow whereas Accounts Receivable refers to the amount to be collected from a sell of an item on credit. Accounts Receivable is more sell oriented while Notes Receivable is more lending oriented. Notes Receivable can also be a long-term asset while Accounts Receivable is always a current asset. This hinges on the agreement between the borrower and the lender of the note and how and when they will pay the note back. Notes receivable are often interest bearing whereas accounts receivable are not.
c. What is a contra account? What two contra accounts are associated with Pearson’s trade receivables (see Note 22)? What types of activities are captured in each of these contra accounts? Describe factors that managers might consider when deciding how to estimate the balance in each of these contra accounts.
associated with. This will lower the net of the main account, while showing where the reduction is. Pearson’s two contra accounts are Allowance for Doubtful Accounts and Allowance for Sales Returns and Allowances. Allowance for Doubtful Accounts is a contra-asset account for Accounts Receivable and it is to show the estimated amount that the company will not collect from their receivables. Allowance for Sale Returns and Allowances is a contra-revenue account for Sales Returns and Allowances for returns on sales for whatever reason. Managers may consider a multitude of factors when
establishing these accounts. They are both an estimate, but he/she may look at prior periods and see how many receivables were not collected or how many returns were made and also the general economy environment. They also have to consider that whatever amount they establish will lower their net income since it will be lowering net Accounts Receivable and Sales Revenue.
d. Two commonly used approaches for estimating uncollectible accounts receivable are the percentage- of-sales procedure and the aging-of-accounts procedure. Briefly describe these two approaches. What information do managers need to determine the activity and final account balance under each approach? Which of the two approaches do you think results in a more accurate estimate of net accounts receivable?
Percentage-of-sales procedure is estimating the amount that won’t be collected based on historical accounts that have remained uncollectable. A manager would look back on prior periods to see the percent of accounts receivable were unpaid. They would then use the same percent or a different if they seem deemed based on the current state of the
economy. With the aging-of-accounts method they see how far an account is left unpaid and use a percent per age of these accounts. The manager would need prior period records for both; for percentage-of-sales they would need to see the amount left unpaid while the aging-of-accounts they would the date in which each accounts receivable was recorded first. I believe aging-of-accounts is more accurate since it is giving each age category a different percent rather than a broad percentage for all outstanding accounts receivables. Aging-of-accounts is also accounts specific which makes it easier to assess each account while percentage-of-sales is not accounts specific but just a broad number that correlates with prior period research.
e. If Pearson anticipates that some accounts will be uncollectible, why did the company extend credit to those customers in the first place? Discuss the risks that managers must consider with respect to accounts receivable.
While Pearson does not want to have uncollectible accounts, it is almost impossible to not have. Pearson still extends credit to these customers is sometimes they simply do not know that they won’t pay their accounts payable to them. If it a customer that has had uncollectible accounts in the past they may not extend the credit offer, but if they do they may do it with higher consequences. Also they may extend credit because it shows that Pearson is flexible and can take the risks on some accounts going uncollectible. This flexible is likes by potential investors.
f. Note 22 reports the balance in Pearson’s provision for bad and doubtful debts (for trade receivables) and reports the account activity (“movements”) during the year ended December 31, 2009. Note that Pearson refers to the trade
receivables contra account as a “provision.” Under U.S. GAAP, the
receivables contra account is typically referred to as an “allowance” while the term provision is used to describe the current-period income statement charge for uncollectible accounts (also known as bad debt expense).
i. Use the information in Note 22 to complete a T-account that shows the activity in the provision for bad and doubtful debts account during the year. Explain, in your own words, the line items that reconcile the change in account during 2009.
The credit of 72 is the beginning balance of the account during the year 2009. It is also the ending balance of the account in 2008, which will roll over into 2009. The Debit of 5 is for the currency exchange difference. Pearson, plc is a company based in the United Kingdom where the currency is the Pound (£). This entry is accounting for the Bad Debt that happened with transactions abroad and this is showing the exchange rate difference from the country’s currency to the English Pound. Pearson actually had £5 million less when they calculated the foreign Bad Debt into Pounds. The 26 Credit is the Bad Debt Expense that affects the Income Statement. This is transaction is for the accounts that
Provision for Bad and Doubtful Debts (in millions)
72 26 3 76 5 20
have not been paid for but the Pearson is budgeting that 26 million of them won’t be paid for. The Debit of 20 is to account for the Bad Debt that we do not think we will ever collect. We must clear this amount off of all our books because that amount will never be collected. The Credit of 3 is from the Bad Debt Pearson took on from acquisitions of other companies that they have a share in.
ii. Prepare the journal entries that Pearson recorded during 2009 to capture 1) bad and doubtful debts expense for 2009 (that is, the “income statement movements”) and 2) the write-off of accounts receivable (that is, the amount “utilised”) during 2009. For each account in your journal entries, note whether the account is a balance sheet or income statement account. 1.) Bad Debt Expense £26,000,000
Provision for Bad and Doubtful Debts 26,000,000
-Bad Debt Expense is an income statement account
-Provision for Bad and Doubtful Debts is a balance sheet account
2.) Provision for Bad and Doubtful Debts £20,000,000
Accounts Receivable 20,000,000
-Provision for Bad and Doubtful Debts is a balance sheet account -Accounts Receivable is a balance sheet account
iii. Where in the income statement is the provision for bad and doubtful debts expense included?
Bad and Doubtful Debts Expense is included in the operating expense on the Income Statement
g. Note 22 reports that the balance in Pearson’s provision for sales returns was £372 at December 31, 2008 and £354 at December 31, 2009. Under U.S. GAAP, this contra account is typically referred to as an “allowance” and reflects the company’s anticipated sales returns.
i. Complete a T-account that shows the activity in the provision for sales returns account during the year. Assume that Pearson
estimated that returns relating to 2009 Sales to be £425 million. In reconciling the change in the account, two types of journal entries are required, one to record the estimated sales returns for the period and one to record the amount of actual book returns.
ii. Prepare the journal entries that Pearson recorded during 2009 to Provision for Sales Returns
372 425
354 443
capture, 1) the 2009 estimated sales returns and 2) the amount of actual book returns during 2009. In your answer, note whether each account in the journal entries is a balance sheet or income statement account. 1.) Sales Returns and Allowances £425,000,000
Provision for Sales Returns 425,000,000
-Sales Returns and Allowances is an Income Statement accounts -Provisions for Sales Returns is a Balance Sheet account
2.) Provisions of Sale Returns £443,000,000
Trade Receivables 443,000,000 -Provision of Sales Returns is a Balance Sheet account
-Trade Receivables is a Balance Sheet account
iii.In which income statement line item does the amount of 2009 estimated sales returns appear?
Estimated sales returns shows up in the Sales line of the Income Statement. h. Create a T-account for total or gross trade receivables (that is, trade
receivables before deducting the provision for bad and doubtful debts and the provision for sales returns). Analyze the change in this T-account between December 31, 2008 and 2009. (Hint: your solution to parts f and g will be useful here). Assume that all sales in 2009 were on account. That is, they are
all “credit sales.” You may also assume that there were no changes to the account due to business combinations or foreign exchange rate changes. Prepare the journal entries to record the sales on account and accounts receivable collection activity in this account during the year.
The beginning balance is £1,474,000,000, which in the ending balance of this account in 2008. The deduction of 20 on the second line is from the account where we are assuming we will not collect any of debt of this amount (also seen in F(i)). The 5,624 is all the credit sales recorded during the period. We also have a crest to Sales Revenue for this as well. The 443 deduction is for all the sales returns during 2009. This amount is also credited to trade receivables to remove that receivable amount. The 5216 deduction is from receipts of credit sales payment during the period. This will also include a debit entry to the cash account.
Gross Trade Receivable 1474 5624 1419 20 443 5216
In the case we were to look at the financials for Aero Company. This problem came from our Intermediate Accounting Textbook. In this problem, we were given information about the company and we were supposed to create the Statement of Cash Flow and Balance Sheet from the information. This was a very real world problem for most accountants. Creating and knowing what to look for in the financial information is very tricky sometimes when creating these statements. At the beginning I have posted the limited information we were given and then to follow are the two statements I created along with an explanation and key for calculations.
The Introductory information for Aero Inc. is given as follow on December 31st, 2016: AERO INC.
Balance Sheet December 31st, 2016
Cash $20,000 Accounts Payable $30,000
Accounts Receivable 21,200 Bonds Payable 41,000
Investments 32,000 Common Stock 100,000
Plant assets (net) 81,000 Retained Earnings 23,200
Land 40,000
$194,200 $194,200
The left and the right side should always be equal since Assets equal Liabilities plus Equity (A=L+E).
The next part, we are told that these 7 actions occurred during the year of 2017.
1. Aero liquidated its available-for-sale debt investment portfolio at a loss of $5,000 2. A tract of land was purchased for $38,000
3. An additional $30,000 in common stock was issued at par
4. Dividends totaling $10,000 were declared and paid to stockholders
5. Net income for 2017 was $35,000, including $12,000 in depreciation expense 6. Land was purchased through the issuance of $30,000 in additional bond 7. At December 31, 2017, Case was $70,200, Accounts Receivable was $42,000,
and Accounts Payable was $40,000
AERO INC.
Statement of Cash Flows
For the Year Ended December 31, 2014 Cash flows from operating activities
Net income
Adjustments to reconcile net income to net cash provided by operating activities
$35,000
Depreciation expense $12,000
Loss on sale of investments 5,000 Increase in accounts payable
($40,000 – $30,000)
10,000 Increase in accounts receivable
($42,000 – $21,200) (20,800) 6,200 Net cash provided by operating activities 41,200 Cash flows from investing activities
Sale of investments 27,000
Purchase of land (38,000)
Net cash used by investing activities (11,000)
Cash flows from financing activities
Issuance of common stock 30,000
Payment of cash dividends (10,000)
Net cash provided by financing activities 20,000
Net increase in cash 50,200
Cash at beginning of year 20,000
Cash at end of year $70,200
Noncash investing and financing activities
Land purchased through issuance of $30,000 of bonds
To put together the table above, you must consider all the information the
problem gives you. A cash flow is split in 3 different categories: operating, investing, and financing as seen above. In the operating section, you begin with Net Income and in #5 it was stated to be $35,000. After that you take into consideration depreciation expense and
gains and losses. Also in #5, it was disclosed that there was $12,000 of depreciation expense that you would add back to the operating activities. I, however, have it set up to where all things that will change Net Income are thrown into a lump sum and then added at the end. You may choose to do this however you want, but I find it easier to list them all out, record them in their own row, and then either add or subtract to the Net Income. Loss of sale of investment will also be added back and that total was $5,000 as stated in #1. Then you will look at Accounts Payable and Accounts Receivable. We find that in Accounts Payable there is an increase of $10,000 from using the 2016 End of the Year number and the 2017 End of the Year number in #7. When Accounts Payable Increases, we add it back to Net Income. In Accounts Receivable, there is a increase of $20,800 by using the End of Year numbers for 2016 and 2017 found in the introduction. When Accounts Receivable increases, we subtract it from the total. When adding depreciation expense, loss on sale of equipment, change in accounts payable, and subtracting the change in accounts receivable, we get a total of $6,200 to add to Net Income giving us $41,200 in cash from operating activities.
Next up we have investing activities. In #1, we see they sold their investments for a lost of $5,000, which means they sold them at $27,000. We would then consider the purchase of land that was stated in #2 of $38,000 that would decrease the cash flow. This would ultimately give us a total of $11,000 to subtract from cash flow.
The final part of the statement of cash flows is financing activities. This is just the issuance of common stock during the period ($30,000 given to us in #3) minus dividends paid ($10,000 giving in #4). We have a net total of $20,000 in financing activity that we will combine with the other totals.
So now we have the 3 sums for each section; $41,200, (11,000), and 20,000. By combining them we get a total of $50,200 for the net increase of cash during the period. To find cash flow for year-end we would then take the $50,200 and the cash on hold at the beginning of the period of $20,000 and get a total of $70,200.
b. The unclassified balance sheet would look as followed AERO INC. Balance Sheet December 31, 2014
Assets Liabilities and Stockholders’ Equity
Cash $ 70,200 Accounts payable $ 40,000
Accounts receivable Plant assets (net) Land 42,000 69,000 108,000 $289,200 (1) (2) Bonds payable Common stock Retained Earnings 71,000 130,000 48,200 $289,200 (3) (4) (5)
Calculations for Balance Sheet: (1) $81,000 – $12,000
Original Plant assets – depreciation expense
(2) $40,000 + $38,000 + $30,000
Original land value + land purchased + land purchased with issuance of stock
(3) $41,000 + $30,000
Original bonds payable + issuance of bond for land
(4) $100,000 + $30,000
Common Stock total + common stock issued
(5) $23,200 + $35,000 – $10,000
Palfinger AG is an Austrian company that specializes in hydraulic lifting and other crane systems for construction. Because of the size of Palfinger, they have a fair amount of property, plant, and equipment (PPE). In this case we focused on the PPE of Palfinger and their financials
PPE is much of a company’s asset. Without PPE companies could not produce, build, or sale anything. This is basically the bones of an organization. Because PPE is so valuable, there are many regulations and rules to it when it comes to the accounting standpoint. In this case, we studied how PPE for Palfinger affects the statements. PPE is either wholly owned or leased. Even with some of the wholly owned PPE, there are more rules that come with it because most companies will borrow money to purchase it.
Another factor we looked at was the depreciation that correlates to the PPE. We looked at how double-declining method and straight-line method. This is another important part of PPE because every year each PPE is depreciated based on the type of asset it is.
In this case, I found out how intricate the accounting purpose for PPE is. It is not just simply recording the cost of what you paid for it and how much money you spent on it. This is one of the most heavily documented part of a business because of the
depreciation aspect of PPE and also if there are loans attached to the asset. In this case I outlined and explained many scenarios related to the property, plant, and equipment of Palfinger and how it is reflected in the financial statements of the company.
a. Based on the description of Palfinger above, what sort of property and equipment you think the company has?
Based on the brief description, Palfinger would need a lot of steel, rubber, welding equipment, and technology specific for crane building for the sort of property and equipment they are producing. They would also have equipment that has the
capability to piece together the parts of the crane and that could screw or weld them into place.
b. The 2007 balance sheet shows property, plant, and equipment of €149,990. What does this number represent?
Property, plant, equipment on the 2007 balance sheet includes land and buildings, undeveloped, plant and machinery, fixtures, fittings, and equipment, prepayments and assets under construction. Also it also is the net amount because some of these categories have depreciated and they have taken account for that.
c. What type of equipment does Palfinger report in notes to the financial statements?
The equipment Palfinger reports are machinery inside plant, fixtures, fittings, and other equipment that will help with constructing their products they are not disclosed in the case. Anything Palfinger uses on a daily for production is reported under equipment.
d. In the notes, Palfinger reports “Prepayments and assets under construction.” What does this subaccount represent? Why does this account have no accumulated depreciation? Explain the reclassification of€14,958 in this account during 2007.
In this category, Palfinger is putting items that are under construction in it. This account basically could be called construction in progress. These are prepaid property, plant, and equipment. It is not being depreciated because it is not in use so there is no wear and tear of these items from Palfinger. Depreciation only affects the useful life of the property, plant, and equipment and in this category they are not in effect so they have not start operating or being useful to the production of products or for the Palfinger yet. The €14,958 represents property, plant, and equipment being removed from the
prepayment column into the columns that Palfinger uses for everyday use. Palfinger reclassifies these because they begin their useful life for the company and they now start depreciating these items.
e. How does Palfinger depreciate its property and equipment? Does this policy seem reasonable? Explain the trade-offs management makes in choosing a depreciation policy.
Palfinger depreciates its PPE using straight-line depreciation method. Straight-line is very simple to compute so it would be easier for the accounting department of Palfinger. The assets could be depreciated at net scrap value or zero value, which means it, can take the asset to its full depreciable cost. This policy does seem reasonable because it is declining the same amount each year and it if it is doing the same job and same activity during those years then it should be fine to depreciate it evenly. However, if Palfinger wanted they could use double-declining depreciation. This is a much more tedious calculation, but some critics argue it is more reasonable to use since it takes a certain percentage each year rather than a standard one. Some say this is better because
the company has to reevaluate the asset each year. I believe both are reasonable and do not think Palfinger needs to change unless they seem fit to.
f. Palfinger routinely opts to perform major renovations and value-enhancing modifications to equipment and buildings rather than buy new assets. How does Palfinger treat these expenditures? What is the alternative accounting treatment? Palfinger treats renovation as an expense, but can add value to this asset to increase its useful life. A value-enhancing modification is treated as an investment for Palfinger. This alters the useful life of the expected life of the PPE because they are improved from their previous state. This will also change the depreciation process since it has a new expected life. Another way Palfinger could treat is creating a new equity account rather than expensing it. Palfinger could debit the asset for the improvement and then credit a reserve account that would fall under equity. This would keep the basic accounting equation balanced. Creating new equity could affect Palfinger’s retained earnings.
g. Use the information in the financial statement notes to analyze the activity in the “Property, plant, and equipment” and “Accumulated depreciation and
impairment” accounts for 2007. Determine the following amounts;
i. The purchase of new property, plant, and equipment in fiscal 2007.
The purchases of property, plant, and equipment is €61,444. You can locate this number in the notes for the financial statements under change of PPE.
ii. Government grants for purchase of new property, plan, and equipment in 2007. Explain what these grants are and why they are deducted from the property, plant, and equipment.
Palfinger uses government grants (cash or loans from government) to purchase new PPE. Palfinger chooses to deduct these from its carrying amount from the PPE they buy with it. Palfinger records the asset at fair value because it does increase assets. The deduction is in the PPE category. This is because the government grants are in used to acquire or purchase these assets that fall under PPE. Palfinger cannot record the asset with no value because there is value that comes with the assets. The glitch is that the company itself is not using its own funds to purchase the equipment. Palfinger deducts the grant from the carrying value of the asset per IAS rules on deduction of assets obtain via government grants.
iii. Depreciation expense for fiscal 2007.
2007 Depreciation expense for Palfinger is €12,557. This is found in the notes of the financial statements under “accumulated depreciation and impairment”.
iv. The net book value of property, plant, and equipment that Palfinger disposed of in the fiscal 2007.
The net book value of the disposal of PPE in 2007 for Palfinger is €1,501. This is found by looking in the notes and taking acquisition cost of disposals and subtracting the accumulated depreciation of disposal from it. The equation is €13,799- €12,298 =
h. The statement of cash flows (not presented) reports that Palfinger received proceeds on the sale of property, plant, and equipment amounting to €1,655 in the fiscal 2007. Calculate the gain and loss that Palfinger incurred on this transaction. Hint: use the net book value you calculated in part g iv, above. Explain what this gain or loss represents in economic terms.
Palfinger saw a gain from disposing PPE, but only of €154 ($178.60). This represents the revenue Palfinger recorded for this transaction. You would calculate this by using the sale amount in the question (€1,655) and subtracting the total you got from g iv (€1,501). We calculated that number by subtracting the accumulated depreciation from the acquisition cost of the PPE. The Journal would look like:
Cash € 1,655
Accumulated Depreciation 12,298
Property, Plant, and Equipment 13,799
Gain on sale 154
The gain represents the profit Palfinger made on the selling of this PPE. The book value of the PPE was less than what they sold it for. This is a positive effect on the financial statements. It is not a large gain, but still will have an effect since the amount that PPE was worth was less than the selling cost or cost of disposal.
i. Consider the €10,673 added to “Other plant, fixtures, fittings, and equipment” during the fiscal 2007. Assume that these net assets have an expected useful life of five years and a salvage value of €1,273. Prepare a table showing the
depreciation expense and net book value of this equipment over its expected life assuming that Palfinger recorded full year of depreciation in 2007 and the
company uses:
i. Straight-Line Depreciation
ii. Double-Declining-Balance Depreciation
Year Straight-Line Double-Declining
1 €10,673- €1,273= €1,880 1/5=.2 .2(2)=.4 10,673(.4)= €4,269 2 €1,880 10,673-4269=6,404 6,404(.4)= €2,562 3 €1,880 6,404-2562=3,842 3,842(.4)= €1,537 4 €1,880 3,842-1,537=2,305 2,305(.4)= €922 5 €1,880 2,305-922=1,383 1,383-1,273= €110
If Palfinger would have different book values of the equipment depending on which method they used. With Straight-Line the net value is €8,793 and under Double-Declining it is €6,404. The depreciation expense for the PPE whole useful will be the same after 5 years under both methods. It is just the €10,673 - €1,273 or €9,400.
j. Assume that the equipment from part i. was sold on the first day of fiscal 2008 for proceeds of €7,500. Assume that Palfinger’s accounting policy is to take no depreciation in the year of sale.
i. Calculate any gain or loss on this transaction assuming that the company used straight-line depreciation. What is the total income statement impact of the equipment for the two years that Palfinger owned it? Consider the
gain or loss on disposal as well as the total depreciation recorded on the equipment (i.e. the amount from part i. i.).
Cash €7,500
Accumulated Depreciation 1,880 Loss on Sale 1,293
Equipment 10,763
Palfinger would incur a loss of 1,293 if they were using the Straight-Line Method. There is a loss because they sold the PPE for less than the net value of it. This would lower their Retained Earnings by the amount of the loss. The first year Palfinger would only have a depreciation expense on the books, but the second year they would have to record the loss. Palfinger would not record depreciation expense the second year.
ii. Calculate any gain or loss on this transaction assuming the company used double-declining- balance depreciation. What is the total income statement impact of this equipment for the two years that Palfinger owned them? Consider the gain or loss on disposal as well as the total depreciation recorded on the equipment (i.e. the amount from part i. ii.).
Cash €7,500
Accumulated Depreciation 4,269
Gain on Sale 1,096
Equipment 10,763
Palfinger would incur a gain of 1,096 if they were using the Double-Declining Method. This is because the net value of the PPE would be less than the amount it was sold for. This is not unusually since with Double-Declining, the depreciation expense is higher at the beginning on the PPE’s useful life and since this PPE has only been in
action for 1 year. In the second year they would only record the gain from the sale and you wouldn’t depreciate the PPE in the second year.
iii. Compare the total two-year income statement impact of the equipment under the two depreciation policies. Comment on the difference.
The total income statement impact for both methods is actually the same. In the Straight-Line method, the depreciation expense is lower, but there is a lost and in the Double-Declining the depreciation expense is higher, but there is a gain to counter that. Both would have a net income statement impact of 3,173. The only effect is that the gain looks somewhat better on the statement because it goes into the Retained Earnings. That can lead people to believe that Double-Declining is better, but once you take into the effect of the Depreciation Expense this seem to be good things turns out to not be that beneficial. This shows that each Depreciation Expense method doesn’t matter if you are selling the PPE. If Palfinger was going to hold on to the PPE rather than selling, the Depreciation Expense would be standard for Straight-Line and large and the beginning and small at the end for Double-Declining. Regardless, the total accumulated
The Volvo Group is a Swedish company that produces commercial vehicles and automobiles. The case focuses on the intangible assets of the financial statements from the company, mainly focus in the software and development part of the assets. The issue that came up was the Research & Development rules under U.S. GAAP and IFRS have different rules are we were to compare and contrast the two with companies: Volvo from Sweden and Navistar in the United States. Under U.S. GAAP, all research and
developments costs must be expense while the International rule is that any cost for development that helps the company financially in the future may be capitalized.
The beginning of the case was for us to familiarize with the International
Research & Development to understand the financial statements of Volvo. Then the next part was to find the numerical amounts for the research and development and the
amortization of it for Volvo. The third part was to compare the percentages we found in part 2 and compare them to a United States company and their percentage.
In this case, we found that the different standards did not the effect the percentage of Research & Development costs to net sales. I found this to be somewhat surprising because I figured the International Rule would help the non-American companies to be able to amortize some developing costs if they could prove the slightest economic benefit in the future of the find.
a. The 2009 income statement shows research and development expenses of SEK 13,193 (millions of Swedish Krona). What types of costs are likely included in these amounts?
The Volvo Group is a Swedish company that manufactures commercial vehicles. In the introduction of the case, it states that Volvo has recently been focusing on technical breakthroughs focused largely on reducing environmental impact and meeting future emissions and other regulations globally. In the research and development expense, you would probably find many researches expense for making greener cars and trucks and also expenses for developing greener parts for the vehicles. Depending on any regulations that are in place, they also may be working on other projects to modernize their products and keep them up-to-date and up to code in every country they sell in.
b. Volvo Group follows IAS 38—Intangible Assets, to account for its research and development expenditures (see IAS 38 excerpts at the end of this case). As such, the company capitalizes certain R&D costs and expenses others. What factors does Volvo Group consider as it decides which R&D costs to capitalize and which to expense?
Volvo would have to consider the following factors in determining which costs to capitalize and which to expense. One factor would be would have to be considered is the cost apart of the research or development phase. If the cost was during the research phase, it is expensed. They also expense the cost that won’t help the company in the future economically. If the expense was occurred during the development stage of a new product and Volvo can economically benefit it from in the future, then that expense can
go into the intangible asset account and be capitalized.
c. The R&D costs that Volvo Group capitalizes each period (labeled Product and software development costs) are amortized in subsequent periods, similar to other capital assets such as property and equipment. Notes to Volvo’s financial
statements disclose that capitalized product and software development costs are amortized over three to eight years. What factors would the company consider in determining the amortization period for particular costs?
Volvo would first need to consider the useful life of the R&D costs per period, just like they do in the in the PPE accounts. Going back the b, this would be found by seeing the future economic benefit of the asset (software/technology in this case) and amortize it over its expect time that it will benefit the product.
d. Under U.S. GAAP, companies must expense all R&D costs. In your opinion, which accounting principle (IFRS or U.S. GAAP) provides financial statements that better reflect costs and benefits of periodic R&D spending?
I feel that US GAAP gives the company more conservative financial statements by expensing R&D costs. This could be beneficial for the company in trying to accurately account for all its expenses. In the IFRS case, they allow for companies to capitalized on some development costs, which if the companies can precisely declare that these costs will be beneficial for the future, they may capitalize. In theory, this would be amazing, but it is so hard to accurately declare that this development costs will be beneficial in periods to come. I believe the US GAAP policy gives companies more structure in their
R&D costs, which will help prevent companies capitalizing on costs that other companies would expense.
e. Refer to footnote 14 where Volvo reports an intangible asset for “Product and
software development.” Assume that the product and software development costs reported in footnote 14 are the only R&D costs that Volvo capitalizes.
i. What is the amount of the capitalized product and software development
costs, net of accumulated amortization at the end of fiscal 2009? Which line item on Volvo Group’s balance sheet reports this intangible asset?
The software and development cost for 2009 is 25, 148 kr and the total software and development amortization is 13,739. The net software and development cost would 11,409 kr (25,148-13,739). This is reported under the assets on the balance assets specifically the intangible assets.
ii. Create a T-account for the intangible asset “Product and software development,” net of accumulated amortization. Enter the opening and ending balances for fiscal 2009. Show entries in the T-account that record the 2009 capitalization (capital expenditures) and amortization. To
simplify the analysis, group all other account activity during the year and report the net impact as one entry in the T-account.
The 12,381 kr was the beginning balance for product and software development for 2008, which will be the beginning balance for 2009. Then, we found that 2,602 kr is the capitalized amount for the period and the 3,126 kr is the amortized amount. The 448 kr is the plug to get to the final amount of 11,409 kr, which we found in the section before.
f. Refer to Volvo’s balance sheet, footnotes, and the eleven-year summary. Assume that the product and software development costs reported in footnote 14 are the only R&D costs the Volvo capitalizes.
i. Complete the table below for Volvo’s Product and software development intangible asset.
Software and Development Account 12,381 2, 602 11,409 2 1 3,126 448
(in SEK millions) 2007 2008 2009
1.) Product and software development costs capitalized during the year
2,057 2,150 1,858
2.) Total R&D expense on the income
statement 11,059 14,348 13,193
3.) Amortization of previously capitalized costs (included in R&D expense)
2,357 2,864 3,126
4.) Total R&D costs incurred during the year=1 + 2 - 3
10,759 13,634 11,925
ii. What proportion of Total R&D costs incurred did Volvo Group capitalize (as product and software development tangible asset) in each of the three years?
Percentage of R&D occurred capitalized by Volvo for software and
development 2007 2008 2009 19.4% 2,057/10,759 15.8% 2,150/13,634 15.6% 1,858/11,925
g. Assume that you work as a financial analyst for Volvo Group and would like to compare Volvo’s research and development expenditures to a U.S. competitor, Navistar International Corporation. Navistar follows U.S. GAAP that requires that all research and development costs be expensed in the year they are incurred. You gather the following information for Navistar for fiscal year end October 31, 2007 through 2009.
(In US $ millions) 2007 2008 2009
Total R&D costs
incurred during the year, expensed on the income statement
375 384 433
Net sales, manufactured products
11,910 14,399 11,300
Total assets 11,448 10,390 10,028
Operating income before tax
(73) 191 359
i. Use the information from Volvo’s eleven-year summary to complete the following table:
(In SEK millions) 2007 2008 2009
Net sales, industrial operations 276,795 294,932 208,487 Total assets, from balance sheet 321,647 372,419 332,265
ii. Calculate the proportion of total research and development costs incurred to new sale from operations (called, net sales from manufactured products, for Navistar) for both firms. How does the proportion compare between the two companies.
Navistar 2007 2008 2009
Total R&D costs 375 384 433
Net sales 11,910 14,399 11,300
Proportion of R&D costs to net sales
3.15% 2.67% 3.83%
Volvo 2007 2008 2009
Total R&D costs 10,759 13,634 11,925
Net sales 276,795 294,932 208,487
Proportion of R&D costs to net sales
3.9% 4.6% 5.7%
Volvo seems to be increasing their proportion of R&D to net sales from 2007-2009 while Navistar is staying remotely the same. With that being said, the proportions are still very similar. Before finding the percentage it seemed that Volvo was going to be much more higher, but you to keep in mind that the net sales are much higher for Volvo than Navistar.
Tableau is a computer software program that prides itself on being very user friendly and easy to use. This is a very well known program especially in the business and accounting world. In this case, I looked at the history of Tableau and also different scenarios that Tableau would be beneficial for an accountant. Tableau is so useful and I wish I could cover everything that it can do in this case, but that would be impossible.
Tableau has a very typically software program history as it was founded in the early 2000s by college students. The stated purpose of its finding was to be user friendly. After talking about its history and then talked about certain tools or knowledge a user would need to user this software.
After laying out what knowledge and tools were needed, I then listed different functions and scenarios Tableau would be helpful for an auditor, a tax consultant, and an advisor. I learned from this part is that Tableau can be useful across all spectrums of accounting and regardless if I go tax or audit I will more than likely use this program.
Lastly, I was given a task to write a letter to a partner in my accounting firm urging him/her to get Tableau to help in our practice. This was the easiest part since over the course of my investigation I was in awe of the many factors that Tableau has and how beneficial each were to a business and to an accountant. Also, this will improve client-to-accountant relation since Tableau will cut down on time for certain parts of the
accounting process. Tableau is not only useful for accountants, but also for a corporation as a whole. In the case as a whole, I learned about and highlighted the benefits of the Tableau software in regards to the accounting profession.
1. Identify the history and purpose of this tool and describe, in general, how it is used to make business decisions. Be specific about what kind of technology platform is uses, etc. and other resources that need to be in place to fully utilize the functionality of the tool.
Tableau Software was founded in 2003 in Mountain View, California with the purpose of visual aid for exploring relational database and data cubes. A unique feature about
Tableau is that it has a mapping function and able to plot latitude and longitude
coordinates. When Tableau was founded the main purpose of the software was the make data understandable to everyone. Tableau founders fused together computer graphics and databases to give the software and unique and simple look that helps users understand the data with their own technology called VizQL (Visual Query Language). Companies from Alaska Airlines to Jack Daniels use Tableau in their day-to-day operations as well as small, local companies. Tableau has moved it operations to Seattle, Washington and to this day keeps developing new software for their customers. They state that it is
important for them to keep growing and producing more technology that will make data presentations simpler to understand especially during this growing technological time.
2. What special skills are needed to use this tool to aid in business decision-making? How might a student like you gain those skills?
Tableau is very user-friendly software; this is something that the company prides itself on. I would believe student that has taken Accounting Systems (Accounting 310) or
Information Systems (MIS 309) would have the knowledge for this software. If this is not the case, there are Tableau courses that you can attend and get online if need be
sponsored by the company.
3. How, specifically, would you use the tool in the following business settings? Create at least three specific scenarios for each category in which the tool would lead to efficiency and/or better effectiveness. Be sure to describe what kinds of data your tool would use for each scenario.
a. Auditing
Tableau would be a very effective software system to use in the auditing department. One of the main benefits of Tableau for auditing is that it is very user friendly, which means that clients will understand the software and will not need a long learning period. This software will also make it easier to display data to clients since it takes data and puts it in a visual and more understanding form. These two features would make the relationship between the client and the auditor more transparent since the client would understand what the auditor was saying from these reports. Another factor in Tableau that will be helpful for auditors is the map software on it. This will make it easier to keep track of different entities for a business that are located in different areas. This will be very helpful for corporations that have multiple companies under them that are located in
different states or countries. This is helpful because it will show what codes are specific for a certain generation.
b. Tax Planning
Taxation will also benefit from Tableau. Like with auditing, the map feature will be beneficial to help keep track of where different entities are located. This will be helpful with keeping track of different tax rates in different states or countries. Also Tableau can show a tax consultant and clients what amount of the tax is going to where. What I am by this it can breakdown the whole sum of the tax paid by the company and shows where each dollar is going. This can be beneficial if the company wants to cut their budget and can show what areas of the business are cumulating more tax than others and potentially could cut costs with this. Although having no tax is possible, it can present the data to see if the company is being taxed too much for or too little. Another very helpful tool in Tableau is with payroll. You can put in each employee and their salary and it gives you the net pay you must pay them, taking out the income tax for you. This would make it easier during payroll time and also during tax season for the company.
c. Financial Statement Analysis/Valuation/Advisory
Tableau has the ability to flag potential anomalies, which is very helpful in Advisory. This can flag potential fraud for a company, which is helpful since it is predicting something that is really hard for a person to predict. Tableau can also show the
performance of the company over a period a time. This is helpful for a client because it is showing how well they are doing and can also show how they are performing in a
particular market. Also in Tableau, it can calculate popular ratios too. Unlike other
systems where you would have to calculate each part of the ratio before finding the actual rate, Tableau calculates everything for you with a click of a button. This saves time in the advising department especially if the client asks for multiple ratios for a report. If
Tableau doesn’t offer that particular ratio, you can simply program it to do so.
4. Write a few paragraphs to your future public accounting partner explaining why your team should invest in the acquisition of and training in this tool. Explain how the tool will impact the staffing and scope of your future engagements.
Mr. Smith,
I feel that my team and I would benefit from the use of Tableau in our practice. I feel this way because Tableau will help cut down on grunt work and also be very useful for our client as well. Tableau is very user friendly and safe to use and many corporations IT Department will already be capable to use it. It would help us rely our message to our client in an easier than and would also help us cut down on time spent putting reports together.
For our larger clients, it will help us keep their different entities separate. Tableau’s main feature is a map database that can help us pinpoint different entities on
the map, which will be helpful with the taxation of the company. This will also help them with their payroll period as Tableau has many payroll tools already in the software.
Smaller clients, as well, will benefit from Tableau. First and foremost, they will have an easier getting data uploaded and for us to look at it. Time is everything for a small company and the easier and less time consuming it is the better they are off.
For us having the ability to put together reports easier will also mean we will be able to have more clients. Also this will be a cost cutting effect too for our company. In this age, we have experienced an IT Revolution and the more techs savvy we become the more competitive our firm becomes too.