Citation: Gao, Bin, Li, Xiaoqing, Woo, Wai Lok and Tian, Gui yun (2018) Physics-Based
Image Segmentation Using First Order Statistical Properties and Genetic Algorithm for
Inductive Thermography Imaging. IEEE Transactions on Image Processing, 27 (5). pp.
2160-2175. ISSN 1057-7149
Published by: UNSPECIFIED
URL:
http://dx.doi.org/10.1109/TIP.2017.2783627
<http://dx.doi.org/10.1109/TIP.2017.2783627>
This version was downloaded from Northumbria Research Link:
http://nrl.northumbria.ac.uk/38217/
Northumbria University has developed Northumbria Research Link (NRL) to enable users to
access the University’s research output. Copyright
©and moral rights for items on NRL are
retained by the individual author(s) and/or other copyright owners. Single copies of full items
can be reproduced, displayed or performed, and given to third parties in any format or
medium for personal research or study, educational, or not-for-profit purposes without prior
permission or charge, provided the authors, title and full bibliographic details are given, as
well as a hyperlink and/or URL to the original metadata page. The content must not be
changed in any way. Full items must not be sold commercially in any format or medium
without formal permission of the copyright holder. The full policy is available online:
http://nrl.northumbria.ac.uk/policies.html
This document may differ from the final, published version of the research and has been
made available online in accordance with publisher policies. To read and/or cite from the
published version of the research, please visit the publisher’s website (a subscription may be
required.)
Abstract— Thermographic inspection has been widely applied to Non-Destructive Testing and Evaluation (NDT&E) with capabilities of rapid, contactless and large surface area detection. Image segmentation is considered essential for identifying and sizing defects. To attain a high level performance, specific physics-based models that describe defects generation and enable the precise extraction of target region are of crucial importance. In this paper, an effective genetic first order statistical image segmentation algorithm is proposed for quantitative crack detection. The proposed method automatically extracts valuable spatial-temporal patterns from unsupervised feature extraction algorithm and avoids a range of issues associated with human intervention in laborious manual selection of specific thermal video frames for processing. An internal genetic functionality is built into the proposed algorithm to automatically control the segmentation threshold to render enhanced accuracy in sizing the cracks. Eddy Current Pulsed Thermography (ECPT) will be implemented as a platform to demonstrate surface crack detection. Experimental tests and comparisons have been conducted to verify the efficacy of the proposed method. In addition, a global quantitative assessment index F-Score has been adopted to objectively evaluate the performance of different segmentation algorithms.
Index Terms— Thermography, Non-Destructive Testing and Evaluation, image segmentation, Genetic functionality, F-Score.
I. INTRODUCTION
n contrast to conventional NDT&E methods [1-4], infrared thermography (IRT) offers prominent advantages which include abilities to inspect over a large detection area within a short interval and provides capabilities of contactless as well as high spatial resolution [5,6]. Research on non-destructive testing (NDT) methods for fatigue crack detection has begunover the last 100 years. Magnetic Particle Testing (MT) is effective for detecting surface and near surface discontinuities. This technique has been widely adopted in industry. However, the MT testing is augmented with complicated detection process. The surface of the sample requires pretreatment and the measurement consumes relatively long duration. In addition, it pollutes the environment. IRT is applicable to a wide range of materials, including composites and metallic materials [7]. IRT is generally divided into two major groups: passive infrared thermography (PIT) and active infrared thermography (AIT) [8]. ECPT is an AIT technique developed to provide accurate information by considering the amount of thermal radiation and heat transfer for conductive material. ECPT has potential
to replace MT technique due to its rapid inspection over a large area and sensitivity with near surface defects [9, 10]. In the presence of defect, the resultant eddy current will be distorted and the heat shows an abnormal expression that increases the temperature contrast between the defective region and defect-free areas. In previous work, ECPT has been used for damage detection in metallic alloy [11], carbon fiber reinforced plastic [12] and crack detection of rolling contact fatigue of rail tracks [13]. Our previous study reported an unsupervised feature extraction algorithm on ECPT for automatic pattern separation [14]. Heet al.used time-to-peak feature for wall thinning and inner defects characterization [15]. Liu et al. proposed the thermo-optical flow entropy tracking method to trace the heat flow and characterize the degree of fatigue damage [16].
Image segmentation aims to separate the desired foreground object from background [17]. These segmentation methods are usually classified into four major categories: threshold-based, region growing, edge detection, and hybrid methods [18]. Stelios [19] proposed a local search based on genetic sequential image segmentation algorithm for the classification of remotely sensed images. Sanchezet al.[20] improved the parameters selection for an automatic multiband image segmentation on the basis of a seeded region growing-merging approach. Liu [21] presented an efficient multiscale low rank representation for image segmentation. Jian and Jung [22] presented interactive image segmentation by using adaptive constraint propagation (ACP) for semantic segmentation. Wang et al. [23] proposed the eigen-decomposition of an anisotropic diffusion operator for image segmentation. Hell [24] reported an approach to fast multi-label color image segmentation by using convex optimization techniques. Tang [25] discussed a novel sparse global/local affinity graph over superpixels of an input image to capture both short- and long-range grouping cues. Zhang [26] proposed an unsupervised FCM-based image segmentation method by paying closer attention to the selection of the local information. Noha and Leo [27] provided a contrast driven elastica model which can accommodate high curvature objects. Dong [28] presented a novel sub-Markov random walk algorithm with label prior for seeded image segmentation. Li et al. [29] proposed a segmentation approach to automatically detect cracks from magnetic tile images by using the fast discrete Curvelet transform. Tan [30] provided an image layering and confidence analysis for small target detection in infrared image. Swita [31] introduced optimization methods to
K-means segmentation algorithm for thermal images. Huang
Physics-based Image Segmentation using First
Order Statistical Properties and Genetic
Algorithm for Inductive Thermography Imaging
Bin Gao,
Senior Member IEEE
, X.Q. Li, W.L. Woo
,Senior Member, IEEE
, G.Y. Tian,
and Wu [32] employed the multilayer level set method to segment infrared thermal image for layered structures defect of carbon fiber reinforced plastic (CFRP).
In reviewing the current defect detection methods for ECPT, two major challenges have been identified. Firstly, there is a lack of capability in automating the detection and identification of cracks. Secondly, the need to improve the detectability and enhance the resolution of small cracks. The latter is the main point of achieving Quantitative NDT&E. However, most recent methods are limited to manual selection of the contrastive components. The results are acceptable but generally not predictable. The proper contrastive components have to be empirically selected. In addition, there is a lack of appropriate segmentation algorithm that takes into account the physics behavior of defects in inductive thermography. This ambiguous case prevents the use of inductive thermography imaging in automated environments. Thus, automated image segmentation for crack separation is crucially required for ECPT. This paper proposes a new method that incorporates the physics characteristics of defect behavior in IRT to derive the first order statistical properties (FOSP) of defect segmentation and utilizes the genetic algorithm to automatically adapt the statistical features for further optimization of the threshold selection. The proposed method has consistent performance and strong de-noising capability. The comparison in terms of the F-score has been undertaken for different segmentation algorithms through the real experiments. Experimental tests on man-made metal defects and natural defects have been conducted to show the validity of the proposed algorithm.
The remainder of this paper is organized as follows: Firstly, the introduction of methodology and the proposed method are presented in Section II. The results and discussion are presented in Section III. Finally, conclusions and further work are drawn in Section IV.
II. METHODOLOGY
A. Image segmentation methods (ISMs)
Typical ISMs based on threshold approach are briefly presented. These include maximum between-class variance (BCV or Otsu) [33], Iterative thresholding (IT) [34], and Hamadani [35]. These methods segment the target from the background by using a certain threshold. Other related methods consist ofK-means algorithm [36] and seeded region growing (RG) method [37].
B. Proposed FOSP-GA method
1) Physics-pattern model of inductive thermography
The infrared camera records both the spatial and the transient response of temperature variation of the specimen. This can be represented as a spatial-transient tensor Y , which has
dimension
Transient Spatial
x y
N N N
. According to Maxwell’s equations,
the theory of the electromagnetic (EM) field in the ECPT system can be deduced. When an EM field is applied to a conductive material, the temperature increases owing to
resistive heating from the induced eddy current which is known as the Joule heating. The sum of the generated resistive heat Q is proportional to the square of the magnitude of the electric current density. Current density, in turn, is proportional to the electric field intensity vector E . The following equation expresses this relationship:
2 2 0 0 1 1 where 1 s Q J E T T (1)σis dependent on temperature, and
0 is the conductivity atthe reference temperature T0 and
is the temperaturecoefficient of resistivity, which describes how resistivity varies with temperature. In general, by taking account of heat diffusion and Joule heating [38], the heat conduction equation of a specimen can be expressed as:
2 2 2 2 2 2 1 , , , p p T k T T T q x y z t t C x y z C (2)where T T x y z t
, , ,
is the temperature distribution, k is the thermal conductivity of the material (W/m K), which is dependent on temperature.
is the density (kg/m3),p
C is specific heat (J/kg K). q x y z t
, , ,
is the internal heat generation function per unit volume, which is the result of the eddy current excitation. From the above analysis, it becomes clear that the variation of temperature spatially and its transient response directly reveals the intrinsic properties variation of the conductive material.In order to pave the way to interpreting the physics characteristics of the defect behavior, the system of ECPT is firstly shown in Fig. 1. The excitation signal generated by the excitation module is a small period of high frequency current. The current in the coil will induce the eddy current and generate the resistive heat in the conductive material. If a defect exists, the distribution of eddy current (EC) and thermal diffusion will be disturbed. Specifically, when the EC encounters a discontinuity, e.g. crack, it will be forced to divert, leading to an increase of the EC density within the vicinity of the defect as shown in Fig. 1(b). The arrow indicates the direction of the EC while the length of the arrow represents the EC intensity. Fig. 1(a) shows the numerical simulations for the fusion of eddy current and temperature distribution which are performed using COMSOL Multi-physics simulation software. The distribution of the EC in Fig. 1(a) as marked by a rectangle area is shown in Fig. 1(b). Consequently, this will lead to variation in the resultant surface heat spatial distribution and the transient response of temperature. These variations are captured by an infrared camera. For surface crack, prominent features can be observed at both tip and bottom of the crack, as shown in Fig. 1(a). Once the prominent features of the crack are extracted, then the location of the crack can be readily identified and quantified.
2) Physics-based interpretation of crack behavior
Based on the above analysis of physics characteristics of the defect behavior in inductive thermography, it can be readily inferred that defect areas radiate more heat than background area. This indicates that the defect preserves large amount of energy, and is located at the top-end of the image histogram.
In order to obtain specific defect status from the histogram asa prioriinformation for image segmentation, the defect thermal images will be tested and analyzed.
Fig. 1: Inductive Thermography and interpretation of defect behavior.
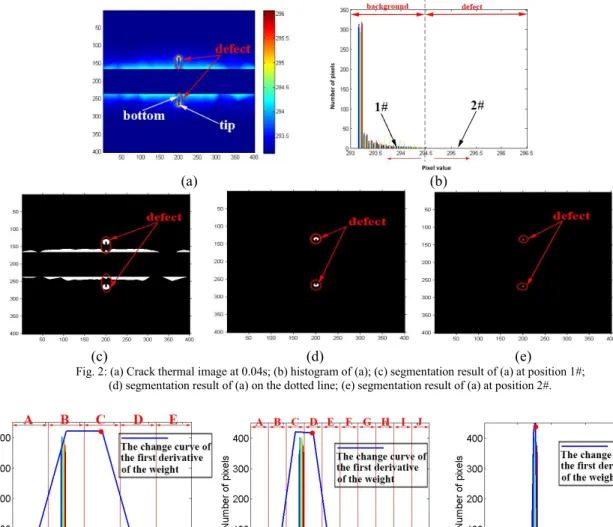
It should be noted that the thermal image contains only one waveband, i.e. the infrared waveband. Therefore, the adopted thermal image is the pseudo color image. In order to analyze the data, Fig. 2(a) is mapped directly to the histogram without data transformation and compression, as shown in Fig. 2(b). The distribution of real temperature values is then mapped into the digital level of the histogram in Fig. 2(b). Fig. 2(a) illustrates the simulation result for surface crack at 0.04s, which is the early response of eddy current heating and has the largest contrast between defective and non-defective area. The segmentation result by manually selecting the threshold on the dotted line of Fig. 2(b) is displayed in Fig. 2(d). The result shows that the background and the defect are optimally separated. However, when the threshold is located on the left side of the dotted line in Fig. 2(b), such as the selection threshold at position 1#, unwanted background information is included. This can be seen in Fig. 2(c). When the threshold is located on the right side of the dotted line (such as position 2#), the result shows the worse performance of defect segmentation. According to Fig. 2(c)-(e), it can be seen that threshold falls on the right of the dotted line in Fig. 2(b) can be expected to render a good segmentation result. Otherwise, the segmented image will contain background interference. Independent Component Analysis (ICA) [14] has the capability to automatically extract the spatial and temporal information of defects according to the whole thermography sequence without any training knowledge. This process avoids the issue of manual selection of the specific thermal frame. Generally, the 3~6 independent components can be used to describe the main information contained in the whole thermography sequence. In addition, the independent component with the maximum kurtosis contains significant defect information and this is adopted as the pre-segmented image. In this paper, the ICA is used as a pre-processing method for the original thermography sequence.
3) Derivation of proposed FOSP-GA method
It is hypothesized that the defect and background could be effectively separated by selecting an optimal threshold boundary. The optimal defect segmentation result can be obtained by using the threshold that falls into the appropriate boundary of the defect related histogram range. In order to effectively separate the defect from the background, this paper considers the strategy that 1) divides the histogram equally into multiple groups and 2) performs automatic threshold selection for separation. The mean pixel value of each group is used as a candidate boundary and threshold. The total number of pixel in each group represents the weight. The rate of change of the weight is computed by calculating the first order derivative, and the maximum elbow point is taken as an alternation of the weight to distinguish the defect and background. The proposed strategy is to adaptively seek a threshold boundary to maximally distinguish the defect from the background. Fig. 3 illustrates the histogram partition into 5, 10 and 100 groups, respectively. The dots indicate the selection of different thresholds with their corresponding segmentation results shown in Fig. 4.
Fig.4 shows that selecting different grouping numbers of histogram significantly affects the determination of threshold, which leads to varied segmentation performance. Based on the above analysis, a new FOSP-GA method is proposed on the basis of a combination of the first order statistical properties (FOSP) with genetic algorithm (GA). The proposed method combines the genetic functionality with the FOSP to automatically control the segmentation threshold so as to render better accuracy in locating as well as sizing the defect.
4) Proposed FOSP-GA algorithm
Fig. 5: Flow diagram of the proposed FOSP-GA.
(Note: MATLAB©demo code of the proposed method can be found in
http://faculty.uestc.edu.cn/gaobin/en/lwcg/153408/list/index.htm) Concerning the statistical characteristics, the histogram shows the distribution of the pixel number for each different pixel value. With regard to the FOSP, the histogram is equally divided intongroups (n2) and the width of each group is calculated as follows:
(a) (b)
(c) (d) (e)
Fig. 2: (a) Crack thermal image at 0.04s; (b) histogram of (a); (c) segmentation result of (a) at position 1#; (d) segmentation result of (a) on the dotted line; (e) segmentation result of (a) at position 2#.
(a) (b) (c)
Fig. 3: Histogram with various groups: (a) histogram is equally divided into 5 groups, (b) histogram is equally divided into 10 groups, (c) histogram is equally divided into 100 groups.
(a) (b) (c)
Fig. 4: Segmentation results under different thresholds.
n V V
V max min
(10)
whereVmaxandVminare maximum and minimum value of the
pixel in the image, respectively. Subsequently, Vi can be
defined as: ) ..., 2 ,1 , 0 ( , min i V i n V Vi (11) Each group can be specifically expressed as:
V0~V1,V1~V2,...,Vn-1~Vn, i.e., Vi~Vi+1. The next step is
accumulating the corresponding pixel numberuvof pixel value
v that falls within Vi~Vi+1 and calculating the average pixel
) ,..., 2 ,1 ( , , 1 1 i n S u v W u S i i i i V v V i V v V v i v i
(12)whereWidenotes average pixel value of each group, that is, a
candidate boundary of defect and background.Sidemonstrates
the weight of each group. Obviously, it is a discrete model and the first order derivative ofSiis computed as follows:
1
, ( 1,2,..., . where
00)
i i i
k S S
i
n
S
(13)The maximum absolute value of kiis searched and this is
denoted askmax. The termkmaxis considered as an alternation of
weight for the distinction of the defect and background. Owing to the target which distributes in the top-end of the histogram, the right side ofkmaxis taken as the target area. Ifiis equal ton,
threshold T was determined as Wn, otherwise, T is Wi+1.
Accordingly, the threshold determination can be achieved. However, the non-optimized selection of the different grouping number for histogram indirectly introduces unwanted interference to the determinations of bothkmaxandT.
In order to search for a suitable quantity of division, genetic algorithm (GA) [39] is incorporated into FOSP. The process is shown in Fig. 5. The specific description can be summarized:
(i) Code and initialize population: chromosomes are generated by binary code which represent all solutions. In the work, an upper limit of 256 bins is sufficient for the FOSP in processing the inductive thermal image. Therefore the quantity of division of the histogram can be represented as 8 bit binary, i.e. a chromosome. The procedure is creating the initial population with chromosomes randomly sampled from an independent and identically distributed library. The creation should be neither too large nor small. Otherwise, this leads to the slow convergence speed or non-optimal solution. In this work, 10 chromosomes are set as the initial population, and the encoded initial population serves as the current generation.
(ii)FOSP and Fitness function: A fitness function is defined to evaluate each chromosome where the greater the value, the stronger the ability to survive. In our work, image entropy is chosen as fitness function:
n i i i p p H 0 log (14)wherepirepresents the frequency of pixel value iin the image.
Image entropy denotes that aggregation of the pixel value distribution, which reflects the average information of the image. For inductive thermal images, the number of pixels in the defect is few relative to the whole image, that is, the defect is small and has sparse characteristic. Therefore, the larger the entropy, the better the segmentation result. Since entropy is a measure of certainty, the entropy has been selected as the fitness function.
(iii) Selection of genetic seed: For the fitness of each chromosome, the fine chromosome is inherited to the next population. In our work, the rule is selected that the chromosomes of the current population are randomly replaced by chromosomes in last population whose fitness value is greater than those of the current population.
(iv) Crossover: Crossover refers to some bits of the two chromosomes are exchanged in the current population, and
cross-operation is implemented based on crossover probability (Pc) to generate a new population. The greater the crossover
probability, the more bits (i.e. genes) are exchanged, and the faster the convergence rate of the solution. However, a large crossover probability is unfavorable for determining an optimal solution for values 0.4~0.9 are considered. Here the crossover probability is set as 0.4.
(v) Mutate: On the basis of mutation probability (Pm), some
bits of chromosomes in the current population are changed from 1 to 0, or 0 to 1, and the new generation is formed. It is important to note that ifPmexceeds 0.5 GA can suffer from
inferior optimization ability. Here, the mutation probability is set as 0.3.
(vi) Regenerate: After the genetic operation, a new population is generated. The current generation covers the last generation. In addition, the new generation is set as the current generation, and then go to ii).
(vii) Genetic algebra: The program selects a genetic algebra as the determined conditions of termination for the optimization loop. When algorithm has progressed a certain generation, the optimal solution can be obtained and ordinarily the genetic algebra is selected as 50~500. In our work, in order to ascertain the convergence of the solution, the genetic algebra is set as 50. When a predetermined genetic algebra is completed, the chromosome with largest fitness is selected as the best result that is decoded as the inverse process of encoding. All the above parameter settings are validated by using Monte-Carlo repeated experiments involving more than 20 independent trials in order to obtain robust results.
C. Quantitative detectability assessment
The evaluation can be classified into the following four results: True positive (TP): a defect exists and is detected; False positive (FP): no defect exists but one is identified; False negative (FN): a defect exists but is not detected; True negative (TN): no defect exists and none is detected. Both TP and FN outcomes represent the total opportunities for positive calls (effective number of defects) while both FP and TN outcomes represent the total opportunities for false alarms (effective number of no defects). Thus, the precision and recall can be defined as:
Precision TP TP FP Recall TP TP FN (15)
The desired results of the application of NDE procedures are defect detection (signal present) or signal non-detection (signal absent). In order to balance the judgement of precision and recall, F-score is used as a measure of test accuracy, namely: 2 2
Recal
(
1) Precision
(Precision
)
l
Recall
F
(16)where
=1
is a default value that relatives weight the Precision and Recall. In order to objectively perform quantitative assessment for different ISMs, the output of image segmentation is compared to their corresponding ground truth that is generated by a human, that is, the pixel region of the defect is annotated manually. Once the defect area (tip or bottom region) is separated automatically by the proposedalgorithm FOSP, morphological operations are subsequently implemented to connect the tips as well as bottom region to obtain the reconstruction result. This result and the ground truth are used to calculate F-Score for quantitative evaluation of defect according to Eqn. (16). In inductive thermography, the main objective is to automatically extract the tips and bottoms of the cracks, which is sufficient to identify the defects as well as quantitatively perform the measurement.
III. RESULTS ANDDISCUSSION
A. Sample Preparation and Experiments setup
The experimental set-up is shown in Fig. 6. The 304# stainless steel was adopted in the experiment, and a line inductor with an outer radius of 3.5mm and inner radius of 2.5mm was used and is positioned perpendicular to the sample and at 90 degrees to the middle position of the defect (see Fig.
7).
In the experiment, only one edge of the rectangular coil is used to stimulate eddy current to the underneath sample. In this study, the frame rate of 100 Hz is chosen, 380 Armsand 256
kHz are used, and 200 millisecond videos are recorded in the experiments.
Fig. 6: Experiment setup. Fig. 7: Test specimen
B. Performance analysis and evaluation of different image segmentation method
(a) (b) (c)
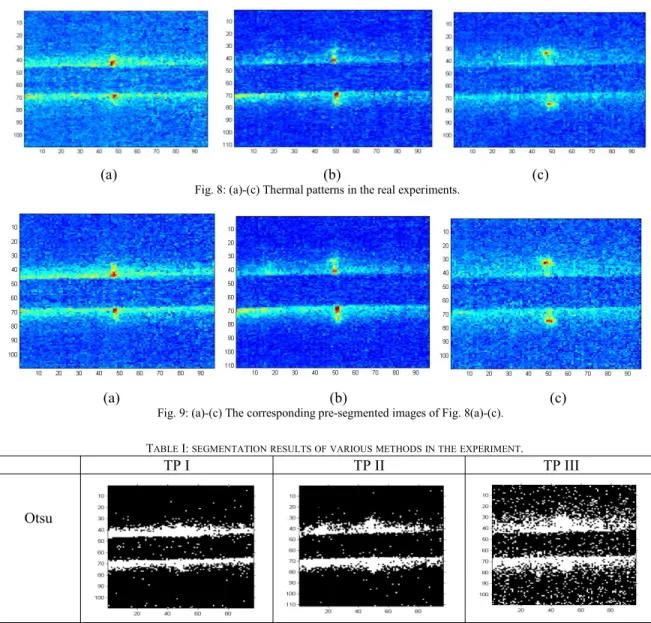
Fig. 8: (a)-(c) Thermal patterns in the real experiments.
(a) (b) (c)
Fig. 9: (a)-(c) The corresponding pre-segmented images of Fig. 8(a)-(c). TABLEI:SEGMENTATION RESULTS OF VARIOUS METHODS IN THE EXPERIMENT.
TP I TP II TP III
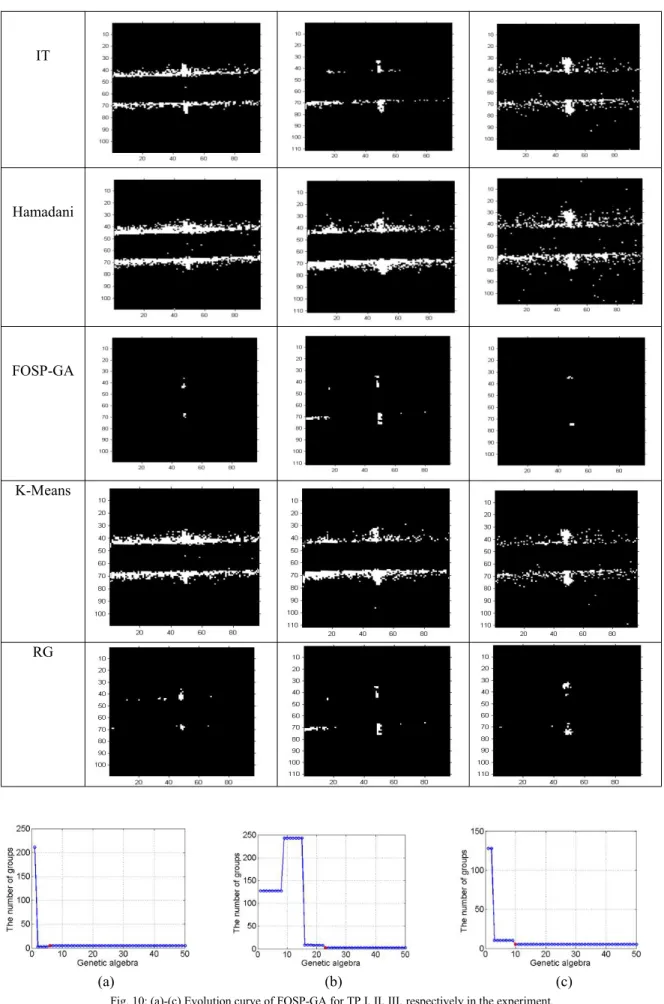
IT Hamadani FOSP-GA K-Means RG (a) (b) (c)
(a) (b) (c)
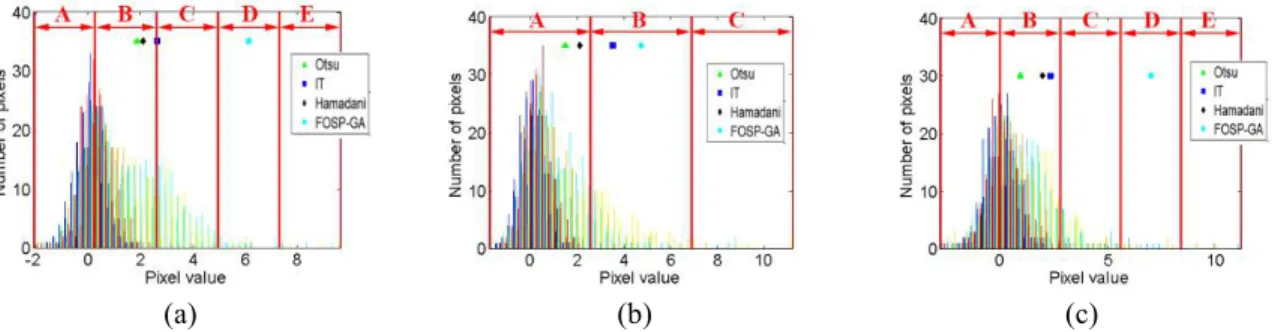
Fig. 11: (a)-(c) Histogram for TP I, II, III, respectively in the experiment.
For crack detection, three typical thermal patterns (TPs) can be observed in Fig.8. These are (i) thermal information is more significant than that at the tip in Fig.8(a), (ii) thermal information of both crack tips and bottom is equally significant in Fig.8(b), and (iii) thermal information of the crack tip is more conspicuous than that at the bottom (see in Fig.8(c)). These imply that the use of the prominent features can directly locate as well as measure the size of the crack.
Extracting prominent features (Fig.9) are influenced by several impact factors such as sensitivity of the camera, the effects of environmental noise and error introduced in the experiments. Otsu, IT, Hamadani K-Means, RG and FOSP-GA are used for segmentation and the results are shown in Table I. The corresponding F-Scores have been computed in Table II. The experiment results illustrate that the proposed method provides significant improvement and performs better than others. Otsu, IT, Hamadani and K-means methods are vulnerable to background interference in ECPT experiments. So far only the RG and the proposed method perform more robustly in the presence of interference, and significant emphasis is placed on the achievement of uneven excitation that is availably depressed. In Fig. 10, the evolution curves have reached the steady state with the genetic algebras equal to 6, 23 and 10 for TP I, II and III, respectively. The corresponding histograms are divided into 5, 3 and 5 groups, respectively. Fig. 11 shows that the thresholds of Otsu, IT and Hamadani are far from the terminal region of the histogram. These are 1.8544, 2.6255 and 2.0844 for TP I, 1.4972, 3.5052 and 2.1182 for TP II, 0.9783, 2.3722 and 1.9983 for TP III, respectively. On the other hand, the thresholds are obtained with 6.1133, 4.7207 and 6.9995 for FOSP-GA, which are approaching the top-end of the histogram that fall in the target area. Thus, defects can be accurately segmented based on FOSP-GA. In Table II, the mean F-Scores of FOSP-GA have been improved by 64.15%, 49.42%, 60%, 57.01% and 5.7% compared to Otsu, IT, Hamadani, K-means and RG, respectively. It is very evident that the FOSP-GA provides a significant improvement and delivers the best result for extracting the target for stimulated thermal image.
TABLEII: F-SCORE FOR VARIOUSISMS IN THE EXPERIMENT.
Experiment TP I TP II TP III average Otsu 0.0400 0.0506 0.0245 0.0384 IT 0.1020 0.3134 0.1417 0.1857 Hamadani 0.0649 0.0879 0.0868 0.0799 K-Means 0.1207 0.0689 0.1398 0.1098 RG 0.4019 0.6658 0.8010 0.6229 FOSP-GA 0.4783 0.6667 0.8947 0.6799
The time cost of the algorithms has been computed and the results are shown in Table III. The proposed method FOSP-GA and RG consume longer time than other methods while FOSP-GA is able to effectively improve the detection performance.
Table III: Runtime comparison (s)
Experiment TP I TP II TP III average Otsu 0.683 0.742 0.643 0.689 IT 0.109 0.114 0.111 0.111 Hamadani 0.112 0.110 0.101 0.108 K-Means 0.689 0.623 0.598 0.609 RG 3.012 3.100 3.198 3.103 FOSP-GA 3.140 2.812 2.928 2.960
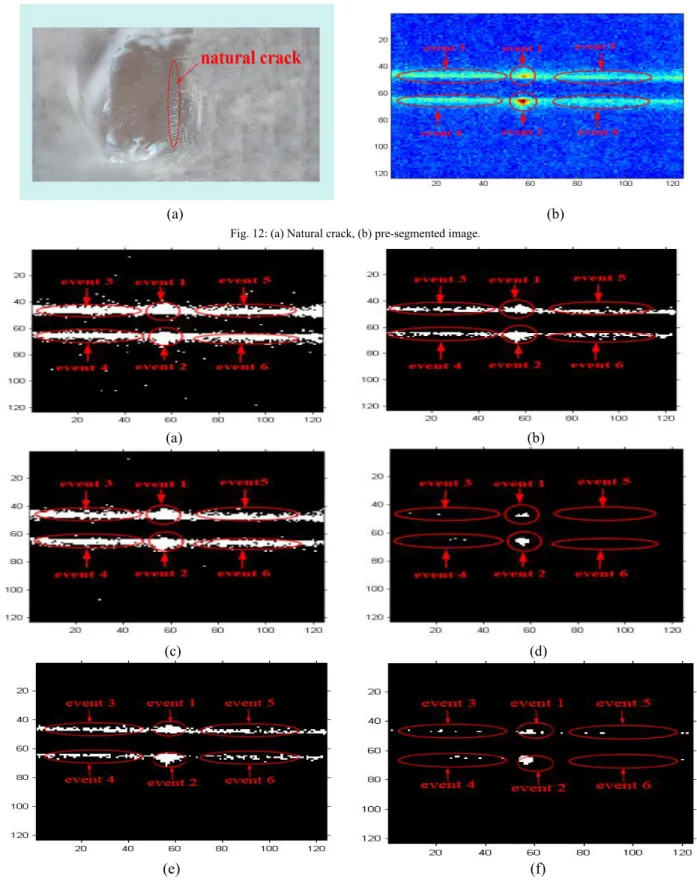
More validation studies of natural cracks with complex geometries are tested based on ECPT. In Fig. 12(a), a natural crack (i.e. ellipse marked area) is generated by intergranular corrosion in nuclear industry material. The pre-segmented image is acquired and shown in Fig. 12(b). Otsu, IT, Hamadani,K-means, RG and FOSP-GA have been used to segment the natural crack related to the thermal pattern, and the results are shown in Fig. 13.
As the F-Score is a pixel level evaluation index, however, it is difficult to calibrate ground truth of natural crack. The evaluation index based on region is used to evaluate the segmentation quality of natural crack. The segmented image from different segmentation algorithms are compared to their corresponding ground truth image. The performance and accuracy of segmentation methods are evaluated based on parameters of true positive rate (TPR), false positive rate (FPR). In order to assess the accuracy of image segmentation, the value of TPR and FPR are calculated using TPR=TP/(TP+FN) and FPR=FP/(TP+FP). An accurate segmentation result should be have TPR closes to 1, while FPR should be as low as possible [40]. Raw thermal image or pre-segmented image from ICA can be regarded as ground truth, defect and background are considered as various events to carry out the examination of the overlapping. Defects are considered as event1 and event2, i.e. ellipse marking area of Fig. 12(b). Table IV shows the comparison of segmentation performance.
TABLEIV: SEGMENTATION PERFORMANCE ANALYSIS.
Otsu IT Hamadani K-Means RG FOSP-GA
TPR 1 1 1 1 1 1
According to TPR in Table IV, it can been seen that defects are detected by the six methods. However, Otsu, IT, Hamadani, K-means and RG provide higher FPR than
FOSP-GA, which interprets the FOSP-GA performs the best segmentation results in overall.
(a) (b)
Fig. 12: (a) Natural crack, (b) pre-segmented image.
(a) (b)
(c) (d)
(e) (f)
(a) (b) (c) (d)
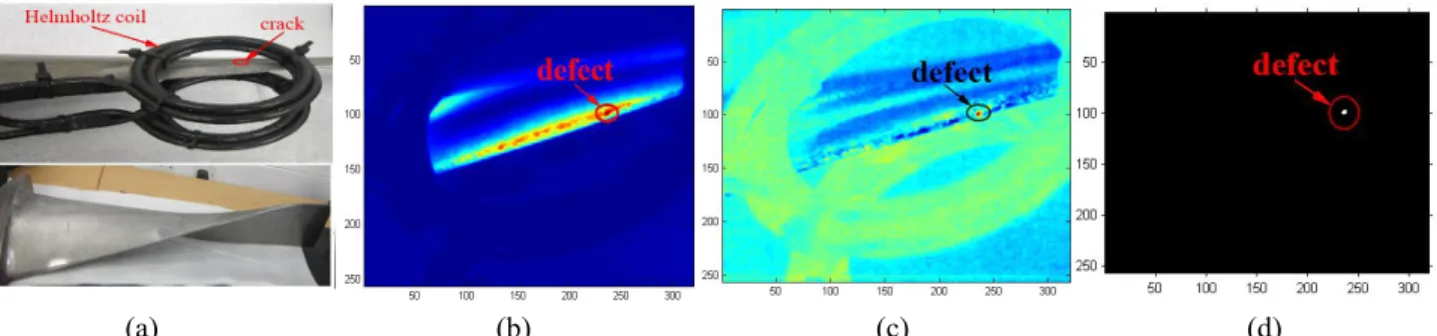
Fig. 14: (a) Turbine blade with thermal fatigue natural crack; (b) the original thermal image of (a); (c) pre-segmented image; (d) segmentation result by FOSP-GA.
(a) (b) (c)
(d) (e)
Fig. 15: (a)-(e) The segmentation results of Figure 11(c) by using Otsu, IT, Hamadani, K-Means and RG, respectivel.
In addition, a test specimen of a turbine blade with a thermal fatigue natural crack is used to evaluate the performance of FOSP-GA and this is shown in Fig. 14(a). In this study, a helmholtz coil is chosen as the excitation coil. This is a different type of coil compared to the line coil. The placement of the coil is shown in Fig. 14(a) and it will excite the whole region under the circle. An original thermal image is shown in Fig. 14(b). It is difficult to distinguish the defect if the location of defect is unknown in advance, and the real defect is not easy to be judged in the original thermal image. ICA is used to process the original thermography sequence to extract the defect information and eliminate false positives. The pre-segmentation image is shown in Fig. 14(c). Furthermore, this image is subsequently processed by the FOSP-GA whose segmentation result is shown in Fig. 14(d).
In addition, Otsu, IT, Hamadani, K-means and RG method are used for comparison as shown in Figure 15(c). The results are shown in Fig. 15 where the presence of different levels of background interference. The background interference is especially serious for results from Otsu, IT Hamadani and
K-means. In overall, it can be seen that the proposed method FOSP-GA provides the best result.
IV. CONCLUSION ANDFUTUREWORK
This paper has proposed a physics-based FOSP-GA image segmentation method to quantitatively analyze defects for
application in inductive thermography imaging. The segmentation threshold is determined based on the FOSP, and GA is applied to automatically determine the optimal statistical feature and the threshold selection. Quantitative defect detectability is objectively assessed and compared with Otsu, IT, Hamadani, K-means and RG by using global evaluation F-Score. The obtained results from conducted experimental studies have consistently shown that the proposed FOSP-GA has outperformed other segmentation methods. It has accurately segmented the defects from background and effectively inhibited the influences of uneven excitation and noise. The work can be further applied to other types of defects detection and quantitative evaluation such as the inspection of fatigue crack on steel blade for automated visual inspection of defects.
V. ACKNOWLEDGEMENT
The work was supported by National Natural Science Foundation of China (No. 61401071, No. 61527803), Supported by NSAF (Grant No. U1430115) and EPSRC IAA Phase 2 funded project: “3D super-fast and portable eddy current pulsed thermography for railway inspection” (EP/K503885/1).
REFERENCES
[1] Betz, C. E., Principles of Magnetic Particle Testing, American Society for Nondestructive Testing, p. 234, ISBN 978-0-318-21485-6.1985 [2] B.W. Drinkwater and P. Wilcox, “Ultrasonic arrays for non-destructive
evaluation: A review,”NDT & E International, vol. 39, no. 7, pp. 525-541, Oct. 2006.
[3] E.Z. Kordatos, D.G. Aggelis and T.E. Matikas, “Monitoring mechanical damage in structural materials using complimentary NDE techniques based on thermography and acoustic emission,” Composites Part B: Engineering, vol. 43, no.6, pp. 2676-2686, Sept. 2012.
[4] Bin Gao, Hong Zhang, W.L. Woo, Gui Yun Tian, Libing Bai and Aijun Yin, “Smooth Nonnegative Matrix Factorization for defect detection using Microwave Non-destructive Testing and Evaluation,” IEEE Transactions on Instrumentation and Measurement, vol. 63, no. 4, pp. 923-934, 2014.
[5] Ishikawa Masashi, Hatta Hiroshi, Habuka Yoshio and Fukui Ryo, “Detecting deeper defects using pulse phase thermography,” Infrared physics & technology, vol. 57, no. 2, pp. 42-49, Mar. 2013.
[6] N.P. Avdelidis, B.C. Hawtin, and D.P. Almond, “Transient thermography in the assessment of defects of aircraft composites,” NDT&E International, vol. 36, pp. 433-439, 2003.
[7] P.V. Vladimir and D.B. Douglas, “Review of pulsed thermal NDT: Physical principles, theory and data processing,”NDT&E International, vol. 73, pp. 28-52, 2015.
[8] B.B. Lahiri, S. Bagavathiappan, P.R. Reshmi, J. Philip, T. Jayakumar and B. Raj, “Quantification of defects in composites and rubber materials using active thermography,”Infrared Phys,vol. 55, pp. 191-191, 2012. [9] J. Wilson , G.Y. Tian, I.Z. Abidin, S. Yang and D. Almond, “Pulsed eddy
current thermography: System development and evaluation,” Insight: Non-Destructive Testing and Condition Monitoring, vol. 52, no. 2, pp.87-90, 2010.
[10]I.Z. Abidin, G.Y. Tian, J. Wilson, S. Yang and D. Almond, “Quantitative evaluation of angular defects by pulsed eddy current thermography,”NDT & E International, vol. 43, no. 7, pp. 537-546, Oct. 2010.
[11]M. Grenier, C. Ibarra and X. Maldague, “Development of a hybrid non-destructive inspection system combining induction thermography and eddy current technique,”Quantitative Infrared Thermography, vol. 43, no. 5, pp. 318-321, 2010.
[12]L. Cheng and G.Y. Tian, “Surface crack defection for carbon fibre reinforced plastic (CFRP) materials using pulsed eddy current thermography,”IEEE Sensors Journal, vol. 11, no. 12, pp. 3261-3268, 2011.
[13]J. Wilson, G. Tian, I. Mukriz, and D. Almond, “PEC thermography for imaging multiple cracks from rolling contact fatigue,” NDT and E International, vol. 44, no. 6, pp. 505-512, 2011.
[14]Bin Gao, Libing Bai, Guiyun Tian, W.L. Woo and Yuhua Cheng, “Automatic defect identification of eddy current pulsed thermography using single channel blind source separation,” IEEE Trans. Instrum. vol. 63, no. 4, pp. 913-922, 2014.
[15]M. Pan , Y.Z. He and G.Y. Tian, “Defect characterisation using pulsed eddy current thermography under transmission mode and NDT applications,”NDT &E International, vol. 52, pp. 28-36, 2012. [16]J. Liu , W.W. Ren and G.Y. Tian, “Nondestructive Evaluation of Early
Contact Fatigue Using Eddy Current Pulsed Thermography,” IEEE Sensors Journal, vol.15, no. 8, pp. 4409-4419, 2015.
[17]Y.A. Plotnikov and W.P. Winfree, “Advanced Image Processing for Defect Visualization in Infrared Thermography,” Proceedings of SPIE-The International Society for Optical Engineering, vol. 33, pp. 331-338, 1999.
[18]R.C. Gonzalez and R.E. Woods, “Digital Image Processing,”Publishing House of Electronic Industry, no. 3, pp. 443-444, Jun. 2011.
[19]S.K. Mylonas, D.G. Stavrakoudis and J.B. Theocharis, “A Local Search-Based GeneSIS algorithm for the Segmentation and Classification of Remote-Sensing Images,”IEEE Journal of Selected Topics in Applied Earth Observations and Remote Sensing, vol. 9, no. 4, pp. 1470-1492, 2016.
[20]H.J. Sanchez, I.E. Martinez and H.A. Arquero, “Improving Parameters Selection of a Seeded Region Growing Method for Multiband Image Segmentation,”Latin America Transactions, Revista IEEE, vol. 13, no. 3, pp. 843-849, 2015.
[21]X. Liu, Q. Xu and J. Ma, “A Unified Multiscale Low-Rank Representation for Image Segmentation,”IEEE Transactions on Image Processing, vol. 23, no. 5, pp. 2159-2167, 2014.
[22]M. Jian and C. Jung, “Interactive Image Segmentation Using Adaptive Constraint Propagation,”IEEE Transactions on Image Processing. Signal Processing Society, 2016.
[23]J. Wang and W. Huang, “Image Segmentation With Eigenfunctions of an Anisotropic Diffusion Operator,” IEEE Transactions on Image Processing, vol. 25, no. 5, pp. 2155-2167, 2016.
[24]B. Hell, M. Kassubeck and P. Bauszat, “An approach toward fast gradient-based image segmentation,” IEEE Transactions on Image Processing, vol. 24, no. 9, pp. 2633-2645, 2015.
[25]X. Wang, Y. Tang and S. Masnou, “A Global/Local Affinity Graph for Image Segmentation,”IEEE Transactions on Image Processing, vol. 24, no. 4, pp. 1399-1411, 2015.
[26]G. Liu, Y. Zhang and A. Wang, “Incorporating Adaptive Local Information Into Fuzzy Clustering for Image Segmentation,” IEEE Transactions on Image Processing, vol. 24, no. 11, pp. 3990-4000, 2015. [27]N. El-Zehiry and L. Grady, “Contrast Driven Elastica for Image Segmentation,”IEEE Transactions on Image Processing Image, vol. 25, no. 6, pp. 2508-2518, 2016.
[28]X.P. Dong and J.B. Shen, “Sub-Markov Random Walk for Image Segmentation,”IEEE Transactions on Image Processing, vol. 25, no. 2, pp. 516-527, 2016.
[29]X. Li, H. Jiang and G. Yin, “Detection of surface crack defects on ferrite magnetic tile,”NDT & E International, vol. 62, pp. 6-13, 2014. [30]H. Li, Y. Tan and Y.S. Li, “Image layering based small infrared target
detection method,”Electronics Letters, vol. 50, no. 1, 2014.
[31]R. Świta and Z. Suszyński, “Cluster Segmentation of Thermal Image Sequences Using kd-Tree Structure,” International Journal of Thermophysics, vol. 35, no. 12, pp. 2374-2387, 2014.
[32]Y. Huang and J.W. Wu, “Infrared thermal image segmentations employing the multilayer level set method for non-destructive evaluation of layered structures,”NDT & E International, vol. 43, no. 1, pp. 34-44, 2010.
[33]N. Otsu, “A threshold selection method from gray-level histograms,” Automatica, vol. 11, pp. 23-27, 1975.
[34]H.R. William, “Bayesian-Based Iterative Method of Image Restoration”, Optical Society of America, vol. 62, no. 1, pp. 55-59, 1972.
[35]N.A. Hamadani, “Automatic Target Cueing in IR Imagery,”Air force inst of tech wright-patterson afb oh school of engineering, 1981.
[36]A.Z. Chitade and D.S. Katiyar. “Colour based image segmentation using K-Means clustering,” International Journal of Engineering Science & Technology, ,vol. 2, no. 10, 2010.
[37]J. Wilson, G.Y. Tian, I.Z. Abidin, S. Yang and D. Almond, “Modelling and evaluation of eddy current stimulated thermography,” Nondestructive Testing & Evaluation, vol. 25, no. 3, pp. 205–218, 2010.
[38]J. Wilson, G.Y. Tian, I.Z. Abidin, S. Yang and D. Almond, “Modelling and evaluation of eddy current stimulated thermography,” Nondestructive Testing & Evaluation, vol. 25, no. 3, pp. 205–218, 2010.
[39]D.E. Goldberg, J.H. Holland, “Genetic algorithms and machine learning,” Machine learning, vol. 3, no.2, pp. 95-99, 1988.
[40]D. Mery, F. Pedreschi, “Segmentation of colour food images using a robust algorithm,” Journal of Food engineering, vol. 66, no. 3, pp. 353-360.
[41]D. Davies, P. L. Palmer, and M. Mirmehdi. “Robust tracker of small, fast-moving low-contrast targets,” In Proceedings of IX European Signal Processing Conference, vol. 3, pp. 1545--1548. Typorama Editions, September 1998.
[42]J. Schmidhuber, “Deep Learning in Neural Networks: An Overview”, Neural Networks. No. 61, pp. 85–117, 2015
Bin Gao(M’ 12-SM’ 14) received his B.Sc. degree in communications and signal processing from Southwest Jiao Tong University (2001-2005), China, MSc degree in communications and signal processing with Distinction and PhD degree from Newcastle University, UK (2006-2011). He worked as a Research Associate (2011-2013) with the same university on wearable acoustic sensor technology. Currently, he is a Professor with the School of Automation Engineering, University of Electronic Science and Technology of China (UESTC), China. His research interests include sensor signal processing, machine learning, social signal processing, nondestructive
testing and evaluation where he actively publishes in these areas. He has published over 60 papers on these topics on various journals and international conference proceedings. He has coordinated several research projects from National Natural Science Foundation of China
Xiaoqing Lireceived the B.Sc. degree from the School of Life Information and Instrument Engineering, Hangzhou Dianzi University, Hangzhou, China, in 2010. She is currently pursuing the M.Sc. degree in quantitative analysis and evaluation for surface cracks using electromagnetic technique at the University of Electronic Science and Technology of China, Chengdu, China. Her research interests include sensor signal processing, feature extraction, image segmentation, and thermography nondestructive testing.
Wai Lok Woo was born in Malaysia. He received the BEng degree (1st Class Hons.) in Electrical and Electronics Engineering and the PhD degree from the Newcastle University, UK. He was awarded the IEE Prize and the British Scholarship to continue his research work. He is currently a Senior Lecturer and Director of Operations with the School of Electrical and Electronic Engineering. His major research is in the mathematical theory and algorithms for nonlinear signal and image processing. This includes areas of machine learning for signal processing, blind source separation, multidimensional signal processing, signal/image deconvolution and restoration. He has an extensive portfolio of relevant research supported by a variety of funding agencies. He has published over 250 papers on these topics on various journals and international conference proceedings. Currently, he is Associate Editor of several international journals and has served as lead-editor of journals’ special issues.
Gui Yun Tian(M’01-SM’03) received the B.Sc. degree in metrology and instrumentation and M.Sc. degree in precision engineering from the University of Sichuan, Chengdu, China, in 1985 and 1988, respectively, and the Ph.D. degree from the University of Derby, Derby, U.K., in 1998. From 2000 to 2006, he was a Lecturer, Senior Lecturer, Reader, Professor, and Head of the group of Systems Engineering, respectively, with the University of Huddersfield, U.K. Since 2007, he has been based at Newcastle University, Newcastle upon Tyne, U.K., where he has been Chair Professor in Sensor Technologies. Currently, He is also an adjunct professor with School of Automation Engineering, University of Electronic Science and Technology of China. He has coordinated several research projects from the Engineering and Physical Sciences Research Council (EPSRC), Royal Academy of Engineering and FP7, on top of this he also has good collaboration with leading industrial companies such as Airbus, Rolls Royce, BP, nPower, Networkrail and TWI among other