Article
1
A Study on the Effect of the Outer Ring of Annular
2
Cooling Fan on the Aerodynamic Performance
3
Hengtao Shu1, Zhihong Yin1,*, Wenbin Shangguan1and Waizuddin Ahmed2
4
1 School of Mechanical & Automotive Engineering, South China University of Technology, Guangzhou,
5
People’s Republic of China; [email protected] (H.S.); [email protected](W.S.)
6
2 CONCAVE Research Center, Mechanical & Industrial Engineering, Concordia University, Montreal,
7
Canada; [email protected];
8
* Correspondence: [email protected]
9
10
Abstract: We studied the effect of the structure parameters of engine annular cooling fan with
11
outer ring on the aerodynamic performance by means of experiments and model simulation in
12
fluent®. Firstly, based on the experiment, a computational model is developed to calculate and
13
analyze the aerodynamic performance of the tested annular fan. The model is validated by
14
comparing the test results with the calculated data. Besides, the aerodynamic performance
15
differences between two types of fans (common fan without outer ring and annular fan with outer
16
ring) are discussed. Based on the computational model, the relation between aerodynamic
17
performance and the outer ring structure parameters are investigated. The results show that the
18
relative parameter on the axial direction has great influence on the aerodynamic performance;
19
while the effect of radial relative parameter is minor. In addition, the outer ring with arc chamfer
20
structure in the downstream side can improve its static pressure efficiency effectively.
21
Keywords: annular cooling fan; outer ring; structure parameters; aerodynamic performance
22
23
1. Introduction
24
The performance of engine cooling fan includes aerodynamic performance and aerodynamic
25
noise[1]. And the former is the primary consideration for designers, it includes the flow rate, the
26
static pressure, the fan power and the static pressure efficiency. In the premise of a constant flow
27
rate, the static pressure efficiency is expressed as:
28
sp qp a P η=, (1)
where η is the static pressure efficiency, q is the flow rate, psp is the static pressure, a is the
29
coefficient, and P is the power of the fan. Equation (1) shows that the static pressure efficiency takes
30
both static pressure and fan power into consideration which makes it the most important
31
aerodynamic performance index. Furthermore, the static pressure efficiency is usually the objective
32
of structure optimization [2-4].
33
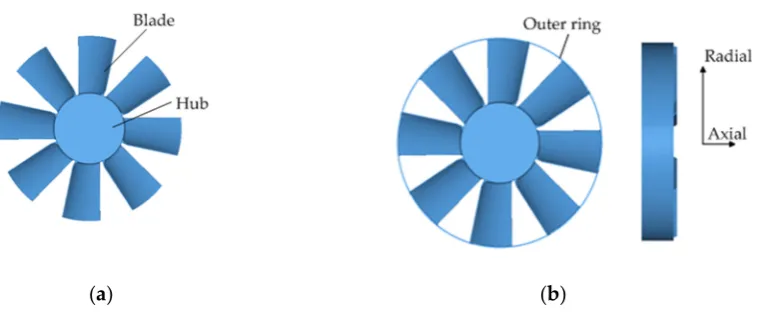
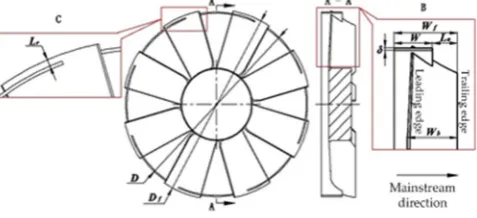
For annular cooling fan, an outer ring is added around the blade tip as shown in Figure. 1b,
34
which is different from the common cooling fan shown in Figure. 1(a).
35
(a) (b)
Figure. 1. Structure comparisons between (a) common fan without outer ring and (b) annular fan with outer ring
Annular fan is not widely applied in the engine cooling system due to the complex structure
36
and high manufacturing cost. However, it has a salient advantage of having high static pressure and
37
low energy consumption [5]. As the engine performance is strengthened, annular fan is receiving
38
more and more interest. The usage rate of annular fan has been continually rising in heavy
39
commercial vehicles, the flow friction and impulse impact losses are both reduced by the restriction
40
of the outer ring. Therefore, the study of the engine cooling fan is mainly focused on annular fan.
41
The aerodynamic performances of an annular cooling fan are affected by many factors, which
42
includes the whole diameter dimension, blade installing angle, blades number and hub ratio.
43
Structure parameters of the outer ring will effect on aerodynamic performance in some way.
44
However, the study on it is minor for annular fan.
45
We note that there are a number of international patents about annular fan in the field of
46
vibrations and structural strength, but there are few papers to illustrate the design method of the
47
outer ring in the field of aerodynamic performance optimization for annular cooling fan. Motivated
48
at this problem, this paper aims to provide a systematic method to study the aerodynamic
49
performance of an annular cooling fan. Specifically, our purpose is to investigate the effect of the
50
outer ring and achieve some valuable conclusions for the outer ring design of the annular cooling
51
fans. So this paper would facilitate the performance analyses and product development of annular
52
cooling fan.
53
The main motivation of this paper is to present some proposals of outer ring design for annular
54
cooling fan for the first time. All suggestions are obtained through a series of simulations and tests
55
comparative analysis, and they are reliable and effective. The results will provide a certain
56
engineering guiding in annular cooling fan design.
57
Generally, a common cooling fan is composed of a hub and blades. In the existing studies of
58
structural optimization for cooling fan, researchers conducted a large number of studies on the hub
59
ratio, and the aerodynamic performance is greatly improved [6-7]. However, many simulations in
60
Fluent® have shown that the leakage locates on the tip of the blade is the main source of the
61
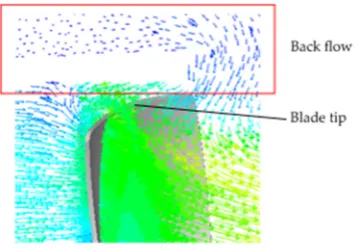
aerodynamic performance loss for cooling fan [8]. It can be seen from Figure. 2 that an obvious
62
backflow exists in the blade tip zone, which attributes to the blade tip leakage [9-10].
Figure. 2. Velocity contour profiles at one section of a cooling fan
For an axial flow machine, a clearance must be considered between the blade tip and the outer
64
shell to ensure the relative motion for the two mechanical components. A pressure difference
65
between the suction and the pressure surface is generated when the axial flow machine rotates for
66
complex blade structure. In addition, the backflow is caused by the existence of blade tip clearance
67
and the pressure difference [11]. The mixing flow on the blade surface is formed by the leakage
68
vortex, and it brings axial aerodynamic performance degradation for the axial impeller machinery
69
[12-15]. So, the tip leakage is one of the main sources of axial-flow energy loss. Furthermore, the tip
70
leakage is the main source of aerodynamic noise [16-17]. It can be seen that the tip leakage has
71
significant influence on the overall performance of the axial flow machinery.
72
The above discussions illustrate that the backflow caused by tip leakage is closely related to the
73
reduction of the static pressure efficiency. The flow field of axial flow fan is very complicated. The
74
backflow cannot be eliminated fundamentally, but can be relieved by structure optimization.
75
In Ref [18], in order to control the backflow and tip leakage, a rapid air injection device was
76
assembled in the inlet section of a compressor. A drawback of this design of adding auxiliary device
77
on the blades periphery is that it brings a higher production cost. However, this design method of
78
adding an auxiliary device to improve the aerodynamic performance provided an optimization idea
79
to restrain tip leakage for an axial cooling fan. In addition, it gave a push to the birth of the annular
80
cooling fan.
81
The outer ring structure was evolved from winglet [19]. In the earliest studies, a winglet was
82
added at the intermediate position of compressor blades to reduce the noise level [20-22]. By adding
83
the winglet on the blades, the natural frequency was changed too [20-21]. Furthermore, the
84
simulation results [5, 23] indicate that the aerodynamic performance was improved obviously.
85
Compared with the common axial fan, the annular fan has stronger pressure lift capacity, and it
86
is initially used as a lift fan in aircraft. Many studies have been done on how to improve the
87
aerodynamic performance of the fan mentioned above. For example, the inlet lip radius and diffuser
88
angle were optimized multiple times to improve the lift efficiency of the fan [24].
89
The above literatures are all about compressors, and the engine cooling fans belong to the axial
90
mechanical as well as compressors. The aerodynamic performance was improved by optimizing the
91
structure of auxiliary equipment for annular fan [17, 25], but there were few studies on optimizing
92
the structure of the fan itself. Based on the optimization methods in the Refs [18, 25], an instance
93
annular automobile engine cooling fan is studied in this paper. The emphasis is put on studying the
94
influence of the outer ring structure parameters on the aerodynamic performance for the annular
95
cooling fan.
96
The organization of this paper is as follows: in section 2, based on the experiment condition of
97
the annular fan, a computational model is developed in Fluent®. The data post-processing is used to
98
analyze the aerodynamic performance of the target fan, including the flow rate, static pressure, fan
99
power and static pressure efficiency. The model is validated by comparing the experimental data
100
with the modeling results. Based on the computational model, some qualitative relationships are
investigated between aerodynamic performance and the outer ring structure parameters. In section
102
3, three kinds of structure parameters of the outer ring are presented. In section 4, all annular cooling
103
fans that change the corresponding structure parameters are simulated and discussed.. The design
104
method of the outer ring is presented and validated in this section. Conclusions are provided in
105
section 5.
106
2. Methods
107
During the structure optimization process of fluid machinery, the application of Fluent® is able
108
to improve the efficiency in investigating a new cooling fan. The simulation model adopt in Fluent®
109
is the key process for the cooling fan structure optimization. To guarantee a good accuracy of the
110
simulation model, the simulation results results should be benchmarked based on the test results.
111
2.1. Experiment Setup and Evaluation Indexes
112
As aforementioned, there are three aerodynamic performance evaluation indexes for cooling
113
fan, i. e. static pressure, fan power and static pressure efficiency.
114
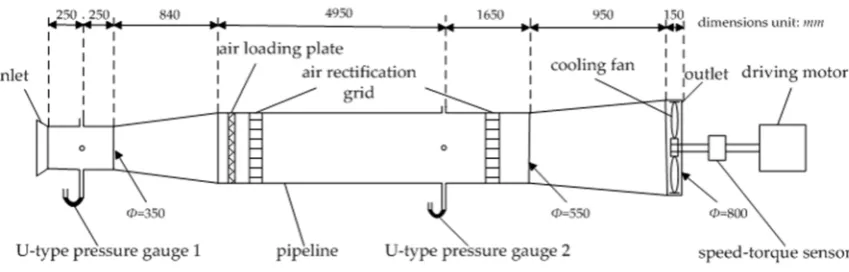
Based on Ref. [1], an aerodynamic performance test bench for the cooling fan is set up, and the
115
schematic diagram is shown in Figure. 3. The test bench mainly consists of three parts: the air-flow
116
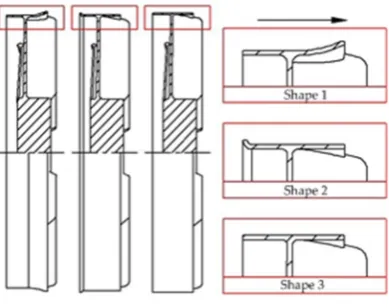
pipe, the mechanical transmission and the test control board.
117
Figure. 3. The schematic of fan aerodynamic performance test bench
The pipeline has both inlet and outlet space. Both the upstream side of the inlet space and the
118
downstream side of the outlet space are connected to the air, which can be treated as 0 Pa (relative
119
value) space. The mechanical transmission section locates at the downstream side of the outlet, and
120
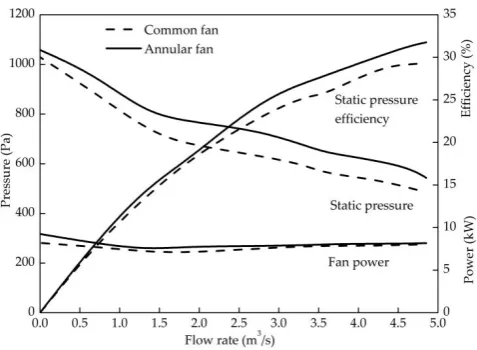
the hub of the cooling fan is connected to the driving motor through the speed-torque sensor. The
121
data of rotating speed (n) and torque (T) of the cooling fan can be measured instantly by the sensor.
122
The flow rate (q) in the pipeline can be set optionally by changing different air loading plates, which
123
have different flow holes sizes within them. Two U-type pressure gauges are installed in different
124
locations along the flow direction. The static pressure at the inlet (psi) and monitoring section (pso) can
125
be both measured by the tow gauges. The photograph of the test bench is shown in Figure. 4.
Figure.4. The photograph of fan aerodynamic performance test bench
Based on the working principle of the test bench, the flow rate mentioned in this paper means
127
the volume of external air-flow that flows through the cooling fan per unit of time. it can be
128
calculated by the static pressure measured by the U-type pressure gauges 1, which can be expressed
129
as:130
2 2 4 si p d q αεπρ
= , (2)
where αε is the air flow coefficient number, and it approximately equals 0.96 in this paper [1]; d
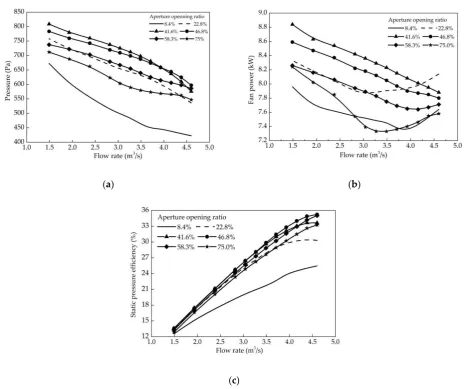
131
is the diameter of the duct section where U-type pressure gauge (pitot tube) locates at the inlet side;
132
psi is the static pressure at the same section, which is measured by the gauge 1 as shown in Figure. 3;
133
and ρ is the air density.
134
The total pressure (ptp) of the air at a certain section of the bench is composed of static pressure (psp)
135
and dynamic pressure (pdp). The total pressure ptp can be measured by the pitot tube, so do the psp,
136
which is generated from pressure perpendicular to the duct wall. Based on the above description, pdp
137
can be calculated which is the difference between ptp and psp. The total pressure of the cooling fan is
138
defined by the total pressure difference between the section of the outlet and inlet, which can be
139
expressed as:
140
2 2 1 1
(
)-(
)
tp sp dp sp dp
p
=
p
+
p
p
+
p
, (3)The static pressure of cooling fan is defined by the difference between the total pressure and the
141
dynamic pressure at the outlet section, which can be expressed as:
142
2 2 1 1
-
-(
)
sp tp dp sp sp dp
p
=
p p
=
p
p
+
p
, (4)Because of the complex flow-field of bench ducts, the pressure loss (Δp) is composed of frictional
143
resistance loss (Δpf) and local pressure loss (Δpl), based on the test experience [1], the Δp can be
144
expressed as:145
2 10 dp f l p p p pΔ = Δ +Δ = , (5)
Based on (3)-(5), the static pressure of the fan can be expressed as:
146
2 2
2 1 1 1
1
1
( )
2 10
dp
sp sp sp dp sp
p q
p p p p p p
A
ρ
= − + − Δ = − − +
, (6)
In all above equations, the subscripts 1 and 2 represent the inlet and the outlet section.
147
Furthermore, A1 is the area of the monitoring section where U-type pressure gauge 2 locates.
By the transfer pass of energy in the air duct, the fan power (P) consists of fan power loss (Pp) and
149
effective fan power (Pesp). The fan power of the fan is equal to the energy transmitted from the
150
driving motor, which can be expressed as:
151
9550
Tn
P= , (7)
Here, T is the output torque of the driving motor, n is the rotating speed of the cooling fan.
152
These values are all measured by the speed-torque sensor as shown in Figure. 3.
153
The effective fan power is equal to the energy absorbed by air when it flows through the
154
rotating fan during per unit time, which can be expressed as:
155
1000
sp esp
qp
P = , (8)
2.2. Simulation Model
156
As shown in Figure. 1, the 3D cooling fan model is established, and the fan-hub is simplified
157
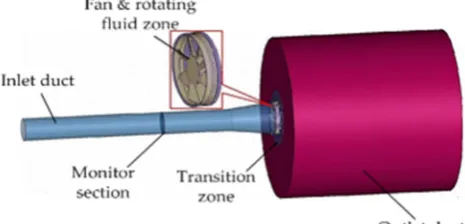
Based on the construction of the test bench, the simulation model is developed by Fluent®, as shown
158
in Figure. 5. During the simulation, the input flow rate can be set arbitrarily based on the actual test
159
condition. Besides, the static pressure can be obtained directly by the monitoring section data. In
160
addition, a rotating fluid zone with suitable size is developed. The outlet downstream area is
161
directly connected to the air, so a cylindrical duct with the diameter and length of 4m is developed.
162
Some transition regions are established to smooth every flow zone along the direction from the inlet
163
to the outlet.
164
In order to improve the computational accuracy and reduce the grid number, the tetrahedral
165
grids are employed in the rotating fluid and transition zones, and the hexahedral grids are employed
166
in the inlet and outlet flow duct. In addition, these two different types of grids can be used
167
synthetically to meet actual calculation requirements.
168
Figure. 5. The computational model
2.2.1. Grid Independent Validation
169
Under a steady state numerical calculation, the grid independence is necessary to be verified.
170
Four grid plans are presented in Table 1.
171
Table 1. Results of grid independent validation
number size number (m3/s) (rpm) (Pa)
1 10 924,573 2.81 1500 654
2 8 1,276,384 2.81 1500 699
3 6 1,713,261 2.81 1500 685
4 4 2,238,734 2.81 1500 689
Note: The rotating fluid zone where the cooling fan locates is the most critical zone for the computational
172
model as shown in Figure. 5. Therefore, the grid size mentioned in the table denotes the wall size of the rotating
173
fluid zone; and the grid number denotes the number of grid in the same zones.
174
175
In this part, the static pressure is used to be the evaluation index to determine which plan is
176
finally to be adopted. The calculation is implemented with the flow rate is 2.81m3/s. The static
177
pressure value differences of the four plans are less than 2%. In order to reduce the computational
178
burden, the Plan 2 with the fewest grids is considered in this paper.
179
2.2.2. Simulation Algorithm Selection
180
The multi-reference frame method (MRF) is a robust algorithm, which is computationally efficient
181
with acceptable accuracy. Therefore, the MRF method is adopted to calculate the aerodynamic
182
performance of the cooling fan in this paper. The flow rate loading panel is used to change the flow
183
rate in the pipeline. Therefore, the inlet section is set as the mass-flow inlet boundary, where the
184
mass flow can be changed arbitrarily to meet the need of the simulation. The outlet section is set as
185
the pressure outlet boundary and the static pressure monitoring section is set as the interior
186
boundary.
187
Furthermore, the fan blade surface is set as the rotating wall boundary. The remaining surfaces are
188
set as stationary wall boundaries.
189
The airflow condition in the test pipeline belongs to low-speed flow (the Mach number is less than
190
0.3). Therefore, the air in the flow field is considered as in-compressible medium. The SIMPLE
191
algorithm is used in the pressure-velocity coupling equations and the RNG k-ε model is used in this
192
model. Besides, the wall function method is used to implement numerical iterative in near wall area.
193
The separation formula solution is used for the solver setup. When the flow rate difference between
194
the inlet flow and the outlet flow is less than 0.5%, the calculation result is considered to be
195
convergent.
196
197
2.3. Model Verification
198
In this section, a common engine cooling fan without outer ring is selected as an example for
199
demonstrations. It has a diameter of 760mm and 8 blades which are equidistantly distributed (as
200
shown in Figure. 1a). Based on the actual condition, the fan rotating speed is set to 1500 r/min. The
201
cooling fan rarely works within a low flow rate region. Therefore, the middle and high flow rate
202
regions in steady operating condition are considered in this paper. Comparisons between the
203
simulation and experiment data are shown in Figure. 6.
Figure. 6. Aerodynamic performance comparisons between experiment and simulation results
As shown in Figure. 6, the static pressure of the cooling fan decreases with increases of flow rate.
205
The fan power changes slightly with increases of flow rate. Besides, the static pressure efficiency
206
firstly increases and then decreases with the increases of flow rate. In addition, it has the same
207
tendency as the static pressure efficiency. Furthermore, the difference becomes larger as the flow
208
increases. It can be found from Figure. 6 that the errors are all less than 10% between the simulation
209
and experiment results. Therefore, the simulation model can be used to predict the aerodynamic
210
performance of the cooling fan.
211
3. Structure and Parameters of Outer Ring
212
The external physical characteristics of annular fan with outer ring are shown in Figure. 7.
213
Three dimension structure parameters about the outer ring will be described in this section: the axial
214
projection width (W), the diameter (D) and its shape.
215
Figure. 7. Structure parameters of annular fan with outer ring
3.1. Axial Structure Parameter
216
First of all, all axial lengths in this paper are projected along the airflow direction. i is a custom
217
axial structure parameter being discussed in this paper that is termed as “aperture opening ratio”,
218
and it can be expressed as:
219
100% f
b
W W
i W
−
= × , (9)
In Figure. 7, Wf is the total axial length of the annular cooling fan, W is the width of the outer
220
ring, and Wb is the axial length of the fan blade.
Furthermore, based on the parts assembly requirements, a certain distance must be kept
222
between the front-edge-wall of the outer ring and the blade trailing edge. Therefore, i is always lager
223
than zero.
224
3.2. Radial Structure Parameter
225
As aforementioned, the winglet that is added on fan blades can change the inherent frequency
226
of the fan by changing its radial installation position. The outer ring is evolved from it to improve the
227
aerodynamic performance in this paper. Therefore, Lr is another custom radial structure parameter
228
termed as “overhang length” in this paper, which is expressed as:
229
2 f r
D D
L = − , (10)
Based on Figure. 7, Df is the diameter of the fan blade, and D is the external diameter of the outer
230
ring. In addition that the outer ring is connected to the fan blade, and Lr is nonnegative.
231
3.3. Shape
232
The flow state can be changed or even improved by setting flared structure for the duct flow
233
field. Based on the flow direction, the flared structure is divided into forward and reverse directions.
234
As shown in Figure. 8, based on the flat ring structure (shape 3), arc chamfer is performed on each
235
side of the outer ring respectively to study the influence of different shapes of the outer ring on the
236
aerodynamic performance.
237
Figure. 8.Outer ring with 3 different shapes
All the structural parameters of the outer ring have been discussed. Furthermore, two fans are
238
shown in Figure. 1 are taken as examples to be calculated to achieve the following goal: improving
239
the aerodynamic performance by the design of adding the outer ring to the common fan.
240
3.3. Aerodynamic Performance Comparison for 2 Kinds of cooling fan
241
Both common and annular cooling fans are calculated by the model described in section 2, and
242
the calculation results are shown in Figure. 9.
243
Based on Figure. 9, it can be found that the aerodynamic performance of the annular fan with
244
outer ring is obviously better than that of the common one without outer ring except for the fan
245
power. The fan power loss of the annular cooling fan increases due to the added weight of the outer
246
ring. However, the fan power changes so slight that the change can be neglected The air will gather
247
around the fan for the outer ring when it flows through the pipeline (as shown in Figure. 10). Hence,
248
it can reduce the energy consumption along the air flow path.
Figure. 9. Aerodynamic performance comparisons for common fan without outer ring and annular fan with
outer ring
(a) (b)
Figure. 10.Velocity contour profiles comparisons for (a) common fan without outer ring and (b) annular fan with outer ring (radial direction)
The outer ring improves the aerodynamic performance, and the change of the air flow contour
250
profiles in the backflow zone will be observed along the axial direction. The backflow zones are
251
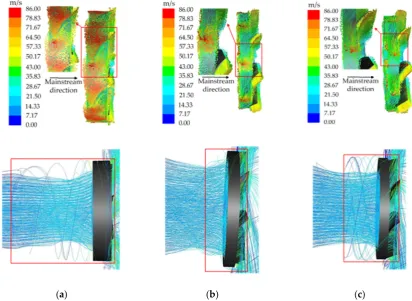
marked by the red box as shown in Figure. 11.
252
(a) (b)
Figure. 11.Velocity contour profiles comparisons for (a) common fan without outer ring and (b) annular fan
Based on the distribution of the velocity contour profiles, there exist backflow area for both
253
without and with outer ring cooling fans. Furthermore, it is larger for the fan with outer ring.
254
However, the velocity value of backflow is a larger for the fan without outer ring. As a result, the
255
structure of outer ring can guide the backflow forcibly and reduce the back flow degree. The static
256
efficiency of an annular fan is improved spontaneously.
257
4. Discussion
258
In above section, the structure parameters of the outer ring have been detailed defined. In this
259
section, the influence of the structure parameters on the aerodynamic performance of the outer ring
260
are analyzed one by one. Furthermore, some design laws of the outer ring with certain guide
261
significance can be found in the last part of this section.
262
4.1. Effects of the Axial Structure Parameters
263
Based on the discussions in above sections, the aperture opening ratio i is defined as the axial
264
structure parameters of the outer ring to be studied. In this section. Six annular fans with arbitrary
265
aperture opening ratios are calculated, and results are shown in Figure. 12.
266
(a) (b)
(c)
Figure. 12. Aerodynamic performance curves of (a) static pressure (b) fan power and (c) static pressure efficiency of
annular fan with outer ring with different aperture opening ratios
It can be found from Figure. 12 that annular cooling fans with different i have different
267
aerodynamic performances. The value of static pressure efficiency is the lowest when i=8.4%. With
268
the increases of i, the static pressure efficiency also increases. When the opening rate is 46.8%, the
efficiency reaches the top, after which, it decreases with the increases of i. This phenomenon will
270
provide a good guidance for the annular cooling fan design.
271
As discussed in section 1, the back flow can disturb the air flowing direction and result in
272
efficiency decrease of cooling fan. In Figure. 13, the back-flow area of three annular cooling fans with
273
different aperture opening ratio outer rings are compared. The backflow area value is the smallest
274
when i=46.8%, and it has the optimal aerodynamic performance, which is in accords with the change
275
tendency as shown in Figure. 12.
276
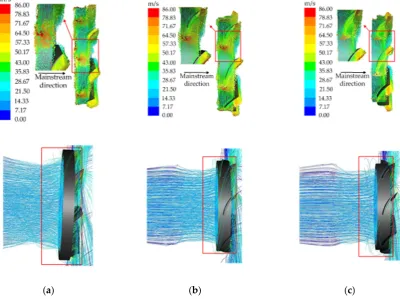
(a) (b) (c)
Figure. 13.Velocity contour profiles comparisons for annular fans with different aperture opening ratio outer
rings: (a) i=8.4% (b) i=4.8% and (c) i=75.0%
It can be found that the aperture opening ratio of the outer ring has a great effect on the
277
aerodynamic performance. However, they are not simply positively or negatively related. Combing
278
the primary evaluation index of static pressure efficiency, we infer that 41.6% to 46.8% is the optimal
279
aperture opening ratio range for the annular cooling fan.
280
4.2. Effects of the Radial Structure Parameters
281
As mentioned in section 3, Lr is defined as the radial relative parameter of the outer ring. Based
282
on the above discussions, an annular fan with the aperture opening ratio of 46.8% outer ring is
283
adopted for the investigation in this section. Four simulations of annular fans with different radial
284
blade extensions (Lr=0, 10, 20, 30 mm) are carried out. The results are shown in Figure. 14.
(a) (b)
Figure. 14.Aerodynamic performances comparisons for annular fans with with 4 different radial blade extension outer
rings: (a) static pressure & Fan power, (b) static pressure efficiency
Based on Figure. 14, we can find that: 1) both the static pressure and fan power decrease with
286
the increase of Lr under the same flow rate, 2) the static pressure efficiency in the high flow rate
287
region also decreases with the increase of Lr .However, in the middle-low flow rate region, the static
288
pressure efficiency does not change obviously. Therefore, it comes to a conclusion that the radial
289
blade extension has a slight effect on the static pressure efficiency. The same flow field analysis
290
method is used in this section, as shown in Figure. 15, to illustrate the effect of this parameter.
291
(a) (b) (c)
Figure. 15.Velocity contour profiles comparisons for annular fans with 3 different radial blade extension outer
As shown in Figure. 15, there are obvious back flow path lines around the outer ring except the
292
upstream region if Lr is nonzero. In addition, the area of this region and velocity value of backflow
293
both increase with the increase of Lr. A question then comes up, why is there back flow around the
294
outer ring after extending the blade length beyond the outer ring?
295
(a) (b)
Figure. 16. Static pressure contour profiles comparisons for annular fan with 2 different radial blade extension
outer rings: (a) Lr=0mm, (b) Lr=30mm
As shown in Figure. 16, the static pressure contour profiles on blades of the 2 fans are similar,
296
but negative pressure region is observed on the blade tip marked in Figure. 16(b). The region
297
mentioned above is produced for the complex blade shape and high rotating speed. However, the
298
pressure value of this region is lower than the inside of the outer ring. Therefore, the answer is that a
299
quantifiable pressure difference is produced here that leads to another back flow around the outer
300
ring as shown in Figure. 15(b) and (c). In conclusion, lower static pressure efficiency is caused by
301
these reasons.
302
It should be pointed that: during the research process, the cooling fan diameter remains
303
unchanged, and because the blade extension length changes as well as the diameter of the outer ring
304
changes. In addition, another conclusion can be drawn: if the radial blade extension is far smaller
305
than the fan diameter, the mainstream would distribute in the interior zone of the outer ring.
306
Furthermore, if the other fan parameters are kept constant, the annular fan has a worse aerodynamic
307
performance with a smaller outer ring diameter. Based on the similarity law of fan [1], the static
308
pressure and fan power decrease as the ring diameter decreases at the same flow rate. However, the
309
static efficiency of the fan does not change.
310
4.3. Effects of the Outer Ring Shapes
311
As shown in Figure. 8, shapes of outer ring can be categorized into non-chamfer shape (shape 3)
312
and chamfer shapes (shape 1 and 2). The chamfer shapes are categorized into front-edge-wall
313
(upstream of the airflow) chamfer (shape 2) and rear-edge-wall (downstream of the airflow) chamfer
314
(shape 1). Effects on aerodynamic performance for annular fan with 3 different outer ring shapes are
315
studied in this section.
316
Figure. 17 shows that the annular fan with shape 1 outer ring has the maximum static pressure
317
and static pressure efficiency. The annular fan with shape 2 outer ring has the minimum static
318
pressure and fan power. The annular fan with shape 3 outer ring has the largest fan power, but has
319
the lowest static pressure efficiency.
(a) (b)
Figure. 17. Comparisons of aerodynamic performance for annular fan with outer ring with 3 different outer ring shapes:
(a) static pressure & Fan power, (b) static pressure efficiency
Based on the velocity contour profiles of annular fans with three different shape outer rings (as
321
shown in Figure. 18), backflow is produced in all flow fields within 3 different fans. The area values
322
of backflow are similar to each other. But the velocity values of backflow are markedly different. For
323
annular fan with shape 2 outer ring, the backflow area is smallest. But the velocity value is smallest
324
for annular fan with shape 1 outer ring. And the air would be smoothed furthest when it flows
325
through the front-edge fillet structure, which can reduce the flow loss along the flow path.
326
Therefore, a proper fillet structure can improve the aerodynamic performance for the annular
327
cooling fan.
328
(a) (b) (c)
Figure. 18. Velocity contour profiles comparisons for annular fan with 3 different shape outer rings: (a) shape 1
4.4. Final Design Application
329
In this section, the correctness of the design method for the outer ring is validated by test. As
330
shown in Figure. 19, three cooling fans are selected for the test on the aerodynamic performance test
331
bench. The three fans have the same diameter and blade profile as mentioned in previous sections.
332
Fan (a) is a common cooling fan without outer ring. Interim annular cooling fan (b) with outer ring
333
has aperture opening rate of 8.4%, the radial extension length of the blade is 0mm, and the arc
334
chamfer structure is designed at the downstream side. The final annular fan (c) with outer ring has
335
the same structure parameters as fan (b) but the aperture opening ratio is 46.8%. Three designed
336
physical fans are shown in Figure. 19.
337
(a) (b)
(c)
Figure. 19. Structure comparisons of 3 different cooling fans: (a) common fan without outer ring (b) interim fan
with outer ring and i=8.4%, Lr=0mm (c) final annular cooling fan with outer ring and i=46.8%, Lr=0mm
All three fans are tested on the test pipeline bench and the test data are obtained to be
338
compared. From Figure. 20, it can be found that both the static pressure and the fan power are
339
significantly increased after adding the outer ring. At the flow rate of 3.8m3/s, the static pressure
340
increases with a degrees of 15.4% and 9.6% for the final annular fan and the interim fan, respectively.
341
However, the static pressure efficiency for the interim cooling fan is lower than the common fan at
342
all flow rates, and the largest decline of it reaches 6.1% at the flow rate of 2.9 m3/s. The main reason of
343
it is that the outer ring has a wider axial projection width and a larger back-flow area would be
344
produced based on the pattern shown in Figure. 13.
345
In conclusion, based on the evaluation index of static pressure, the aerodynamic performance of
346
annular cooling fan with outer ring is better than common fan without outer ring. However, the
347
aerodynamic performance of the cooling fan cannot be always improved by adding an outer ring.
Figure. 20.Aerodynamic performance comparisons for 3 different cooling fans
5. Conclusions
349
In this paper, the aerodynamic performance indexes of engine axial flow cooling fan are described.
350
The test and simulation methods of the cooling fan are introduced. Besides, the accuracy of the
351
simulation model is verified.
352
Based on the "small winglet" structure, annular cooling fan with outer ring is designed. Three
353
important structural parameters of the outer ring are defined and discussed.
354
The aperture opening ratio and shape of the outer ring have great influence on the aerodynamic
355
performance of the annular cooling fan, while the length of blade extension has minor influence on
356
the performance. Therefore, when designing the outer ring, the aperture opening ration and shape of
357
the outer ring are the primary parameters to be considered.
358
If the flow rate remains constant, the aerodynamic performance increase first and then decrease
359
with the increase of aperture opening ratio. Therefore, it is necessary ti select the appropriate
360
parameter value of the structure to optimize the aerodynamic performance.
361
The downstream side of the outer ring can smoothly guide the air flow. Because the diameter of
362
the outer ring increases gradually along the flow direction, it can accelerate air velocity, reduce the
363
possibility of backflow and improve the flow condition.
364
References
365
1. Bleier, F. P., Fan Handbook: Selection, Application, and Design, 1st ed.; McGraw- Hill: New York, USA , 1997;
366
pp. 33-151.
367
2. Hennissen, J., Modeling of axial fans for electronic equipment, Eurotherm Seminar 45th ed, Washington D C,
368
USA, 1995; 241-250.
369
3. Tallman, J., Lakshminarayana, B., Numerical simulation of tip leakage flows in axial flow turbines, with
370
emphasis on flow physics: Part I—Effect of tip clearance height, J. Turbomach, 2000, 123, 314-323.
371
4. Tallman, J., Lakshminarayana, B., Numerical simulation of tip leakage flows in axial flow turbines, with
372
emphasis on flow physics: Part II—Erect of outer casing relative motion, J. Turbomach, 2000, 123, 314-323.
373
5. Han, S. B., Zhong, J. J., Effect of blade tip winglet on the performance of a highly loaded transonic
374
6. Chen, H. S., Tan, C. Q, Numerical and experimental study on effects of hub leakage on performance and
376
flow field of axial fan, J. FMI, 2006, 34, 1-6.
377
7. Wu,Y., Effect of hub-ratio on performance of asymmetric dual-rotor small axial fan, J. Fluid Dynam, 2013,
378
3, 81-84.
379
8. Storer, J. A., Cumpsty, N. A., An approximate analysis and prediction method for tip clearance loss in
380
axial compressors, J. Turbomach, 1994, 116, 648-656.
381
9. Liu, X., Design and prediction of three dimensional flows in a low speed highly loaded axial flow fan,
382
IJFMS, 2013, 6, 94-104.
383
10. Li, M., Off-design performance analysis of axial flow fan in helicopter, J. Donghua University (English Ed),
384
2011, 28, 23-30.
385
11. Norimasa, S., Ying, Z. J., Flow fields with tip leakage vortex in a small axial cooling fan, J. Therm Sci, 2008,
386
17, 156-162.
387
12. Du,J., Lin, F, Numerical investigation on the self-induced unsteadiness in tip leakage flow for a transonic
388
fan rots, J. Turbomach, 2010, 132,1-9.
389
13. Li, Z., Jin, Y. Z., Effect of tip flange on tip leakage flow of small axial flow fans, J. Therm Sci, 2014, 23,
390
45-52.
391
14. Gong, H. L., Je, H. B., Structure of tip leakage flow in a forward-swept axial-flow fan, Flow Turbul
392
Combust, 2014, 70, 241-265.
393
15. Shigemitsu, T., Fukuda, H., Unsteady flow condition between front and rear rotor of contra-rotating sized
394
axial fan, J. Fluid Dynam, 2017, 20, 371-385.
395
16. Zhu, T., Experimental and numerical investigation of the tip clearance noise of an axial fan, ASME Turbo
396
Expo, 2013, 35, 1-13.
397
17. Sasaki, S., Fukuda,M., Prediction of aerodynamic noise in a ring fan based on wake characteristics, J.
398
Therm Sci, 2011, 20, 144-149.
399
18. Day, I. J., Active suppression of rotating stall and surge in axial compressors, J. Turbomach, 1993,115, 1-8.
400
19. Shangguan, W. B, Mo, W. B.., Study on the effect of structure and parameters of engine annular cooling
401
fans on aerodynamic performances, Chinese ICEE, 2017, 38, 56-62.
402
20. Nashimoto, A., Akuto, T., Aerodynamic noise reduction by use of a cooling fan with winglets, SAE
403
Technical-Paper, doi: org/10.4271/2003-01-0531.
404
21. Nashimoto, A., Fujisawa, N., Measurements of aerodynamic noise and wake flow field in a cooling fan
405
with winglets, J. Visual, 2004, 7, 85-92.
406
22. Ota, H., Yuichi, K., Development of high efficient radiator cooling fan for automotive application, SAE
407
23. Zhou, Z. H., Chen, S. W., Experiment study of aerodynamic performance for the suction-side and
409
pressure-side winglet-cavity tips in a turbine blade cascade, Exp Therm Fluid Sci, 2018, 90, 220-230.
410
24. Jiang, Y., Zhang, B., CFD study of a new annular lift fan configuration with high lift efficiency, MDPI
411
Aerospace , 2017, 04, 1-13.
412
25. Wu, Y. M., Jin, Y. Z., Effect of hub-ratio on performance of asymmetric dual-rotor small axial fan, J. Fluid