Received July 25, 2020, accepted August 22, 2020, date of publication September 8, 2020, date of current version September 24, 2020. Digital Object Identifier 10.1109/ACCESS.2020.3022818
Latest Research Trends in Gait Analysis Using
Wearable Sensors and Machine Learning: A
Systematic Review
ABDUL SABOOR 1, TRIIN KASK1, ALAR KUUSIK1, (Member, IEEE), MUHAMMAD MAHTAB ALAM 1, (Senior Member, IEEE),
YANNICK LE MOULLEC 1, (Member, IEEE), IMRAN KHAN NIAZI 2,3,4, (Senior Member, IEEE), AHMED ZOHA 5, (Member, IEEE), AND RIZWAN AHMAD 6, (Member, IEEE)
1Thomas Johann Seebeck Department of Electronics, Tallinn University of Technology, 12616 Tallinn, Estonia 2Center of Chiropractic Research, New Zealand College of Chiropractic, Auckland 1149, New Zealand 3Health and Rehabilitation Research Institute, AUT University, Auckland 1010, New Zealand 4Department of Health Science and Technology, Aalborg University, 9100 Aalborg, Denmark 5James Watt School of Engineering, University of Glasgow, Glasgow G12 8QQ, U.K.
6School of Electrical Engineering and Computer Science, National University of Sciences and Technology (NUST), Islamabad 44000, Pakistan
Corresponding author: Abdul Saboor ([email protected])
This work was supported in part by the European Union’s Horizon 2020 Research and Innovation Program under Grant 668995, in part by the European Union Regional Development Fund through the framework of the Tallinn University of Technology Development Program 2016–2022, under Grant 2014-2020.4.01.16-0032, and in part by the Estonian Research Council under Grant PUT-PRG 424.
ABSTRACT Gait is the locomotion attained through the movement of limbs and gait analysis examines the patterns (normal/abnormal) depending on the gait cycle. It contributes to the development of various applications in the medical, security, sports, and fitness domains to improve the overall outcome. Among many available technologies, two emerging technologies that play a central role in modern day gait analysis are: A) wearable sensors which provide a convenient, efficient, and inexpensive way to collect data and B) Machine Learning Methods (MLMs) which enable high accuracy gait feature extraction for analysis. Given their prominent roles, this paper presents a review of the latest trends in gait analysis using wearable sensors and Machine Learning (ML). It explores the recent papers along with the publication details and key parameters such as sampling rates, MLMs, wearable sensors, number of sensors, and their locations. Furthermore, the paper provides recommendations for selecting a MLM, wearable sensor and its location for a specific application. Finally, it suggests some future directions for gait analysis and its applications.
INDEX TERMS Gait analysis, machine learning, wearable sensors, survey, medical applications.
I. INTRODUCTION
Walking is a fundamental human activity that involves the combined efforts of the muscles, brain and its nerves [1]. Gait refers to cyclical locomotion achieved through walking. This includes the movements of arms, legs, hip, feet, and limbs [2]. Generally, the gait of each person is unique depending on the gait parameters such as gait phases, step length and muscle force, etc., [3]. Therefore, it helps to understand the individ-uality and liberty in humans. The analysis and characteriza-tion of gait parameters is called gait analysis. Gait analysis helps in investigating different musculoskeletal functions and The associate editor coordinating the review of this manuscript and approving it for publication was Lorenzo Mucchi .
gait parameters. Therefore, gait analysis supports numerous applications in healthcare [4]–[8], security [9]–[11], sports and fitness domains [12], [13]. For example, Huet al. [4] provide a vision-based solution for the Freezing of Gait (FoG) detection. Similarly, [5], [6] and [8] are gait based assess-ment solutions for Parkinson Disease (PD), cerebral palsy and variety of chronic diseases progression, respectively. Gait analysis requires data acquisition and extraction tools of the gait features. For gait analysis and feature extraction, various wearable and non-wearable solutions are proposed in the literature. Non-wearable methods generally consist of vision-based, environment-vision-based, Radio Frequency (RF) based solu-tions. In contrast, wearable technologies are composed of accelerometer, gyroscope and force sensors, etc.
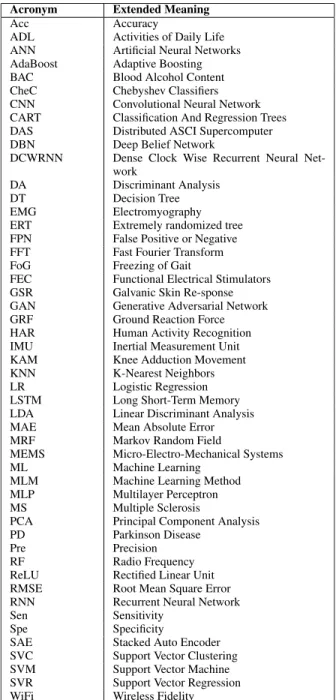
TABLE 1. List of important acronyms.
Vision-based gait analysis use either a video camera [14], [15], a thermal vision sensor [16], [17] or a depth camera [18], [19]. Alternatively, the environment-based gait assess-ment rely on floor-deployed pressure sensors [20], [21] and infrared sensors [22], [23]. However, both such solutions require a controlled research facility for the analysis that limits their applicability in external/outdoor environments [24]. RF-based solutions are made of radars [25], [26], other microwave sensors [27] and Wireless Fidelity (WiFi) beacons [28], [29], and suffer from the complexity involved in instal-lation. In contrast, wearable sensor solutions are cheap and can be used outside controlled environments while the user is performing daily activities naturally. Wearable sensors are worn or attached to various parts of the body to monitor vitals
and gait parameters. Therefore, wearables are frequently con-sidered as the the most suitable technology for the healthcare, security, sports, and fitness applications [30]–[32]. In gait analysis, accelerometers [33], [34], gyroscopes [35], Inertial Measurement Units (IMUs) [36] and force sensors [37] are widely used to measure gait characteristics [38]. For example, Derawi et al. [33] measure the cycle length using a hip-worn accelerometer for gait based authentication. Similarly, a gyroscope attached to the trunk is used to monitor the change in the trunk angle for fall detection in [35].
Different sensors enable collecting a lot of data for gait analysis; then, the challenge is that data processing and learn-ing algorithms are required to make decisions. For example, the decision to stimulate the muscles based on irregular gait for fall prevention. Threshold-based statistical solutions are widely used for such processing. Additionally, it helps in analyzing the effects of various independent gait variables on dependent gait variables. Multivariate statistical techniques such as Linear Discriminant Analysis (LDA) and Principle Component Analysis (PCA) help in representing the gait data for linear analysis [39]. Similarly, such methods reduce the dimensionality of the data. However, these approaches often generate a high number of false alarms during gait classifica-tion. The statistical approaches produce less efficient results when the nature of the problem is nonlinear or complex [40]. One more drawback of employing statistical methods for the gait analysis is their sensitivity to noisy data that leads to performance degradation [41]. Therefore, the latest research is moving towards Machine Learning (ML) because of high accuracy in processing the gait parameters based on application requirements [42].
TABLE 1 lists the important acronyms and TABLE 2
provides an overview of the target areas and limitations of the existing reviews. Taoet al.[43] provide a detailed review of the gait analysis and wearable sensors. Similarly, [24] presents a review of gait analysis using wearable and non-wearable systems. However, both studies are relatively old (2012 and 2014) and do not include the Machine Learn-ing Methods (MLMs). Likewise, [44] presents a system-atic review of gait analysis and wearable sensors but is not specific to ML. The studies [45], [46] provide reviews on accelerometer-based gait analysis and inertial sensor-based gait analysis, respectively. However, there are various other wearable sensors such as gyroscope, pressure sensor, etc., which are not covered in such reviews. Reviews on gait based recognition (identifying a person based on walking pattern) are given in [47], [48]. However, these studies are specific to the security applications of gait analysis and are not purely based on wearable sensors and ML. The papers [49], [50] are specific to deep learning approaches for security and health-care using gait analysis. Similarly, a survey on gait analysis limited to fall detection and fall prevention is presented in [51]. A broader review of human gait analysis along with approaches, applications, and ML is provided in [40].
In contrast to the above works, we present a survey specific to wearable sensors combined with ML to highlight the latest
trends in the domain of gait analysis. The reason for selecting these technologies is their ability to develop environment-independent and realistic applications. The overall contribu-tions of this paper are listed as follows:
• It provides an overview of gait analysis and wearable sensors for gait analysis.
• It provides a review of the latest research trends in gait analysis using wearable sensors and ML. The review includes an overview of selected papers, publication details, MLMs, and key parameters of selected papers. • It summarizes the key insights from the state of the art
research studies and identify gaps and opportunities to further advance the research.
• It highlights the applications of gait analysis and rec-ommends (based on analysis) the optimal (widely used) MLM, wearable sensor, and its location for a specific application.
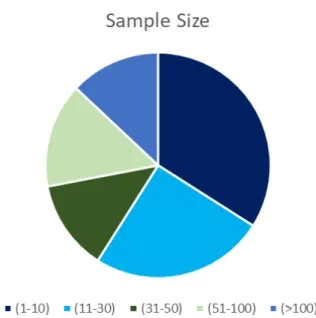
• It presents the relationship between sample size and application based on the analysis.
• It highlights the future research directions for the researchers working in the domain of gait analysis. The rest of the paper is organized as follows. Section II
explains the methodology for paper selection. Gait analysis along with its applications are introduced in Section III. SectionIVdescribes the wearable sensors for gait analysis. A comprehensive review of the selected papers is presented in SectionV. Finally, SectionVIand SectionVIIIprovide the future directions and conclusion of the work, respectively.
II. METHOD
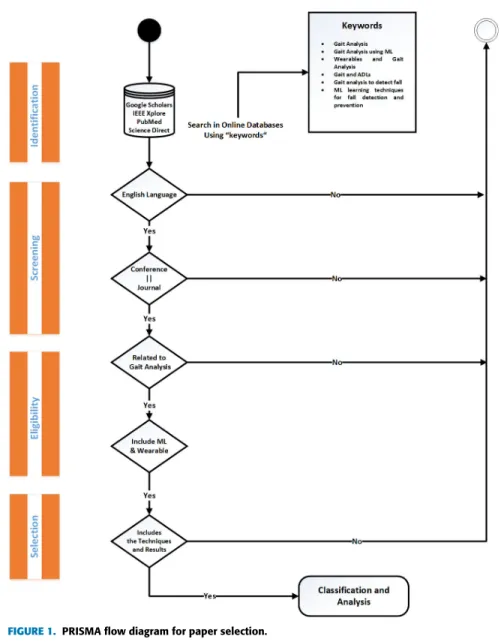
For the systematic review and analysis, the Preferred Reporting Items for Systematic Reviews and Meta-Analyses (PRISMA) method is used [52]. The paper selection method based on PRISMA is illustrated in figure1and summarized in what follows.
The PRISMA method is based on four steps as given below:
1) Identification 2) Screening
3) Eligibility Checking 4) Selection
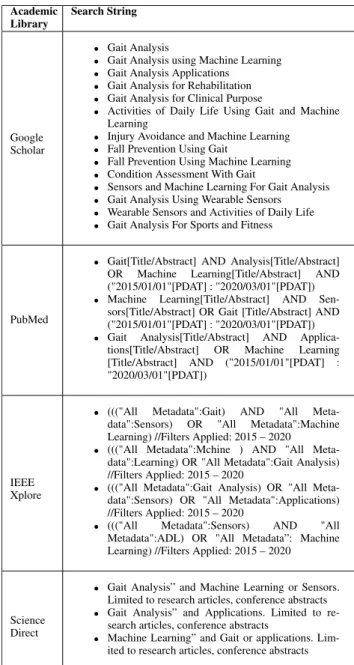
The identification process involves the recognition of arti-cles for this systematic literature review. Therefore, we have explored following scientific libraries: Google Scholar, PubMed, IEEE Xplore, and Science Direct for paper iden-tification and selection. Multiple data strings have been used to search papers in different libraries as shown in TABLE3.
The identification process using the above-mentioned strings resulted in more than 5000 documents. During the identification process, only the papers from 2015 onward were considered as we aim to highlight the latest trends in this domain. In the initial screening, a total of 754 papers were shortlisted based on their title by 31st January, 2020. All these papers were further processed based on their abstract, conclusion, and language, reducing the number of papers to
272. In the eligibility check phase, these papers were down-loaded and a critical selection criterion is performed based on the full-text read. The parameters for eligibility check are:
• The published paper should be a journal article or a conference paper;
• The published paper should deal with gait analysis; • The published paper should include MLMs;
• The published paper should use wearable sensors for data acquisition. Hence, all the vision-based papers were removed;
• The paper should present a concrete methodology and results.
Finally, after performing the above-mentioned steps and removing 21 duplicate papers, we were left with 33 papers which have been selected for this review. However, it is important to provide an overview of gait and wearables before reviewing the selected papers. Therefore, the next two sec-tions provide the details of gait and wearables.
III. GAIT ANALYSIS
Gait is the periodic movement of hands and feet [53]. Differ-ent gait patterns are distinguished by differences in velocity, limb movements, force, and ground contact duration. Gait analysis is the study of gait (for example human) using visual assessment, and instruments such as cameras and sensors [54]. It accesses the walking condition of an individual that is beneficial for designing various applications in medical, security, sports, and fitness domain [55]–[59]. The overall gait is divided into several phases that result in defining the walking pattern. It is important to understand the function-ality of each stage to identify the changes in normal gait precisely. Therefore, sectionIII-Apresents an overview of the gait phases.
A. GAIT PHASES
A gait cycle is defined as the duration between the consecu-tive strikes of the same foot during human locomotion. The overall gait cycle is divided into two major phases, as shown in Figure2:
1) Stance Phase: In this phase (Figure 2(1)), the foot remains in contact with the ground. This phase con-tributes to the 62% of the gait cycle [60]. The Stance phase is further divided into 5 phases.
• Initial Contact • Loading Response • Mid Stance • Terminal Stance • Pre-Swing
2) Swing Phase: In this phase (Figure 2(2)), the foot remains in the swing position without the contact of ground. This phase contributes to 38% of gait cycle. The swing phase is subdivided in three phases.
• Initial Swing • Mid Swing • Terminal Swing
TABLE 2. Overview of key paramet ers.
TABLE 2. (Continued.) Overview of key paramet ers.
TABLE 2. (Continued.) Overview of key paramet ers.
Initial Contact:
In this phase, the heel strikes the ground and initiate the joint loading response pattern. The initial contact makes 0-3% of the overall gait cycle.
Loading Response:
This phase covers 3-12% of the gait cycle that includes the flat foot placement on the ground. It allows flexion in the knee for shock absorption. This phase starts after the initial contact and remains until the opposite foot is raised for the swing.
Mid Stance:
In this phase, the shank moves forward to support the forward foot propulsion. It constitutes a 12-31% portion of the gait cycle. The mid stance phase starts from the lifting of the opposite foot and continues until the bodyweight is aligned to the forefoot.
Terminal Stance:
It makes 31-50% of the overall gait cycle and starts with the rise of the heel from the ground. It lasts until the opposite foot strikes the ground. This is the final phase in which the single-limb supports the movement. Also, the bodyweight moves ahead of the forefoot in this phase.
Pre-Swing:
It is the final sub-phase of the stance that consists of 50-62% of the overall gait cycle. This phase acts as a transition between the stance and swing phase. It starts with the initial contact of the opposite limb and remains until the toe-off of the first foot.
Initial Swing:
Initial swing is the first stage of the swing phase that covers 62-75% of the gait cycle [60]. It starts with the rise of the foot from the ground and lasts until the swing foot is opposite to the stance foot. It causes a flexion in the knee and ankle, causing the clearance of the foot over the ground.
Mid Swing:
The mid-swing covers 75-85% of the gait cycle. During this phase, the thigh reaches its maximum advancement by continuing the limb advancements. This phase starts after the initial swing phase and remains until the hip and knee flexion postures become equal.
Terminal Swing:
The final phase of the gait cycle makes 85-100% of the overall cycle. This phase completes the limb advancement through knee extension. At the end of this phase, the foot goes in the state of initial contact.
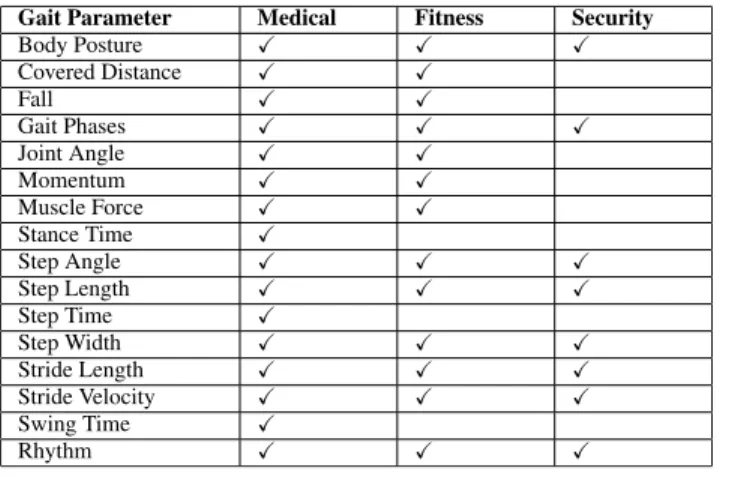
Each phase follows a unique sequence of motion to reach the motion objective. Therefore, these phases facilitate the design of various applications in the domain of medical, sports, and security. An overview of different gait patterns useful for the specific applications is presented in TABLE4
[24] and a tree diagram of the sub-categories of gait based applications is presented in Figure 3. Gait phases in one cycle are determined by algorithms mostly for generating a user-specific gait template. This is specifically important in wearables designed for the elderly. The biggest challenges
TABLE 3.Strings used in search engines of academic literature databases.
in gait template generation is the adaptability of algorithms when gait speed changes. That is why it is recommended that at least 3 different algorithms are used when generating such template (third as a fallback algorithm) [61]. The splasticity of algorithms used is mostly affected by the wearer’s age. Young adults (aged 20-30) have more consistent walking pat-tern and gait symmetry while individuals older than 50 have shown to exhibit left-right gait asymmetry and lack of gait consistency. It is also hard for the algorithms used to detect phase transitions [62].
Correct gait phase detection is important especially in med-ical applications (both temporal and spatial gait parameters) because they allow disease and/or traumatic event assessment and provide data for physical therapy for treatment optimiza-tion. Gait analysis in wearables are used for example with
FIGURE 1. PRISMA flow diagram for paper selection.
FIGURE 2. Gait phases in a normal gait cycle. (a) Stance phase; (b) Swing phase [43].
stroke patients or patients with underlying neurodegenerative disease (such as Multiple Sclerosis (MS)). For MS gait cycle-based control of Functional Electrical Stimulators (FES) for drop foot compensation is the main application. In more
general cases, spatial gait parameter such as stride length can be used to detect a fall [63].
As mentioned in SectionI, we are only considering the gait analysis techniques based on wearable sensors. Therefore,
SectionIVprovides an overview of the wearable sensors used for gait analysis.
TABLE 4. Gait parameters and applications.
IV. WEARABLE SENSORS FOR GAIT ANALYSIS
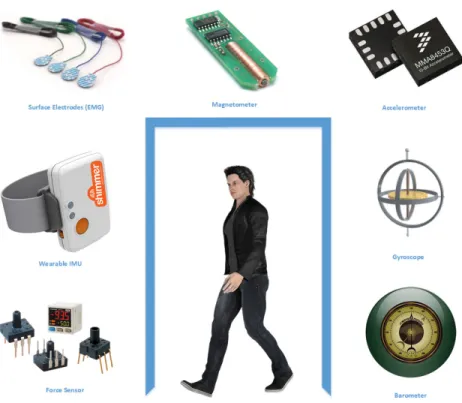
There exist various technologies for gait human analy-sis such as marker and marker-less vision-based technolo-gies, radio emission and reflection based technologies for mobility (localization beacons) and motion speed (Doppler radar) assessment, and wearable motion sensors. Vision-based sensors require an infrastructure setup for analysis [24]. Therefore, this solution is intrusive for Activities of Daily Life (ADL) monitoring and gait support scenarios. Besides, the setup required for vision-based motion analysis is expensive. Radio emission sensors lack precision for high resolution gait analysis and also require supporting infras-tructure. Thus, we shall only consider wearable (motion) sensors in this review because of practical use aspects. The history of wearable sensors starts in the 15th century with the development of watches. But, the actual rise in this domain begins in the 19th century. For example, a wearable camera was developed in 1907 for pigeon photography. Similarly, Galvanic Skin Response (GSR) was invented before world war II to detect the lie using pulse rate and blood pressure. After that, numerous wearable sensors were developed, such as accelerometer, gyroscope and force sensors, etc. Generally speaking, wearable sensors are lightweight, cheap, and can be used to collect the data without disturbing the daily life activ-ities [64]. The same sensors are widely integrated into hand-held and smartphone devices, making possible smartphone-based human motion assessment. The overall specifications of widely used wearable sensors (as shown in Figure 4) in gait analysis are presented in the following:
A. ACCELEROMETER
Wearable accelerometers used today are virtually exclu-sively based on triaxial Micro-Electro-Mechanical Systems (MEMS) relying on capacitance change measurements [65]. Typical resolution of accelerometers of wearable devices is 14-16 bits and the full scale acceleration is 20-160 m/s2.
Among the other MEMS motion sensors accelerometers have the lowest energy consumption of some tens of microwatts in average. Due to the fact that accelerometer also measures the gravity it can be well used for the absolute orientation detection and Zero velocity UPDate (ZUPD) of gait phasing [66]. From the other side, linear displacement calculation requires double integration of the accelerometer output sig-nal. Physical sensor nonlinearities cause a bias error that will quickly accumulate without appropriate compensation of ZUPD or other methods and is the main obstacle of precise dead reckoning motion tracking. Finite sampling rate also causes motion measurement errors proportional to the speed and duration of fast movements. Fortunately, modern wear-able MEMS acccelerometers provide sampling rate of up to 1 kHz that is exceeding the measurement rate used by the majority of gait analysis experimenting researchers.
B. GYROSCOPE
A gyroscope is also a triaxial MEMS device measuring the angular velocity of an object, i.e. body part [67]. A gyroscope works on the Coriolis principle in which the angular momen-tum is measured based on the linear motion [68]. Typical resolution and sampling rate of modern gyroscopes is similar to accelerometers, maximum angular speed is around 1000-2000 degrees per second; energy consumption is an order of magnitude higher. Gyroscope sensors can be placed on dif-ferent parts of the human body such as foot, ankle, knee, and waist allowing to identify the human posture and gait phases [69]. The benefits of gyroscopes compared to accelerome-ters are smaller bias drift and measurements insensitivity to shocks and gravity field impact.
C. MAGNETOMETER
The magnetometer measures the direction, strength, and rel-ative change of a magnetic field [70]. In the context of wearables, Earth’s magnetic field is observed relying on Hall effect. Magnetometers can be beneficial in measuring the absolute orientation of a subject for gait analysis [43]. The sampling rate and Signal to Noise Ratio (SNR) resolution of micromechanical magnetometers tends to be lower, 10-100Hz and 8-12 bits respectively. Therefore magnetometers are used as assistive motion sensor components.
D. COMBINED IMU
IMU is a combined sensor device that measures the linear acceleration, angular speed, (absolute) orientation, and grav-itational force of a subject using the combination of linear accelerometer, gyroscope, and magnetometer [71]. Typically, Mahony filter with a supplemental Kalman filter is used for physical sensor fusion of triaxial IMU devices [72]. Some devices, i.e. Bosch Sensortec chips directly output absolute orientation in quaternions with the update rate of 100Hz. Because of its tiny size and internal sensor fusion implemen-tation, the IMU is the most popular and precise wearable sensor type for developing gait analysis applications [73].
FIGURE 3. Common applications of gait analysis.
E. BAROMETER
MEMS barometers (altimeters) are also used additionally to IMU devices. Such sensors output altitude information and are used for detecting up- or downstairs movements. How-ever, barometric sensors are rarely deployed for gait analysis due to rather slow reaction and inaccuracy.
F. FORCE AND STRAIN SENSORS
Force or pressure sensing is used in robotics, haptic sensing including interactive toys, medical devices [74]–[76]. The force sensors are divided into four main types: capacitive force sensors, piezoelectric force sensors, resistive, and opti-cal fibre bragg grating force sensors. The pressure force sen-sor is widely used for gait analysis from simple by embedding them in the shoes or soles [24]. In such case sensor measures the Ground Reaction Force (GRF) [77]. By a simple case a single force sensor is used for gait phase separation, for exam-ple on foot-drop electrical stimulation devices. In sophisti-cated cases whole pressure map of the footstep is derived by the sensor. Sensoria footwear can be mentioned as a typical commercial example here. Force (strain) sensors are also used as goniometers for joint angle measurements [78]. There is a tendency to move towards textile-based stretching strain sensors [79]. Xenoma e-skin strain sensitive garment is a typical product example of such sensors.
G. ELECTROMYOGRAPHY (EMG)
An EMG measures muscle activities such as the volun-tary or involunvolun-tary contraction of muscles [80]. It can
dis-close muscle dysfunction, nerve dysfunction, and transmis-sion problems between the nerve and muscle all causing gait impairments [81]. EMG electrodes of the sensor capture electrical signals used for muscle contraction [82]. After acquisition, these signals can be further analyzed to detect abnormalities. The EMG sensor uses two types of electrodes: needle-like invasive electrodes for high dept and high sensi-tivity measurements and non-invasive less sensitive skin sur-face electrodes [83]. The sursur-face EMG (sEMG) testing offers an assessment of various gait-related features like changes in muscle properties paresis and muscle stiffness and tension [24].
Along with the above-mentioned wearables, there exist various other wearable sensors with applicability in gait anal-ysis such as electromagnetic tracking system (ETS) [43].
Nowadays, many studies are focusing on combining the data of multiple sources as a sensor data fusion to improve the performance of gait analysis. The sensor fusion could be divided into homogeneous and heterogeneous solutions [84], [85]. Homogeneous sensor fusion combines data from the same type of sensors such as wearable-wearable, while heterogeneous sensor fusion merges data from different sen-sor types like wearable-vision. The performance of gait anal-ysis is highly dependent on the underlying algorithms for the analysis. Generally, different gait-based human activities such as lying down, falling, jogging, and running are closely related. The statistical approaches find it hard to classify such activities accurately, especially noisy, nonlinear, and complex data. The MLM proves to be an excellent alternative
FIGURE 4. Examples of wearable sensors for gait analysis.
to provide high classification accuracy of gait parameters. Therefore, we have only explored the MLMs in this review. The comprehensive survey of gait analysis techniques based on wearable sensors and MLMs is presented in next Section.
V. NARRATIVE REVIEW ON GAIT ANALYSIS USING WEARABLE SENSORS AND ML
The aim of this paper is to present and analyse the recent trends in gait analysis based on wearables and machine learn-ing. Therefore, as mentioned earlier in Section II, a total of 33 papers have been selected for the period 2015 to 2020. A general overview of the selected papers along with key findings and limitations is presented in SubsectionV-A. This is followed by a qualitative synthesis in SubsectionV-B.
A. OVERVIEW OF SELECTED PAPERS
Wu and Wu [86]:
This paper aims the accurate identification of the gait. Each participant performs a 10 m walk carrying a force plate at the foot for data acquisition. The data values are further normalized based on body weight and duration of gait. The gait variability of six gait parameters is analyzed using the coefficient of variation. Support Vector Machine (SVM) [87] is used to evaluate the gait symmetry in this study. The analysis is done using three different kernel types (Linear, Polynomial, Gaussian Radial Basis Function) in SVM for each dataset [88]. A 101-dimensional gait pattern is used for SVM training. Finally, a six-dimensional cross-validation scheme was proposed to evaluate the performance of SVM.
Key Findings:
The classification performance of SVM is maximum when the gait parameters are obtained using PCA. The PCA
removes the redundant gait information that results in obtain-ing accuracy (90%), sensitivity (90%), and specificity (88%). These results are better than using a 101-dimensional gait pattern (in which PCA is not used) with accuracy (87%), sensitivity (86%), and specificity (85%). The second key finding of this study is SVM with a non-linear kernel obtains better intrinsic information hidden in gait parameters than SVM with a linear kernel.
Limitations:
The authors use statistical learning algorithms to quantify gait symmetry. However, statistical symmetry measures are computationally expensive, and their explication is less clear than discrete approaches.
Chen and Xue [89]:
This paper aims the recognition of different human activ-ities using sensors. A mobile-based accelerometer is used to acquire data from subjects while performing eight different ADL. Additionally, an android based application is developed to facilitate the data acquisition method. A modified CNN that works on selecting the best number of epochs is used for activity recognition. It includes three convolution layers and three pooling layers. During this study, the width of the convolutional kernel is set to two. The suggested CNN shows better accuracy results than SVM and an 8-layer Deep Belief Network (DBN) [90].
Key Findings:
The paper shows that CNN offers the highest HAR accu-racy (93.8%) as compared to SVM (90%) and DBN (88%). One more finding is that both the SVM and DBN show better recognition accuracy when combined with FFT during the extraction process. Lastly, the average accuracy of CNN is
minimum (88.3%) during walking identification as compared to falling, running, walking quickly, etc. This is because of walking is sometimes confused with quick walking and walking up/downstairs.
Limitations:
The proposed solution applies CNN to the entire dataset of the sensor. It impacts the computational power and introduces energy inefficiency for the mobile wearable device [91].
Zebinet al.[92]:
This paper’ aim is the the activity recognition of six differ-ent and common daily life activities. In the study, five inertial sensors are attached to the lower body for data collection. The CNN [93] is used to identify the different ADL such as sitting, standing, walking, laying down, walking upstairs and walking downstairs. Furthermore, Rectified Linear Unit (ReLU) and soft-max pooling are used to improve the accuracy of the recognition. During the data acquisition, the data is collected in the form of vectors from sensors. The signals from the accelerometer and gyroscope in the inertial sensor are pre-processed and segmented in 128 different values. The perfor-mance of CNN is compared against the Multilayer Perceptron (MLP) [94] and SVM. The CNN shows better computational load and classification accuracy as compared to the other algorithms.
Key Findings:
The Deep Convolutional Neural Network (DCNN) offers the highest HAR accuracy (97.01%) as compared to SVM (96.4%) and MLP (91.7%). Similarly, the DCNN shows better performance in terms of computational load that is (3.53 seconds) as compared to SVM (10.6 seconds) and MLP (6.7 seconds). One more finding is that increasing convolu-tion layers reduces the complexity of derived gait features that helps in distinguishing gait features accurately. However, it also increases the computational load. Finally, it is observed that wider kernel size and smaller pooling size improves the recognition accuracy of DCNN.
Limitations:
The proposed approach requires less computational power after training the data. However, the training cost of CNN is high [95].
Ordóñez and Roggen [96]:
This paper targets human activity recognition using wear-ables. Five different ADLs are recognized using this method. Furthermore, this study targets different sporadic right arm gestures. For data acquisition, 7 IMU sensors and 12 accelerometers are placed on the different parts of the human body. The data is pre-processed using linear inter-polation [97] for channel normalization in the interval [0, 1]. The dataset is acquired after 3 hours long recording in which a subject is asked to repeat each gesture 70 times. The overall dataset is divided into classes where each class represents a feature. Furthermore, Skoda dataset [98] is used to evaluate the presented method. The DeepConvLSTM [99], consisting of 8 layers, is used for the recognition. In the proposed method, the length of the sliding window is 500 ms, and the step size is 250 seconds. The DeepConvLSTM yields
the class probability distribution for every timestamp (sliding window). Finally, the F-measure [100] (a measure of correct classification of each class) evaluates that targets the correct classification.
Key Findings:
The DeepConvLSTM offers the maximum F1-score (0.958) as compared to CNN (0.893). It is also able to distinguish closely-related activities such as opening/closing doors efficiently. One more observation is that the increasing number of layers improves accuracy but also increases the computational load.
Limitations:
The proposed study uses a Graphical Processing Unit (GPU) that consumes high energy and is thus not feasible for wearables devices. Secondly, the sample size is small (4 subjects) that is not appropriate to accumulate and analyze gait features.
Neverova [101]:
This paper’s objective is the biometric authentication based on gait analysis. A time series is collected using the inertial unit of smartphone. The obfuscation based regularization is performed on the data to differentiate the notion of device and user. Furthermore, data processing is performed to generate a 14-dimensional vector consisting of normalized coordinates, magnitudes, and angles. The overall method consists of two components: feature extraction pipeline and the biometric model for the verification. A universal background model and scoring are used for continuous authentication. Dense Clock Wise Recurrent Neural Network (DCWRNN) is proposed and compared with CWRNN [102] and Recurrent Neural Network (RNN) [103] in this study. The presented DCWRNN outperforms the other algorithms in feature learning and user authentication.
Key Findings:
This paper shows that Conv-DCWRNN provides the max-imum feature extraction and learning accuracy (69.41%) as compared to Conv-LSTM (68.92%) and Conv-CWRNN (68.83%). Similarly, Conv-DCWRNN outperforms the other algorithms in terms of Equal Error Rate (EER) and Half Total Error Rate (HTER). One more advantage of this scheme is that it can be used for sequential analysis of data such as gestural recognition from visual data.Limitations:
The performance of this scheme is highly dependent on the smartphone. The overall performance can be compromised with the orientation sensitivity and position of the motion sen-sor. Additionally, data collection via continuous monitoring in a dynamic environment for such long duration is challeng-ing and thus difficult to perform/reproduce in practice?.
Zhenet al.[104]:
This paper aims to distinguish the ADL and fall events. A total of 500 datasets are generated for ADL and fall events via a mobile application using inertial sensors. For analysis, the threshold-based algorithm is used along with the SVM. It consists of four phases: data training, signature segment generation, feature selection, and training. The proposed model merges the angel with SVM to detect the fall. Finally,
the mobile application generates the alarm in case of a fall to notify the relent person.
Key Findings:
This paper’s key finding shows that acceleration-based parameters alone achieve lower sensitivity (80%) and speci-ficity (81.5%). In contrast, the combination of angle and acceleration parameters results in better sensitivity (99%) and specificity (96.5%).
Limitations:
The major limitation of this study is the low number of subjects (5) for analysis. Generally, a larger dataset offers better performance for feature analysis and classification.
Chenet al.[105]:
The objective of this paper is to recognize human activities for a better understanding of human behavior. The dataset provided by the Wireless Sensor Data Mining (WISDM) Lab [106] is used for the analysis. The dataset is mainly obtained using a mobile-based tri-axial accelerometer. The LSTM [107] based cell structure is used for activity recognition. The data is normalized with zero mean and standard variance for the algorithm to remove the extra noise. After that, the data is segmented using a sliding window of size 50 in the proposed model. The LSTM generates the feature vectors based on the accelerometer data that is then classified (by multi-classifier) for activity recognition.
Key Findings:
This paper shows that the LSTM-based approach for fea-ture extraction achieves an accuracy of 92.1%.
Limitations:
The training data used in this analysis have fluctuations due to the small data-size and non-uniform distribution of data. Furthermore, the LSTM confusion matrix indicates many prediction errors in similar activities like jogging and walk-ing upstairs. Therefore, this study requires more data, more robust regularization, or fewer model parameters.
Campset al.[108]:
This paper targets FoG detection in Parkinson’s Disease (PD) patients. During data acquisition, an IMU collects a 9-channel signal from subjects. This study uses CNN with eight layers for FoG detection. The CNN uses a window size of 2.5 seconds to achieve more accurate results. Spectral win-dow stacking (SWS) uses the information of two consecutive 9-channel signals and joins them in the spectral domain. The SWS takes two arguments to analyze the window at a specific time t and previous time t-1. After that, FFT is computed for each window by keeping the first symmetric half of the win-dow. Finally, both the windows are stacked together, resulting in a new window of 64×18. Data augmentation transforms the training dataset in reasonably coherent identical dataset versions with a certain probability. The hypermeter tuning process calculates such a probability to prevents overfitting. In addition, data augmentation uses shifting and rotation to distribute the same data in different parts of the sample. The first convolution layer fuse this information using a 3×18 shape kernel. The same process is followed in the first four layers with the difference in the kernel dimension. Fifth and
sixth layers are dense layers consisting of 32 neurons con-nected with all the input and output cells. Finally, the output layer consists of one neuron that is used for FoG detection.
Key Findings:
This study shows that the 1D-ConvNet achieves a better Geometric Mean (GM) between the sensitivity and specificity (90.6). In contrast, the most efficient state of the art algorithm based on SVM achieves a GM of 83.
Limitations:
The proposed scheme requires almost 25% more param-eters for classifying one sample than SVM. It makes this scheme computationally expensive and not energy efficient for wearable sensors.
Gharaniet al.[109]:
The goal of this paper is the identification of useful gait features for estimating blood alcohol content (BAC). For that, an iPhone application ‘‘DrinkTRAC’’ is developed to collect the gait data using the inertial sensor in mobile. Drink-Track application asks two questions from the users regarding perceived intoxication and the number of consumed drinks. After that, the users are asked to perform a 5 step gait task via the application. Sensor fusion removes the gravitational effect to yield linear acceleration. A sliding window extracts noise free features such as mean, standard deviation, energy, and correlation in time or frequency domain. Additionally, the FFT [110] is used to compute the energy in the frequency domain. MLP, along with Bayesian Regularization Neural Network (BRNN), is used to model the relationship between the input, gait, and output (BAC value). Furthermore, it solves the overfitting problem of the data. The performance of the MLP scheme is compared with SVM and linear regression.
Key Findings:
This paper shows that the BRNN outperforms SVM and linear regression in terms of the correlation coefficient, MAE, RMSE, relative absolute error, and root relative squared error. Furthermore, the Bayesian regularization based training algo-rithm outperforms the Conjugate-gradient and Levenberg-Marquardt training algorithms. The Bayesian regularization shows minimum MSE of 5.09e-06 as compared to Conjugate-gradient (5.80e-04) and Levenberg-Marquardt (1.90e-05).
Limitations:
This study uses limited ecological momentary assessment (EMA) data, almost 70%. Generally, the training with limited data can lead to the wrong interpretation of results, less accu-rate BAC detection in this scenario. Also, it involves only ten participants, with the majority of white females, which limits the generalizability of the solution. Therefore, this study does not apply to young adults with light alcohol use. Additionally, the difference in alcohol tolerance is not included in this study that can affect the accuracy of the solution.
McGinniset al.[111]:
This paper aims at the gait speed measurement in patients suffering from a neurological disorder. The data is collected from two groups (sample and control group) using accelerom-eters. The control group consists of people with no gait impairments. At the same time, the sample has a majority
of multiple sclerosis (MS) and a few healthy persons. The subjects for both groups perform a six-minute walk test on the treadmill at three different speeds. Additionally, people with MS also conducts the Postural Control Test (PCT) [112] and complete an oral history and physical activity-related questionnaire. The accelerometer data generates the six times series from each device after applying low pass and band-pass filtering. These time series are further divided into two series with five seconds of non-overlapping windows to estimate walking speed. A total of 32 features are extracted from each window for analysis. The Support Vector Regression (SVR) [113] is used to estimate the walking speed of the subjects. The models are trained for seven combinations of sacrum using supervised machine learning. The leave-one-subject-out approach [114] is applied to improve the accuracy of the model. Furthermore, Bland-Altman limits of agreement [115] with 95% confidence interval, RMSE, and slope-intercept model is generated to analyze the performance of walking speed. Finally, the subjects are classified based on the com-parison of truth values and walking speed.
Key Findings:
The paper shows that the gait speed estimation error and impairment severity are not correlated. It also shows that the data from multiple sensors and locations (sacrum, thigh, and shank) yields better RMSE (0.12 m/s) and a 95% confidence for the error of (-0.25, 0.22) m/s. In contrast, a single sensor from sacrum achieves RMSE of 0.15 m/s and error of (-0.31, 0.29) m/s. Furthermore, sensor fusion systematically overestimates speed by only 0.01 m/s.
Limitations:
The major limitation of this study is data collection from treadmill walking; therefore, it is not a generalized solution for ambulation in natural environments. Also, the model training is performed on the data of multiple groups such as control and healthy groups. A specific MS patients based model training has the potential to improve the results further.
Zhao and Zhou [116]:
This paper aims to improve gait recognition. Inertial sen-sors in a smartphone are used for data acquisition. Addition-ally, the proposed approach uses the image-based approach using the time series of inertial sensors for gait recogni-tion. The proposed scheme consists of four steps: gait detec-tion, angle embedded gait dynamic image (AE-GDI), feature extraction, and classifier. For gait starting position detection, a grid-based greedy method is used. Quasi-equally spaced grid is also used to overcome the peak rejection problems [117] arises by the grid-based greedy method. The AE-GDI is generated using inertial data that is composed of sliding windows. The angle generated by the data in 3D spaced is used as gait features. The AE-GDI provides the periodicity of gait features and much richer 2D features. The CNN with seven layers is used in the last two steps for the classification. Convolution layer provides a D matrix called a feature map based on the input of AE-GDI. For a richer representation of the input, each convolutional layer produces multiple feature maps. In seven layers, there are two max-pooling layers to
reduce the number of parameters and computation. Eventu-ally, the full-length classifiers provide the required vector for the classification.
Key Findings:
The proposed scheme uses a gait segmentation algorithm based on greedy searching that results in avoiding the mis-judgment of fraud/misleading gait cycles. The proposed solu-tion shows an accuracy of 96.6% using two combined gait cycles. This accuracy is 13.6% better as compared to Cosine Similarity [118]. One more finding is that CNN, with non zero paddings in each convolution operation, offers better performance than zero paddings. The padding avoids the shrinking of data (reduction in volume size) and allows more space for the kernel to cover the data image, which helps in the more accurate analysis.
Limitations:
The AE-GDI is sensitive to sensor location and installation. The complex and noisy data from a loosely installed sensor can reduce the accuracy of the proposed scheme. Lastly, CNN is computationally expensive.
Murad and Pyun [119]:
The goal of this paper is human activity recognition using wearable sensors. Five publicly available datasets collected by wearables are used for recognition purposes [120]–[124]. These datasets consist of the activities performed in dif-ferent environments. The Deep Recurrent Neural Networks (DRNN) is used for activity recognition. Data from mul-tiple sensors is converted into windows and for the input to the DRNN model. It calculates the prediction score of each window that is fused with the softmax layer to pro-duce the class membership probability. The DRNN model is trained using 80% of data, while the remaining 20% data is used for the testing. The mean cross-entropy [125] between the ground truth values and the predicted output is used as the cost function. It uses an optimization algorithm (Adam) [126] to reduce the cost function by back-propagating the gradient and updating the model parameters. Furthermore, the dropout techniques resolve the overfitting of data [127]. There different DRNN methods are used in this study: unidi-rectional DRNN, bidiunidi-rectional DRNN, and cascaded DRNN. But, the accuracy of each method varies with the datasets. The proposed model is compared with various MLMs such as SVM, sequential Extreme Machine Learning (EML), CNN, and Random Forest. DRNN shows the highest classification accuracy and per-class precision.
Key Findings:
This paper shows that a four-layered unidirectional DRNN model achieves the best accuracy (96.7%) for the UCI-HAD dataset as compared to SVM (96%) and CNN (95.2%). The same DRNN model shows the maximum accuracy of 97.8% for the UCS-HAD dataset. In contrast, the three-layered bidirectional DRNN model yields the best performance for complex opportunity dataset. The cascaded DRNN model is best for the Daphnet FOG dataset and the Skoda dataset. The findings show that the introduction of sufficient deep layers helps in extracting discriminative features effectively.
Limitations:
The implementation of LSTM-based DRNN with various deep layers and hyper parameters on low power devices such as wearable sensors is a challenging task due to high computational cost.
Dehzangiet al.[128]:
This paper aims to distinguish the human based on his gait. It uses a total of 10 subjects, wearing five IMUs each, for the data acquisition. After data acquisition, the statistical approaches remove the noise from the data. Also, a 10th order Butterworth bandpass filter [129] generates the desired frequency elements from the IMUs data. Additional bandpass filtering is applied to the data for cycle extraction and inter-ference elimination. After that, FFT transforms the signal in the frequency domain. The amplitude threshold is used to overcome the irregularities in the signal. The data cycles gen-erated from ankle sensors are used as a reference gait cycle. After that, a time-frequency division block converts the input signal to time and frequency space. A supervised DCNN is proposed for motion-based gait authentication. It takes a 3D image as input and converts it to predictive vectors. A gradient descent method minimizes the softmax function loss during training. The overall DCNN model is composed of convolution, pooling, ReLU, and a fully connected layer. In the convolution layer, a set of predefined filters perform the convolution of the input. Pooling combines the closely asso-ciated features by applying the chosen operator. ReLU layer introduces the non-linearity in the data without changing the dimension of data. Finally, the multi-sensor fusion based on early and late fusion integrates the information from various sensors to improve the gait authentication.
Key Findings:
The analysis shows that the angular velocity shows better recognition accuracy than the acceleration data in the major-ity of cases. It also finds that the gyroscope is more suitable for the trunk while the accelerometer shows better results at the lower limbs. Furthermore, it is observed that the early and later fusion further increase the identification accuracy to 93.36% and 97.06%, respectively.
Limitations:
This study lacks the tuning procedure for data of different characteristics from multiples sensors and locations. Addi-tionally, this study involves only ten participants that are not suitable for the training of the model.
Steffanet al.[130]:
The objective of the paper is to identify the stable and unstable body postures using the optimal combination of the sensors. During the data acquisition, different combinations of 6 inertial sensors are tested from 34 possible sensors place-ment. Also, a multi-marker motion capture system obtains the normalized motion of different subjects. The Master Motor Map (MMM) provides body data for motion analysis. Various MLMs (as defined in TABLE 8) are trained and evaluated using up to six sensors to find the optimal classification set and sensors set. Finally, the F1-score is used to determine the optimal number of sensors along with the classifier.
Key Findings:
The first key observation is that using data from more sensors do not always lead to better results. In reality, using only relevant sensors reduce the dimension of useless data and improves the outcomes. Secondly, a specific sensor loca-tion is not always optimal for every algorithm, where each algorithm offers the best performance for different places. Therefore, the best solution is based on the combination of an algorithm and sensor. A multilayer perceptron with six sensors achieves the highest F1-score of 82% as compared to SVC, Bayes, KNN.
Limitations:
This work computationally emulates the IMU data; therefore, it does not consider the noise, calibration issues, and other IMU parameters that limit the solution’s generalizability.
Almaslukh [131]:
This paper targets human activity recognition with high accuracy and low computational cost. The inertial sensor (of the smartphone) collects the data from subjects while performing six different ADLs. The median filter [132] removes the noise from the data. Furthermore, the But-terworth low-pass filter [129] is applied to separate the accelerometer signals. The Stacked Auto Encoder (SAE) is applied to distinguish different ADLs. The proposed SAE consists of two autoencoders on top of each other along with a softmax layer. Overall 70% subject’s data is used for training while 30% is for testing. There are two training phases: unsupervised pre-training and supervised fine-tuning. The fine-tuning of the model is done using a different number of hidden layers, the number of neu-rons in each layer, and the max epoch to perform the task efficiently.
Key Findings:
The SAE shows better recognition accuracy of 97.5 % as compared to multiclass linear SVM (96.4 %), AdaBoost (94.33 %) and CNN (95.75 %). Furthermore, the aver-age recognition time of the proposed work is 0.0375 ms, which is better than the SVM time of 0.2724 ms.
Limitations:
The training of the proposed method is performed on an offline computer; therefore, it is not practical to measure and analyze gait features dynamically. Additionally, the method requires tuning the model parameters to enhance the accuracy further.
Chenget al.[133]:
This paper aims to monitor the mobility and gait for the early detection of PD patients. The mobile-based accelerom-eter cumulates data from patients and control group over 24 weeks. The data is further processed with the Euclidean norm to remove 14% of passive monitoring data [134]. For activity recognition, this study uses a nine layered DNN [135]. It results in distinguishing the gait activities from stationary activities and profile the gait and balance segments with high accuracy.
Key Findings:
This study shows that passive data collection using a smart-phone provides insights into daily functioning. The correla-tion of mobility features with the proposed system evaluates the PD severity in clinics. Additionally, the proposed model distinguishes gait activities from stationary activities with an accuracy of more than 98%.
Limitations:
The passive monitoring of data requires extensive time periods, such as 24 weeks in this case. Therefore, it is very exhaustive and time consuming for participants and well as researchers. Similarly, DNN is computationally expensive.
Zdravevskiet al.[136]:
This paper seeks to identify the intended jogging periods automatically. Also, it investigates the system’s performance using single and multiple sensors. The data is extracted from the subjects using single and multiple accelerometers. The data is segmented using two sliding windows that result in obtaining the time and frequency features. After that, the fea-ture algorithms are applied to reduce the number of feafea-tures in the dataset. Four different MLMs (SVM, Random Forest, Logistic regression, Extremely Randomized Trees) are used and compared in terms of the accuracy of correctly recog-nized instances.
Key Findings:
This paper shows that the identification accuracy depends on the model and feature set. For non-overlapping small segmentation window, the accelerometer placed on the hip shows better accuracy. In contrast, for large overlapping seg-mentation window, the ankle based accelerometer gives bet-ter performance. Nevertheless, both the approaches achieve accuracies of more than 99%. One more key finding of this paper is that the combined sensors do not provide significant improvement as compared to a single sensor. Furthermore, it finds that the logistic regression offers better performance as compared to SVM, RF and Extremely Randomized Trees (ERT).
Limitations:
The dataset is specific to fifteen years old participants. Therefore, it most likely not be able to identify jogging periods accurately in older participants.
Abdulhayet al.[137]:
This paper aims to diagnose PD patients using gait anal-ysis. The gait reading is collected from patients and healthy subjects using force sensors. Eight different force sensors are placed below their shoes to measure Vertical GRF (VGRF) using a two-minute walking test. The VGRF is plotted against the time that gives various time-domain features such as the gait pattern of the subject. The time is distributed in different points to distinguish the stride phases. Furthermore, the VGRF values are passed through a Chebyshev high pass filter to remove the extra noise. The analysis shows that the gait pattern of PD patients is considerably different from normal persons. For example, the duration of stance time is longer in PD patients. Similarly, the PD patients touch the heel and toe at the same time, which is different from the
normal gait pattern. Finally, an FFT is applied to the signal in the frequency domain to classify the tremor and severity of the PD.
Key Findings:
The paper finds that a healthy person exerts more heal force on the ground as compared to toe force. In contrast, toe fore is greater than the heel force for a PD person. Additionally, it shows that the relation between the frequency distribution and tremor severity. For a PD patient, the frequency peak starts shifting towards lower frequency as the disease pro-gressed. This scheme achieves an average accuracy of 92.7 % for PD diagnose using gait analysis.
Limitations:
This paper is using general gait parameters such as stance and swing time. However, only general parameters cannot capture full information in the gait signal, which reduces the identification accuracy [138].
Gadaleta and Rossi [139]:
This paper targets authentication based on the walking style. Smartphone-based inertial sensors collect the motion data for analysis. The data is gathered over six months using five-minute sessions in variable conditions. An android appli-cation is developed to save the data from sensors and to transfer it to the cloud for further processing. After that, the cubic Spline interpolation [140] is applied to represent the data in evenly spaced points. Furthermore, a Finite Impulse Response (FIR) filter [141] helps removing motion artefacts and noise. Template-based matching is also applied to pre-cisely assess the walking cycles regardless of the different orientation of the smartphone. In this study, CNN helps in feature extractions after the pre-processing of the data that results in the first convolution layer CL1. In CL2, the class variant and discriminant features are identified, and max-pooling is applied to reduce the dimension of the features further. Finally, the fully connected layers (FL1 and FL2) use the output of CL2 and neurons to generate the output vector that is used for authentication.
Key Findings:
This paper shows that a reliable authentication only needs fewer than five gait cycles in 80% of the cases. Furthermore, this scheme achieves a misclassification rate of less than 0.15 for gait based authentication.
Limitations:
The orientation and sensitivity of the smartphone-based inertial sensor can affect accuracy. Moreover, deep learning algorithms require high processing power.
Xiaet al.[142]:
The topic of this paper is FoG assessment in PD patients. On-body accelerometers collect the data for analysis. Three-sigma-rule [143] helps removing the outliers, in which the mean is replaced with a median. This study uses CNN for FoG detection. For the training, the time series is divided into sliding windows of the optimal lengths. The overall detection process is divided into five portions. In the first three portions, the features are extracted using different kernel sizes and scales (with max-pooling and ReLU activation). All
the learned features in the previous layers are fused in the fourth section using two schemes. The first scheme performs the fusion by flatting and concatenating features map of each signal. The second scheme uses a convolution operator for features abstraction from the time series. Finally, section five converts the latent features in the form of vectors to distinguish different classes. Furthermore, a 10-fold classifi-cation is used on CNN that divides the data into 10 sets. One subset is used for testing, while the rest of the subsets are used for training and validation. This process is repeated ten times (using each subset for testing) to improve the detection accuracy.
Key Findings:
The study finds that there is a significant difference in normal walking and FoG gait. Also, it shows that the results from the patient dependent dataset are much better those from the patient independent dataset. The proposed scheme using the patient dependent data set and softmax classifier achieves the sensitivity of 99.85 % and specificity of 99.99 %.
Limitations:
One drawback of this paper is the limited dataset based on ten patients. Also, some of the PD patients maintain regular gait, similar to healthy subjects. Therefore, it would be better to add more participants for data acquisition and divide them into various groups based on disease, age, etc.
Asuncionet al.[144]:
The aim of this paper is the use of gait in human authentica-tion. Two independent inertial sensors are placed at the thighs for data acquisition using a 7 m walk. The dataset is divided into 40-48 gait cycles with roll, pitch, and yaw angles. After that, it is plotted in the form of a scalogram, as a function of time and frequency. This study uses CNN to classify each person based on the pitch, roll, and yaw. The CNN model accepts [152×300x3] images and requires four hyperparam-eters and pooling layers. The pooling layer helps reducing the dimension of the data set. The ‘‘TrainNetwork’’ function from MATLAB is used for the data training. Additionally, stochastic gradient descent with momentum (SGDM) opti-mizer speeds up the training process [145]. During the cross-validation, 20% of the data is used for cross-validation, while 80% is used for training in every kth fold. A total of four datasets are considered in which three sets are used to separately train the parameters (roll, pitch, yaw). Finally, a total of 40 (10×10) confusion matrices are generated by using left thigh yaw data that help in calculating the precision, false discovery rate (FDR), accuracy, and misclassification rate (MR) of the data.
Key Findings:
The paper shows that the combined data from pitch-roll-yaw (PRY) shows better precision and accuracy than individ-ual parameters. The PRY data achieves 96.70 % precision and 93.02 % accuracy from the left thigh. The achieved precision is 2.88 %, and the achieved accuracy is 3.48 % higher than the best individual parameter yaw. The same trend is observed from the data of the left thigh.
Limitations:
PRY data training is more than three times longer as com-pared to the training time of the individual parameter. Also, the placement of the smartphone on thighs is not feasible for daily use applications.
Huanget al.[146]:
This paper targets acoustic-based gait recognition. The gait characteristics are measured using a microphone. The subjects perform a 60-70 seconds walk in the circle of seven feet diameter. The microphone detects the footstep peaks and generates a time series for analysis. The time series generates a vector consisting of mean, SD, skewness, and kurtosis. For gait recognition, multiple ML classifiers are applied, such as SVM, KNN, AdaBoost, and random forests. Finally, the less informative features are removed using feature analysis.
Key Findings:
This paper shows that each MLM offers advantages and disadvantages based on the features. For example, random forest and linear SVM offers the maximum mean score (almost 80%). Contrarily, random forest and the extra tree provides the maximum cross-validation score (0.815) using five folds. Furthermore, this study shows that the number of folds in classification algorithms can make a significant change in classification accuracy.
Limitations:
The limitation of this paper is that the acoustic-based anal-ysis is prone to environmental noise. Minor background noise can decrease the recognition accuracy. Therefore, this solu-tion is only applicable in controlled/laboratory environments.
Aichaet al.[147]:
This paper aims to develop an early risk detection system using wearable sensors to prevent falls. A triaxial accelerom-eter is used for data acquisition from a cohort aged between 65 and 99 years. Furthermore, the questionnaire and physi-cal tests generate additional datasets. The locomotion bouts with acceleration in three dimensions are analyzed using a classification algorithm [148]. This study uses a combination of the recurrent and convolutional model called ConvLSTM for the detection. In the experiments, 90% of the data is used for training, while 10 % is used for testing. A total of five experiments are performed in this research. The first experi-ment compares the performance of DNN with the state of the art technologies. In the second experiment, the performance of DNN in fall prediction is measured. The third experiment explores the model improvements based on learning to iden-tify the people depending on their gait. The fourth experiment investigates the person-specific information and its impact on model improvement. The last experiment focuses on cleaning the data to improve the overall prediction.
Key Findings:
This paper finds that deep learning models provide a higher fall risk prediction accuracy than biomechanical models. One more finding is that the ConvLSTM model is significantly faster than the LSTM model. Also, the results show that the use of general characteristics such as age and weight as auxiliary output improves the accuracy of the ConvLSTM
model. Furthermore, it is observed that the pre-processing of data improves the performance of the model.
Limitations:
The authors do not extract the gait features during the pre-processing step [149]. Furthermore, this study does not use the angle or angular velocity, which limits its accuracy.
Rescioet al.[150]:
This paper aims to pre-fall detection reliably and effi-ciently by improving the mean lead time before the impact. The data is collected using sEMGs located at the lower limbs of the subjects. For the risk assessment, the data set is generated from four different ADLs. The data is passed through the bandpass filter to remove the noise. Furthermore, the sEMG data is processed by full-wave rectification by passing through a Butterworth filter. After that, a calibration phase is performed to reduce the inter-individual variability of sEMG signals between different users. Finally, Markov Random Field (MRF) based Fisher-Markov selector and LDA are performed for features selection and classification of the pre-impact event.
Key Findings:
This paper shows that inertial based systems act slower to recognize the fall risk as compared to the sEMG-based proposed solution. Hence, the proposed solution shows the potential to detect an imminent impact due to unbalance gait faster. However, the inertial based solution provides better sensitivity and specificity (both in the range of 90-100 %) as compared to the proposed solution. The sEMG based solution achieves a specificity of 89.5 % and a sensitivity of 91.3 %.
Limitations:
This paper examines the advantages of sEMG for fall detection in a controlled environment, which limits its appli-cability. Furthermore, incorrect placement of sEMG probes leads to false results. Therefore, an efficient sEMG based wearable solution is required for realtime applications.
Hsiehet al.[151]:
This paper’s aim is to identify the fall characteristics to develop a strategic plan for fall prevention. Participants per-form seven different falls and six ADLs for data acquisition wearing an accelerometer. The pre-processing of data is done using a sliding window that also helps in segmenting ADL data frames. A hierarchical fall detection consisting of a threshold-based approach and a machine learning approach is used for fall detection. The threshold-based approach aims to identify falls and ADLs. The SVM is used in a machine learn-ing approach to train fall events classifiers uslearn-ing a kernel-based on radial basis function (RBF) [152]. Finally, the fall direction identification is used on the identified fall events.
Key Findings:
The proposed scheme achieves high sensitivity (99.83 %), specificity (98.44 %), precision (98.67 %), negative pre-dictive value (98.44 %), and accuracy (99.19 %) for fall detection. The same trend is also visible in fall direction iden-tification. It shows that the highest fall direction identification error is in the backward and left lateral direction, and the lowest error is in the forward direction.
Limitations:
This study is unable to distinguish the fall and lying activity efficiently. Therefore, it generates a high percentage of false-positive results (16.67%) for lying activity.
Putraet al.[153]:
This paper aims to align the falls with the characteristic features of the fall stages for the better identification of falls. Additionally, this paper addresses the multi-peak problem using event-triggered machine learning approach EvenT-ML. The EvenT-ML approach consists of the initial buffer, peak detection, sample gathering, and multi-peak detection. The data is acquired using an accelerometer from the subjects while doing falls and various ADLs. Additionally, a second dataset is obtained from young adults in which each person performs several falls and ADLs. Finally, different classifiers such as CART, k-NN, LR, and SVM are used for training and testing, while the F-score is used to analyze the algorithm’s performance.
Key Findings:
The paper shows that features such as acceleration expo-nential moving average, velocity, and energy expenditure after aligning with fall stages improve the fall detection rate and computational cost. Additionally, the proposed EvenT-ML achieves better precision, recall, and F-score value as compared to the fixed-size non-overlapping sliding window (FNSW) and fixed-size overlapping sliding window (FOSW) approaches. Also, the LR combined with EvenT-ML achieves the best results as compared to KART, KNN, and SVM.
Limitations:
The study uses a binary classification for fall activities that results in identifying the near-fall event as a fall event, which decreases fall detection accuracy.
Ghazaliet al.[154]:
The goal of this paper is to identify various sports activities using IMU. For data collection, the participants are asked to perform walking, running, jumping, and sprinting. The data is pre-processed and labeled based on activities with a sliding window of 2.56 seconds. Finally, a total of 24 features are extracted based on accelerometer data. Finally, different classifiers such as DTs, SVM, discriminant analysis, KNN, and ensemble classifiers are used and compared in terms of correctly identifying the sports activities.
Key Findings:
This paper shows that the cubic SVM achieves the highest accuracy (91.2 %) for sports activity recognition as compared to DT, DA, KNN, where this accuracy is less than 90 %.
Limitations:
The major limitation of this study is the confusion between the jogging and sprinting activities, reflected by a high per-centage (20%) of false-negative results for sprinting activity.
Rastegariet al.[155]:
This paper aims at finding the optimal gait features to improve the assessment and diagnosis of gait. For analysis, the data is collected using accelerometers from the healthy elderly, mild PD patients, and geriatrics. The subjects perform a 10 meters normal walk without any hindrance four times.