University of Louisville
ThinkIR: The University of Louisville's Institutional Repository
Electronic Theses and Dissertations
8-2019
An explainable recommender system based on
semantically-aware matrix factorization.
Mohammed Sanad Alshammari
University of Louisville
Follow this and additional works at:
https://ir.library.louisville.edu/etd
Part of the
Other Computer Engineering Commons
This Doctoral Dissertation is brought to you for free and open access by ThinkIR: The University of Louisville's Institutional Repository. It has been accepted for inclusion in Electronic Theses and Dissertations by an authorized administrator of ThinkIR: The University of Louisville's Institutional Repository. This title appears here courtesy of the author, who has retained all other copyrights. For more information, please contact
Recommended Citation
Alshammari, Mohammed Sanad, "An explainable recommender system based on semantically-aware matrix factorization." (2019).
Electronic Theses and Dissertations.Paper 3273.
AN EXPLAINABLE RECOMMENDER SYSTEM BASED ON
SEMANTICALLY-AWARE MATRIX FACTORIZATION
By
Mohammed Sanad Alshammari
Bachelor of Education in Computer Science, University of Ha’il, KSA, 2008 M.Sc., University of Leicester, UK, 2011
A Dissertation
Submitted to the Faculty of the
J.B. Speed School of Engineering of the University of Louisville in Partial Fulfillment of the Requirements
for the Degree of
Doctor of Philosophy in Computer Science and Engineering
Department of Computer Engineering and Computer Science University of Louisville
Louisville, Kentucky August, 2019
Copyright 2019 © by Mohammed Sanad Alshammari
AN EXPLAINABLE RECOMMENDER SYSTEM BASED ON
SEMANTICALLY-AWARE MATRIX FACTORIZATION
By
Mohammed Sanad Alshammari
Bachelor of Education in Computer, University of Ha’il, KSA, 2008 M.Sc., University of Leicester, UK, 2011
A Dissertation Approved On
July 15, 2019
by the following Dissertation Committee
___________________________________ Dr. Olfa Nasraoui, Dissertation Director
___________________________________ Dr. Hichem Frigui _________________________________ Dr. Nihat Altiparmak ___________________________________ Dr. Antonio Badia ___________________________________ Dr. Scott Sanders
DEDICATION
ACKNOWLEDGMENT
First of all, I would like to praise and thank Almighty God (Allah) for everything he blessed me with; without his grace, mercy, and well, nothing would have happened. He alone helped me to succeed.
Then, I appreciate my sponsor, the government of Saudi Arabia and Northern Border University or supporting me to pursue the Ph.D. degree. Also, I pay recognition to the University of Louisville and the Department of Computer Engineering and Computer Science for allowing me to join the graduate program and advance in my studies and research.
Next, I would like to express my sincere gratitude to my advisor Prof. Olfa Nasraoui for the con-tinuous support of my Ph.D. study and related research, for her patience, motivation, and immense knowledge. Her guidance helped me at all the times of research and writing of this thesis. I could not have imagined having a better advisor and mentor for my Ph.D. study. Besides my advisor, I would like to thank the rest of my thesis committee for serving as my committee members and for their insightful comments and encouragement throughout my Ph.D. Study: Prof. Hichem Frigui, Dr. Antonio Badia, Dr. Nihat Altiparmak, and especially Dr. Scott Sanders who has been very helpful in the user study evaluation. Also, I thank my fellow friends and labmates for supporting and encouraging me to strive towards my goals.
A special thanks to my family. Words cannot express how grateful I am to my mother Aljazi and father Sanad for all of the sacrifices that they have made on my behalf. Their unconditional love, caring, and support since day one back in 1992 were what brought me where I am today.
I would like to express appreciation and gratitude to my dear wife, Alwadhhaa, who spent sleepless nights taking care of our children and was always my closest support in the moments when there was no one to answer my needs.
life. You are my main source of motivation and encouragement to achieve my goals. I am grateful to Allah that you are in my life.
Last but not least, I would like to thank my siblings: my brothers Abdulrahman and Salman and sisters Mona, Nawal, Fatimah and Tahani and their families for supporting me spiritually throughout writing this thesis and my life in general.
ABSTRACT
AN EXPLAINABLE RECOMMENDER SYSTEM BASED ON
SEMANTICALLY-AWARE MATRIX FACTORIZATION
Mohammed Sanad Alshammari
July 15, 2019
Collaborative Filtering techniques provide the ability to handle big and sparse data to predict the ratings for unseen items with high accuracy. Matrix factorization is an accurate collaborative filtering method used to predict user preferences. However, it is a black box system that recom-mends items to users without being able to explain why. This is due to the type of information these systems use to build models. Although rich in information, user ratings do not adequately satisfy the need for explanation in certain domains. White box systems, in contrast, can, by nature, easily generate explanations. However, their predictions are less accurate than sophisticated black box models. Recent research has demonstrated that explanations are an essential component in bringing the powerful predictions of big data and machine learning methods to a mass audience without a compromise in trust. Explanations can take a variety of formats, depending on the recommendation domain and the machine learning model used to make predictions. Semantic Web (SW) technolo-gies have been exploited increasingly in recommender systems in recent years. The SW consists of knowledge graphs (KGs) providing valuable information that can help improve the performance of recommender systems. Yet KGs, have not been used to explain recommendations in black box systems. In this dissertation, we exploit the power of the SW to build new explainable recommender systems. We use the SW’s rich expressive power of linked data, along with structured information search and understanding tools to explain predictions. More specifically, we take advantage of se-mantic data to learn a sese-mantically aware latent space of users and items in the matrix factorization
model-learning process to build richer, explainable recommendation models. Our off-line and on-line evaluation experiments show that our approach achieves accurate prediction with the additional ability to explain recommendations, in comparison to baseline approaches. By fostering explain-ability, we hope that our work contributes to more transparent, ethical machine learning without sacrificing accuracy.
TABLE OF CONTENTS
Page DEDICATION iii ACKNOWLEDGMENT iv ABSTRACT vi LIST OF TABLES xiLIST OF FIGURES xiii
1 INTRODUCTION AND MOTIVATION 1
1.1 Introduction . . . 1
1.2 Problem Statement . . . 2
1.3 Assumptions and Research Scope . . . 2
1.4 Research Contribution . . . 3
1.5 Document Organization . . . 4
2 BACKGROUND AND LITERATURE REVIEW 5 2.1 Semantic Web . . . 5
2.1.1 The Early use of the Semantic Web in User Profile Building . . . 5
2.1.2 RDF . . . 7
2.1.3 SPARQL . . . 8
2.2 Recommender Systems . . . 9
2.2.1 Introduction . . . 9
2.2.3 Semantic-Aware Content-based Recommender Systems . . . 11 2.2.4 Collaborative Filtering (CF) . . . 18 2.2.5 Explanations . . . 22 2.2.6 Inference of Facts . . . 39 2.3 Summary . . . 40 3 PROPOSED WORK 41 3.1 Introduction . . . 41
3.1.1 Semantic Knowledge Graphs (KGs) . . . 41
3.1.2 The Semantic Web’s Effect in Latent Space . . . 42
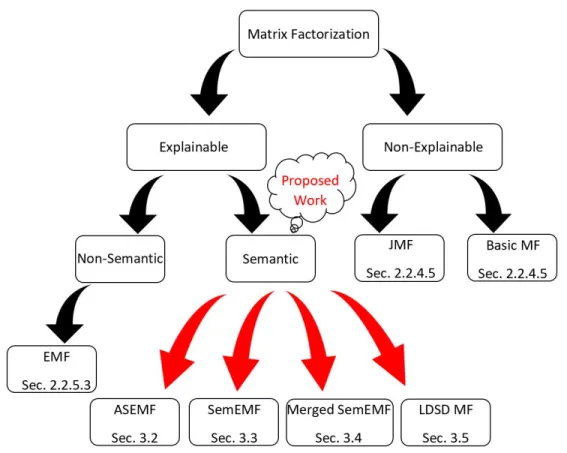
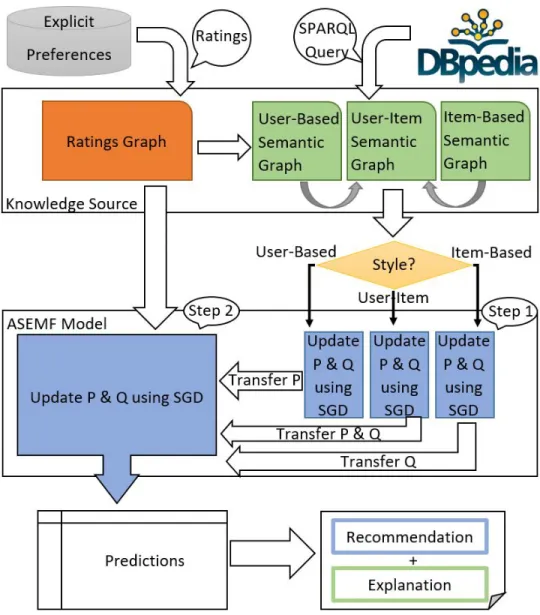
3.2 Asymmetric Semantic Explainable Matrix Factorization (ASEMF) . . . 43
3.2.1 ASEMF Semantic KGs . . . 43
3.2.2 Model Building . . . 46
3.2.3 Explanation Style . . . 49
3.3 Semantic Explainable Matrix Factorization (SemEMF) . . . 50
3.3.1 SemEMF Semantic KGs . . . 51
3.3.2 Model Building . . . 51
3.3.3 Explanation Style . . . 53
3.4 Merged Semantic Explainable Matrix Factorization (MergedSemEMF) . . . 53
3.4.1 MergedSemEMF Semantic KGs . . . 53
3.4.2 Model Building . . . 53
3.4.3 Explanation Style . . . 55
3.5 Linked Data Semantic Distance Matrix Factorization (LDSDMF) . . . 55
3.5.1 Linked Data Semantic Distance (LDSD) . . . 56
3.5.2 Model Building . . . 60
3.5.3 Explanation Style . . . 61
3.6 Inferred Fact Style Explanation (IFSE) . . . 61
4 EXPERIMENTAL EVALUATION 63 4.1 Experimental Setting . . . 63
4.3 Recommendation Evaluation . . . 67
4.4 Explainability Evaluation . . . 68
4.4.1 Semantic Explainability Metrics . . . 70
4.4.2 Neighborhood Explainability Metrics . . . 74
4.5 Analysis of Results . . . 76
4.6 Real User Study . . . 78
4.6.1 Hypothesis . . . 78
4.6.2 Methods . . . 78
4.6.3 Subject Recruitment . . . 79
4.6.4 Sample Size Estimation . . . 79
4.6.5 Procedures . . . 80
4.6.6 Analysis of Results . . . 84
4.6.7 Hypothesis Testing . . . 91
4.7 Summary of Experimental Evaluation . . . 95
5 CONCLUSION AND FUTURE WORK 96
REFERENCES 98
LIST OF TABLES
2.1 Explanation Styles. . . 23
2.2 A comparison of some recommender systems based on the (a) domain, (b) RS style, (c) availability of explanation, (d) system awareness of semantics, (e) user study, and (f) CSP solution to the cold start problem. . . 26
2.3 Explanation objectives. . . 38
4.1 The effect of applying the inferred fact mechanism on the semantic KGs’ sizes in the movie domain; the first and second rows show the sizes before and after the application, respectively. . . 65
4.2 The effect of applying the inferred fact mechanism to the semantic KGs’ sizes in the book domain; the first and second rows show the sizes before and after the application, respectively. . . 65
4.3 RMSE versus the number of latent factors K in the movie domain. SemEMF, MergedSemEMF, ASEMF_UIB, and LDSDMF denote our proposed methods. . . 66
4.4 RMSE versus the number of latent factorsKin the book domain. SemEMF, MergedSe-mEMF, ASEMF_UIB, and LDSDMF denote our proposed methods. . . 66
4.5 RMSE significance test results in the movie domain (K = 10). . . 67
4.6 RMSE significance test results in the book domain (K = 50). . . 67
4.7 MAP significance test results in the movie domain (K = 10). . . 68
4.8 MEP@10 significance test results in the movie domain (K =10 and θs=0.25) using semantic KGs to calculate explainability metrics. . . 70
4.9 MER@10 significance test results in the movie domain (K= 10 andθs=0.25) using semantic KGs to calculate explainability metrics. . . 70
4.10 xF-score@10 significance test results in the movie domain (K=10 andθs=0.25) using semantic KGs to calculate explainability metrics. . . 72 4.11 MEP@10 significance test results in the book domain (K=50 andθs= 0.25) using
semantic KGs to calculate explainability metrics. . . 72 4.12 MER@10 significance test results in the book domain (K=50 andθs=0.25) using
semantic KGs to calculate explainability metrics. . . 72 4.13 xF-score@10 significance test results in the book domain (K=50 andθs=0.25)
using semantic KGs to calculate explainability metrics. . . 72 4.14 MEP@10 significance test results in the movie domain (K =10 and θn =0.25)
using the neighborhood based explainability metrics. . . 74 4.15 MER@10 significance test results in the movie domain (K= 10 andθn=0.25)
using the neighborhood based explainability metrics. . . 74 4.16 xF-score@10 significance test results in the movie domain (K=10 andθn=0.25)
using the neighborhood based explainability metrics. . . 76 4.17 Likert scale survey questions. . . 81 4.18 Demographic questions. . . 81 4.19 Mean and standard deviation for all groups for regarding all three explanation aspects. 93 4.20 Categorization of the survey questions from Table 4.17 according to the research
questions. . . 93 4.21 Tukey multiple comparisons of means at 95% family-wise confidence interval for
satisfaction. . . 94 4.22 Tukey multiple comparisons of means at 95% family-wise confidence interval for
transparency. . . 94 4.23 Tukey multiple comparisons of means at 95% family-wise confidence interval for
LIST OF FIGURES
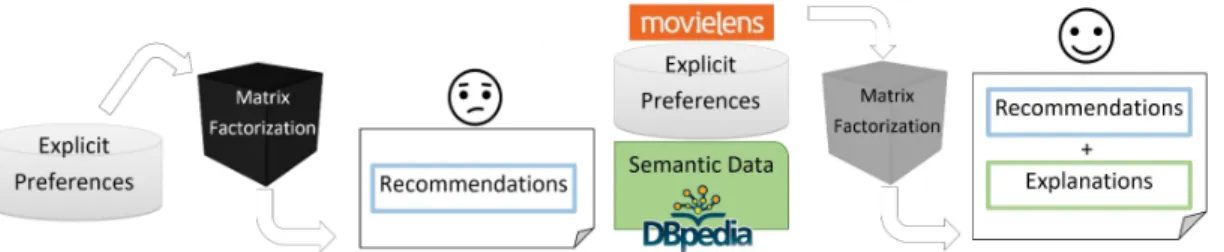
1.1 Black Box Matrix Factorization on the left and Explainable Semantic Matrix
Fac-torization on the right. . . 1
2.1 A simple RDF graph. . . 7
2.2 The high level architecture of a content-based recommender [1]. . . 11
2.3 Matrix Factorization Flow Chart. . . 20
2.4 An Example of dbrec’s Output, Source: [2]. . . 28
2.5 An Example of TasteWeight’s Output, Source: [3]. . . 28
2.6 An Example of Entity-based RS’ Output, Source: [4]. . . 28
2.7 An Example of SEP’s Output, Source: [5]. . . 29
2.8 An Example of RecExp’s Output, Source: [6]. . . 29
2.9 An Example of LOD-TRS’ Output, Source: [7]. . . 30
2.10 An Example of SemAuto’s Output, Source: [8]. . . 31
2.11 An Example of MovieExplain’s Output, Source: [9]. . . 32
2.12 An example of Tagsplanation’s Output, Source: [10]. . . 32
2.13 An Example of Hybrid-RS’ Output, Source: [11]. . . 33
2.14 An Example of Embedding-RS’ Output, Source: [12]. . . 33
2.15 EMF, Source: [13] [14] [15] neighborhood style explanation examples; the example on the left is user-based, and the example on the right is item-based. . . 37
2.16 Snapshot of the camera recommender system, Source: [16]. . . 40
3.1 Proposed methods and other approaches. . . 42
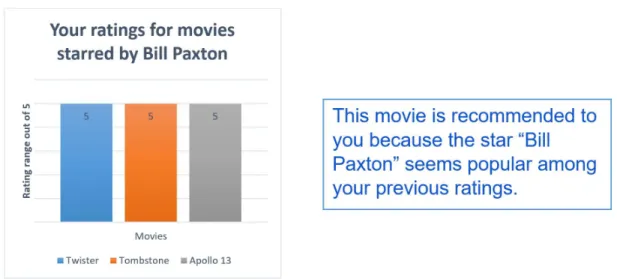
3.3 A histogram-like semantic ISE (left) and a plain text semantic ISE (right)
recom-mendation for sample user 1. . . 50
3.4 A histogram-like semantic ISE (left) and a plain text semantic ISE (right) recom-mendation for sample user 2. . . 50
3.5 Semantic Explainable Matrix Factorization. . . 51
3.6 Merged Semantic Explainable Matrix Factorization. . . 54
3.7 LDSDMF flowchart. . . 56
3.8 A Generic Semantic Knowledge Graph. . . 57
3.9 Inferred Facts: Movie Example. . . 62
4.1 The mapping process for the movie domain. . . 64
4.2 The mapping process for the book domain. . . 64
4.3 The graph shows the MAP@10 results of all methods while varyingKin the movie domain. . . 68
4.4 This graph shows the MAP@10 results of all methods while varyingKin the book domain. . . 69
4.5 The upper graph shows the results of MEP@10 for all methods, while the middle one shows MER@10 for all methods, and the lower graph illustrates the results of all methods using the xF-score metric. All explainability metrics utilize semantic KGs. All the results are in the movie domain. . . 71
4.6 The upper graph shows the results of MEP@10 for all methods, while the middle one shows MER@10 for all methods, and the lower graph illustrates the results of all methods using the xF-score metric. All explainability metrics utilize utilizes semantic KGs. All the results are in the book domain. . . 73
4.7 The upper graph shows the results of MEP@10 for all methods, while the middle one shows the MER@10 results for all methods, and the lower graph illustrates the results of all methods. All explainability metrics are based on the neighborhood explainability graph. All the results are in the movie domain. . . 75
4.8 The upper graph shows the results of MEP@10 for all methods, while the middle one shows MER@10 for all methods, and the lower graph illustrates the results of all methods using the xF-score metric. All explainability metrics use semantic KGs.
All the results are in the book domain. . . 77
4.9 A comparison of two explanations, high on the left and low on the right, that are exposed to the user during the experiment. The explanation on the left shows more semantic attributes than the one on the right. . . 79
4.10 A snapshot of the recommender system app showing a list of movies for the user to rate. . . 82
4.11 A snapshot of a recommendation and its semantic explanation presented to a user. The share of interest is the likeability degree computed using Equation 3.2 . . . 83
4.12 A Vertical bar chart of the answers to the questions in Table 4.17 for all participants. 85 4.13 A Vertical bar chart of the answers to the questions in Table 4.17 for participants in the group "High". . . 85
4.14 A Vertical bar chart of the answers to the questions in Table 4.17 for participants in the group "Medium". . . 86
4.15 A Vertical bar chart of the answers to the questions in Table 4.17 for participants in the group "Low". . . 86
4.16 A Heat-map plot of the answers to the questions in Table 4.17 for all participants. . 86
4.17 A Heat-map plot of the answers to the questions in Table 4.17 for participants in the group "High". . . 87
4.18 A Heat-map plot of the answers to the questions in Table 4.17 for participants in the group "Medium". . . 87
4.19 A Heat-map plot of the answers to the questions in Table 4.17 for participants in the group "Low". . . 87
4.20 Distribution of the participants’ satisfaction with the explanation. . . 88
4.21 Distribution of the participants’ gender. . . 89
4.22 Distribution of the participants’ age. . . 89
4.23 Distribution of the participants’ major of study. . . 89
4.25 Distribution of the participants’ favorite movies’ attributes. . . 90 4.26 Distribution of the participants’ familiarity with recommender systems. . . 90 4.27 Distribution of the participants’ most used online entertainment services. . . 90 4.28 Visualization of differences of mean levels of pairs of groups forsatisfaction. . . . 92 4.29 Visualization of differences of mean levels of pairs of groups fortransparency. . . 93 4.30 Visualization of differences of mean levels of pairs of groups foreffectiveness. . . 94
CHAPTER 1
INTRODUCTION AND MOTIVATION
1.1
Introduction
Collaborative filtering (CF) is a recommender system technique that uses the explicit prefer-ences of users, such as ratings, to recommend items [17]. In contrast, content-based filtering (CBF) techniques rely only on detailed information about an item’s content or description to make recom-mendations [18], which is a major advantage in complex domains. However, the most accurate CF methods, such as matrix factorization (MF) [19], lack transparency. Hence, despite its efficient in handling of large data sets and a high degree of accuracy in predicting unseen items’ ratings, MF fails to justify its output. This is because MF only utilizes users’ explicit preferences or ratings to build a prediction model. For this reason, MF is considered a black box recommender system (see the left side of Figure 1.1).
In addition to the lack of explainability, users’ explicit preferences or ratings of past items may not be sufficient for the model to be able to recommend new items for which there is no rating data. This problem is known as the cold start problem.
Figure 1.1: Black Box Matrix Factorization on the left and Explainable Semantic Matrix Factoriza-tion on the right.
There is, therefore, a need to overcome both the black box and cold start problems. One way to cope with these two problems involves leveraging the semantic web. More specifically, linked open data (LOD) [20] is a project where data is linked, structured, and connected on the web. In recent years, the web has been saturated with data and is a good source of rich information. The goal of LOD is to make this information machine processable and semantically linked. For example, in the movie domain, information about movie stars, such as related producers and writers, is available in a linked manner. When an actor has starred in two movies, these two movies are considered linked. This linkage of information can help infer relationships between movies.
1.2
Problem Statement
The research questions that we attempt to answer are as follows: Can we build a recommender system using matrix factorization (MF) that, in addition to being accurate, succeeds in explaining the recommendations using Semantic Web resources? Are the semantics of users and items effec-tive in building an explainable low dimensional (latent factor) space? Will the recommendations, after exploiting the semantics, be accurate? Do more semantic properties increase the explanation effectiveness?
1.3
Assumptions and Research Scope
The focus of this research is on the matrix factorization technique in addition to the semantic KGs that we rely on for justification purposes. We assume that the recommender system is a black box algorithm that relies on matrix factorization to build the model. We also assume that there is a sophisticated overlap between all knowledge sources. This means that all items (e.g., movies or books) in the dataset that contains users’ explicit preferences also exist in the semantic web knowledge source (e.g., DBpedia).
The scope of our research is limited to the collaborative filtering technique for recommendations and to semantic web technologies for explanation generation. Users’ preferences are their ratings of movies, whereas the semantic web technology that we incorporate is the simple protocol and resource description framework query language (SPARQL) [21]. We query DBpedia to extract semantic knowledge graphs that link items, such as movies or books to semantic properties, and
then use this information to generate an explanation while simultaneously building the model. This semantic data is expected to cause some items to be projected closer to some users based on how many properties the items and users share based on semantics.
1.4
Research Contribution
Our work contributes to the recommender system and semantic web fields by:
1. Designing semantic Knowledge Graphs (KGs) that can be used to interpret and justify big data black box predictors, such as matrix factorization, while preserving prediction accuracy as illustrated in the right side of Figure 1.1.
2. Proposing a two-step model that uses the designed semantic KGs to learn semantically-aware latent spaces of users and items Asymmetric Semantic Explainable Matrix Factorization (ASEMF).
3. Proposing a one-step model that incorporates the semantic KGs in learning the low dimen-sional latent spaces Semantic Explainable Matrix Factorization (SemEMF).
4. Proposing a model that combines multiple explanation styles, semantics (SemEMF) and neighborhood style Explainable Matrix Factorization (EMF), in learning explanation-aware latent spaces Merged Semantic Explainable Matrix Factorization (MergedSemEMF).
5. Proposing a model that takes advantage of two algorithms Linked Data Semantic Distance (LDSD) and Joint Matrix Factorization (JMF) for building a semantically more comprehen-sive model Linked Data Semantic Distance Matrix Factorization (LDSDMF).
6. Proposing a model that augments the semantic explanations based on inferred facts about users and semantic attributes, (IFSE) Inferred Fact Style Explanation.
7. Presenting offline evaluation for the proposed models.
8. Performing a user study to evaluate our proposed model (LDSDMF) and proposed explana-tion style Inferred Fact Style Explanaexplana-tion (IFSE) for online evaluaexplana-tion.
1.5
Document Organization
In the following chapters, we first review previous work that has used the semantic web in the recommendation process in Chapter 2, focusing specifically on user profile building and matrix factorization. Then, we describe our proposed methods in Chapter 3, and present their experimental evaluation in Chapter 4. Finally we present our final conclusions and future work in Chapter 5.
CHAPTER 2
BACKGROUND AND LITERATURE REVIEW
2.1
Semantic Web
The goal behind the semantic web is to allow systems to intelligently search, combine, process, and interact [22]. It is important to mention that the contents of these systems must be systemati-cally processable by machines [22]. Specifisystemati-cally, content, like media, is processed, combined, and aggregated by humans with no help from systems. The goal of the semantic web is to make systems do these jobs by themselves by converting the information on the web into data that is machine readable and understandable using a specific schema and format [23]. The semantic web enables us to utilize not only keywords when searching on the web but also the underlying semantics, such as synonyms and homonyms, to enrich the user’s experience [23]. These technologies are designed to make more data available for systems to process without human intervention. “Anyone can say anything about anything” [23] on the web, which implicitly means that there is a vast amount of data on the web. Therefore, an intelligent way to organize this data is required to help humans manage data more rapidly, accurately, and efficiently. Notably, the semantic web could be referred to as ’linked data’ [20], which means structured and connected data on the web.
In the following sections, the resource description framework (RDF) and SPARQL concepts, which are two technologies of the semantic web, are explored in greater detail.
2.1.1 The Early use of the Semantic Web in User Profile Building
In this section, we shed light on some previous studies that have sought to mine user profiles and compare them with our focus in this research. The interaction between the semantic web and
web mining was discussed previously by [24] and [25]. They stated that discovering the meaning of web content could be easier with the help of the semantic web. Moreover, usage mining is a considerable source of knowledge and could be used to present more meaningful information on the web. A survey was conducted by [26], who described the development of the semantic web and web mining. They also aimed to clarify web space evaluation, where multiple factors, including semantic web mining, software agents, and human agents interact. They concluded the survey by predicting that semantics will be more attractive in the research area of web mining because of its ability to make information on the web machine processable and understandable. The combination of the semantic web and web mining is also studied by [27], who found semantic web mining can successfully enhance the output of web mining after taking advantage of semantic web technologies. Building user profiles is a fundamental task in the recommender systems field. For this reason and because the semantic web is a platform of linked data, considerable effort has gone into using the semantic web in this area.
Usage data is one of the most important sources for understanding user interests and desires, which will help in building user profiles [28], [29]. Furthermore, [30] emphasized that it is crucial to utilize both website usage data and the ontological content of items to build richer user profiles. In their work, they built user profiles by integrating semantics obtained from ontologies, website structures, and user activity. However, in this study, the focus was on users’ ratings of items and the underlying semantics to increase the accuracy of recommendations and generate explanations.
[31] used webpage textual content data and WordNet ontology [32] to build a semantically-enhanced user model that can help achieve personalization and understand user needs in information retrieval.
In another study, [33] exploited the power of the semantic web for personalized information retrieval within the e-learning domain [34], where they leveraged learning content, such as lectures, and semantic user profiles.
Finally, [35] attempted to create a more robust user profile by preprocessing user usage data as performed earlier in [36], [37], and [38]. This process includes robust knowledge discovery algo-rithms that result in noise and outlier resistance. The study concluded that although a preprocessing stage may reduce the quality of user profiles, it allows the data mining process to be performed more rapidly.
Figure 2.1: A simple RDF graph.
2.1.2 RDF
The web currently relies on languages, such as HTML, which allow anyone to publish a doc-ument and make it available online. However, since the number of docdoc-uments and amount of data published on the web have increased rapidly, the need for an intelligent mechanism to handle them arose, and hence, RDF was developed [23]. This language outputs structured information in a for-mal manner [22]. The original objective of this language was to allow applications, such as travel agents’ websites, to exchange data while maintaining their rules [22]. Since HTML is limited, ex-tensible markup language (XML) was developed to organize semantics on the web. This means that XML is the foundation language for RDF. Although RDF has a specific syntax and structure, it is the basic language for semantic web development [22]. A simple RDF graph is visualized in Figure 2.1.
2.1.2.1 RDF Data Model
RDF components are [23]: 1. Resources:
Resources, in this context, means objects or things, such as players, machines, notebooks, or mountains, and they each have a unique uniform resource identifier (URI) for identification purpose on the web when pointing to them.
2. Properties:
Properties represent the relationship between resources. For example, in Figure 2.1, Mo-hammed is the father of Jood. ’Father of,’ in this case, is the property that illustrates the relationship between Mohammed and Jood.
3. Statements:
Statements are a combination of resources, properties, and values. 4. Graph:
Figure 2.1 shows how a statement is represented in a graph.
In conclusion, RDF basically enables data to be formatted in a machine-understandable format. Briefly, RDF works by dividing the concepts contained in web documents into a relationship that includes a subject, predicate, and object, for example, ’Fahad isWorkingAt T-mobile.’ This rela-tionship yields additional information regarding Fahad. Since he works at T-mobile, other people who work at the same company could benefit from Fahad’s other relationships when conducting an online search. Specifically, the search engine will consider the content of Fahad’s profile and then make suggestions to his colleagues.
2.1.3 SPARQL
SPARQL is a query language inspired by structured query language (SQL), and it is used to query information organized using RDF syntax. There are many similarities between these two languages [23]. However, the structure of data that SQL and SPARQL query is completely different [22].
RDF is stored in a database called a triple store so that SPARQL can perform its queries on RDF files. An example of a triple store that provides the service of a SPARQL endpoint is DBpedia1 [23].
As mentioned previously, triple RDF consists of a subject, predicate, and object. These three components are substantial when querying RDF files [23]. SPARQL is similar to SQL in terms of syntax. For example, SELECT has the same functionality in both technologies. Moreover, a WHERE clause in SPARQL acts like pattern matching for the triple. For instance, consider the following triple: ’?person dbo:birthPlace :London.’ If this is in the WHERE clause, it will return all persons whose birthplace is London. It is important to define the abbreviations such as rdf, foaf, dbpedia, and others at the beginning of the query [23].
2.2
Recommender Systems
2.2.1 Introduction
Recommender Systems aim to help individual users select the next item based on their previous preferences and choices [39]. For example, the amazon.com e-commerce website personalizes items for each customer, and if we consider books as an example, each customer will see different book suggestions [40]. It is worth mentioning that if two or more users share similar interests, they may see similar item suggestions. In addition, there are non-personalized recommendations, where the recommendation is based on other criteria, such as popularity (e.g., the top five movies based on the number of views). In terms of implementation, these are easier than personalized suggestions [41], and are used in magazines and newspapers since they may not have enough information about the user to make a personalized recommendation. They thus use other factors, such as the number of views or clicks, to rank the recommendations. These type of recommendations are distinct from modern intelligent RSs that are personalized and data-driven, which we consider in this research work [41].
RSs use the ratings of products, which users explicitly express through feedback, to make rec-ommendations. The system may also consider visiting some pages as a sign of interest and, based on this information, RSs take action [41].
Recently, RSs have become important for the following reasons [41]:
• Websites like Amazon, YouTube, Netflix, and others need RSs so they can improve their ability to help a very large number of users navigate and discover relevant objects among many options.
• Conferences and workshops have been dedicated to RSs research. • University courses have been dedicated to RSs.
• Famous scientific journals have covered the development of RSs.
In addition, there are several benefits that service providers look for when exploiting RSs [41]: • Increase sales.
• Sell more diverse items. • Increase users satisfaction. • Strengthen fidelity.
• Understand user’s needs.
2.2.2 Recommendation Techniques
Predicting the utility of items that RSs should recommend to the user is important; some items are not worth recommending to users [42], [43]. To model the degree of utility of itemifor user
uas a functionR(u,i), we consider user ratings. Then, collaborative filtering predicts the utility of items for each user [42], [43].
It is important to note that the utility of items for some users can be influenced by their knowl-edge level (i.e., expert versus beginner) in a specific field [43], which will have an impact on rec-ommendations.
There are six different classes of recommendation approaches [44]:
• Content-based: The system learns to recommend items that are similar to the ones that the user liked in the past.
• Collaborative filtering: Recommends items to the user that other users with similar pref-erences have liked in the past. The degree of similarity between two users’ prefpref-erences is calculated based on the degree of similarity in their rating history. It is the most popular RS technique.
• Demographic: Recommends items based on the user’s demographic profile.
• Knowledge-based: Recommends items based on specific domain knowledge; how certain item features meet the user’s needs and preferences. Specifically, how the item is preferable for the user.
Figure 2.2: The high level architecture of a content-based recommender [1].
• Hybrid recommender systems: These RSs are based on a combination of the above tech-niques.
2.2.3 Semantic-Aware Content-based Recommender Systems
Content-based recommender systems (CBRS) consider all documents and item descriptions that a user has previously shown an interest in via ratings and then builds a user profile that matches the user’s interest in such items. Once the user explicitly shows interest in an item, the algorithm ana-lyzes the item’s features and then recommends similar items to the user [45], [46], [1]. For example, when a user purchases a pillow from amazon.com, the recommender system will suggest a pillow cover as it is a closely related item. Unfortunately, this keyword-based technique faces problems, such as polysemy, synonymy, multi-word expressions, and others. Semantic technologies are a way to overcome these obstacles [1]. Knowledge sources, such as DBpedia and Freebase, assist in the switch from keyword-based techniques to concept-based techniques used to build items and pro-files. There are two approaches to the use of semantic technologies in content-based recommender systems: top-down and bottom-up [1]. We will elaborate on them in this chapter. Figure 2.2 shows the high-level architecture of a content-based recommender system.
In the following sections, we discuss how data are represented in content-based RS and which algorithms are used. Then, we describe some strengths and weaknesses of these methods.
2.2.3.1 Content-based Recommender Systems
Item Representation and algorithms Since many early content-based RSs dealt with textual content [46], [45], retrieval models come into play. A vector space model (VSM) is commonly used to match documents based on keywords. It uses the term frequency-inverse document frequency (TF-IDF) technique. LetD={d1,d2, ...dN}represent a set of documents andT ={t1,t2, ...tn} de-note the dictionary.T is obtained through processing operations, such as tokenization and stemming [47]. Each document is represented asd={w1j,w1j, ...,wn j}wherewk jis the weight for termtkin documentdj. The definition of TF-IDF [48] is as follows:
T F−IDF(tk,dj) =T F(tk,dj)·log
N nk
(2.1)
The first part represents the term frequency and the log term denotes the inverse document frequency.Nis the number of documents, andnkrepresents the number of documents in whichtkis found at least once. A normalization formula is needed, thus cosine normalization is typically used [48]. This results in the following weightwk,jfor a termkin document j:
wk,j= T F_IDF(tk,dj) q ∑|sT=|1T FIDF(ts,dj) 2 (2.2)
To compute the similarity between documents, the cosine similarity measure is commonly used, which is given by sim(di,dj) = ∑kwki.wk j q ∑kw2ki. q ∑kw2k j (2.3)
After documents are processed, algorithms are needed to perform the task of learning the profile of the user. The following list is a summary of some of these algorithms and how they work:
1. Naive Bayes (NB): NB classifies data based on the posterior probability of belonging to a class, given by
P(c|d) = P(c)P(d|c)
P(c|d)denotes the probability of documentdbelonging to classc, whileP(c)means the prob-ability of observing a document in classc,P(d)is the probability of observing the instanced, andP(d|c)represents the probability of observing the documentdgivenc. In Content-Based Filtering the classccan correspond to relevance or non-relevance to a particular user. 2. Rocchio’s Algorithm:
The Rocchio’s algorithm is used to refine and thus personalize the user’s queryqby consid-ering the relevance of feedback obtained from the user [49]:
qki=β.
∑
(dj∈POSi) wk j |POSi| −γ.∑
(dj∈NEGi) wk j |NEGi| (2.5)wk jrepresents the weight of termtkin documentdjusing TF-IDF.POSiandNEGidenote the set of positives and negatives instances for classciin the training set.β andγare controlling parameters to set the importance of positive and negative instances.
3. Nearest Neighbor:
The nearest neighbor technique stores the training data and then classifies new items based on nearest neighbors from the stored training data using a similarity function, such as the cosine similarity [50]. Like the Naive Bayes classifier above, classes of interest here are the relevance and the non-relevance to a user.
Advantages and Disadvantages of Content-based RS The advantages of content-based RSs (CBRSs) include user independence, transparency, and handling new items. The disadvantages include limited content analysis, over-specialization, and new-user cold -start problems [1].
2.2.3.2 Top-Down Approach
In this approach, the idea is to utilize knowledge resources together to form the user profile and then find the information that the user needs [1].
There are three aspects that CBRSs incorporate to increase the accuracy of recommendations: • Ontological knowledge use [51].
• Unstructured or semi-structured encyclopedic knowledge source utilization [52]. • Linked open data cloud incorporation [53].
These aspects are discussed in the following paragraph. 1. Ontological Resources:
WordNet [54] introduced linguistic knowledge to the public and the research field. The in-terpretation of the semantic meaning of the content of WordNet was obtained by algorithms of word sense disambiguation (WSD) [55],[56, 57]. Both technologies are utilized to build a user profile [1]. Nonetheless, WordNet is still limited in terms of entities’ names, events, and specific knowledge [1]. Thus, the need for better technology arises. One such technology is the semantic web [58]. One of the powerful technologies of the semantic web is ontology, and its role is to handle the domain knowledge in a specific syntax. In RSs-ontology integration, user and item profiles are built using concepts from ontology [1]. Examples of this type of recommendation are explored in a later section.
Although the use of ontologies in the recommendation process results in more relevant recom-mendations and less ambiguous user profiles [1], ontology needs experts in the design, which consequently means time consumption, in addition to required maintenance efforts [59]. 2. Unstructured or semi-structured:
Since the early years of artificial intelligence, the major role of knowledge resources was rec-ognized [60]. For this reason, many knowledge resources, either structured or unstructured, became available on the web, such as the Wikipedia encyclopedia and Yahoo! web directory. These types of knowledge resources have been exploited in the field of CBRSs by finding more related concepts and features [1]. It is not surprising that Wikipedia is the most widely used knowledge resource for several reasons and features: it is free, it covers a wide range of topics, it is multilingual [1] and highly accurate [61]. Wikify [62] and Tagme [63] are two projects that exploit Wikipedia to perform the feature selection task.
Explicit semantic analysis (ESA) is a technique used to improve an item’s representation by utilizing Wikipedia to create new features [64]. ESA works by giving weighted vectors to the concepts contained in documents retrieved from the encyclopedia. The difference between
this technique and LSA [65] is that LSA deals with latent features, whereas ESA deals with explicit features derived from Wikipedia [1].
Lastly, BabelNet is an encyclopedic dictionary that integrates Wikipedia and WordNet to generate a huge multilingual semantic network [66].
3. Linked Open Data
Linked open data became popular in recent years due to the collaborative efforts of the seman-tic web community [67]. The structure of this enormous amount of data follows the standard of an RDF, as well as the query language SPARQL2, which is used to extract information from RDF files [22]. [68], who developed the dbrec system, were some of the first researchers to use semantic web technologies in the field of recommender systems. Their recommender system takes advantage of an the linked data semantic distance (LDSD) algorithm [69], as well as DBpedia, the ontological version of Wikipedia, to retrieve more details about artists. Another study [70] exploited user and item connections performed by [71] by converting the resulting RDF graph into a matrix of users-items using recommendation techniques. Di Noia et al. [53] utilized multiple semantically structured data from DBpedia [67], Freebase [72], and LinkedMDB [73] to produce movie recommendations by generating a matrix of subjects-predicates-objects, with the row being the subject and the column representing the object, whereas the cell is filled with the property, weighted using a genetic algorithm, if one exists. The TF-IDF technique is used to give weights for all matrix elements. The similarity measurement used to determine whether any two movies are related is cosine. Afterward, the similarity between the user profile and new movies is calculated and, hence, a movie is recommended.
Following are some projects inspired by the entity linking technique to represent data: (a) Babelfy3:[74] an integration of word sense disambiguation and entity linking.
(b) DBpedia Spotlight: this project uses DBpedia to link unstructured text to an LOD cloud [75].
2https://www.w3.org/TR/rdf-sparql-query/ 3http://babelfy.org
(c) Alchemy4: provides the ability to utilize NLP for the sake of analyzing different types of documents to reach entity recognition.
(d) Open Calais5: Analyzes documents using both the ML and NLP technique to locate entities.
(e) NERD: An ontology used to merge the above-listed types of entity-linking projects [76].
2.2.3.3 Bottom-Up Approach:
This approach relies on the distributional hypothesis, where words and documents are dis-tributed in the space as vectors, and every two words that are close in meaning in the context are also close in the corresponding vector space [1]. Discriminative models (DMs) inspired the notion that any word can be understood by humans by looking at the context where that particular word occurs [1] (e.g., leash, dog, animal [77]. Similarly, words that occur in similar contexts are more likely to also be closer in meaning (e.g., leash, muzzle) this approach is called the distributional hypothesis [78]. The word-context matrix technique is used in DMs instead of the word-document matrix technique presented by VSM [1]. Moreover, [79] explained how vector space models (VSM) can be used to illustrate semantics in the following:
• A term-document matrix. • A word-context matrix. • A pair-pattern matrix.
Since DMs utilize similarity measurements, such as cosine, euclidean, and relative entropy-based measurements, these models are known as geometrical models [80]. [81] introduced WordSpace, where similarity depends on an unsupervised method that leads to an expansion in the number of dimensions of the vector space. Hence, a dimensionality reduction technique is needed.
1. Dimensionality reduction techniques:
The idea behind this technique is to reduce the number of dimensions in the vector space [1]. [65] stated that a dimensionality reduction technique is applied to latent semantic indexing
4http://www.alchemyapi.com/ 5http://www.opencalais.com/
(LSI), which is a method of creating a semantic vector space by using the singular value decomposition (SVD) technique. First, a matrix is formed in which the rows represent words and columns represent documents. Then, it is decomposed into two matrices to reduce the number of dimensions. The LSI technique outperforms other techniques, and this is proven in [82, 83]. Moreover, [84] used a dimensionality reduction technique to refine the user profile in CBRSs by reducing the number of features of the user’s profile, which produced better recommendations. Nevertheless, this technique could be outperformed by other techniques when working with a small dataset or short texts [85].
2. Modeling Negation:
The VSM technique suffers from the problem of not considering negative feedback when building a user profile [1]. However, works such as [86, 87] overcame the issue of negative relevance feedback by subtracting irrelevant vectors to refine the user profile.
3. Conclusion and Comparison of approaches:
The two methods aim to solve problems that occur in CBRSs, such as limited content analysis and over-capitalization. The top-down approach tends to use external knowledge sources such as ontology, encyclopedias, and LOD clouds to better understand the user’s interests to make more accurate recommendations. In contrast, the bottom-up technique starts by analyzing individual terms in a broad context to extract the underlying semantics [1].
Transparency is one factor that differentiates the two approaches. In the top-down technique, user profiles and items are explicitly represented, which decreases ambiguity, resulting in a better estimation of the semantic similarities between an item and a user profile. This will help in making good explanations. However, the bottom-up approach lacks transparency since it analyzes the meaning of a word by looking at its co-occurrences throughout a set of documents [1].
Another difference between the two approaches is that the bottom-up method is superior because it utilizes a dimensionality reduction technique [1]. Lastly, the two methodologies’ pros and cons are presented in Table 4.1 [1].
2.2.4 Collaborative Filtering (CF) 2.2.4.1 Introduction
Collaborative filtering focuses more on rating data than the content descriptions of items [17]. In contrast with content-based techniques, there is no need for detailed information about both users and items, which is a major advantage of this method. Consequently, computation complexity will be much lower.
The Netflix competition conducted in 2006 led to major developments in the field of recom-mender systems, especially collaborative filtering [88], because huge datasets became available to the research community (around 100 million movie rating).
Recommender systems rely on two types of feedback. One is explicit feedback, where users clearly declare their opinion on an item, such as rating a movie [88]. The other type is implicit feedback; although it is less accurate, it is still important. Examples of implicit feedback are the user’s search history, purchase history, and mouse movement [89].
Collaborative filtering depends on two approaches when making recommendations: latent factor models, such as SVD, and neighborhood methods [88].
2.2.4.2 Neighborhood-based Recommendation Methods
In recent years, the online shopping rate has increased rapidly, creating retailer websites, such as amazon.com, with a wide variety of items. In recommendations, the ratings of other users are considered in the process of building the RS model, in contrast to content-based models, which rely on an item’s specifications [17]. Some advantages of neighborhood-based recommendations include: [90]:
• Simplicity. • Justifiability. • Efficiency. • Stability.
2.2.4.3 User-based Rating Prediction
When a user rates an item, the most similar users’ interests are considered when recommending the next item. This technique is called the nearest neighbor [50] [91]:
ˆ rui= 1 |Ni(u)|V∈
∑
N i(u) rvi (2.6)Ni(u)is the k-nearest neighbors of useruwho rated itemi, whilewuvis the similarity between
uandkusersv.ruiis the rating of itemiby useru. Normalization results in
ˆ
rui=
∑V∈Ni(u)wuvrvi
∑V∈Ni(u)|wuv|
(2.7) Note that the denominator, an absolute value, is used to ensure a positive number.
2.2.4.4 Item-based Recommendation
In this approach, items that are similar to the item the user has liked are considered in the process of [92]. The formula is expressed as follows:
ˆ
rui=
∑j∈Nu(i)wi jru j
∑j∈Nu(i)|wi j |
(2.8)
jandiare items, andNu(i)denotes the items that are rated by useruand similar to itemi. wi j is the similarity between itemiandkitems j.
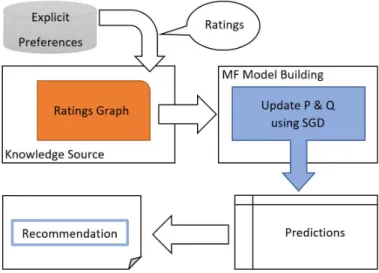
2.2.4.5 Matrix Factorization Models
Matrix factorization (MF) is a powerful family of techniques used to build recommender sys-tems [19]. MF aims to learn latent space vectorspandqfor each user and item, respectively. Figure 2.3 shows a flowchart of the MF method in making recommendations.
The idea is to factorize the rating matrix into lower dimensional spaces using a given number of latent features such that the dot product of the two latent space representations should approximate the original ratings, in addition to predicting the ratings of unseen items, as shown in Equation 2.9
ˆ
Figure 2.3: Matrix Factorization Flow Chart.
ˆ
rdenotes the training set of known ratings, whereiand jrepresent a user and an item, respectively. Latent space vectors pandqare found by minimizing the following objective function over known ratings [19]: J=
∑
i,j∈R ri j−piqTj 2 +β(kpik2+kqjk2) (2.10)A regularization term exists for each unknown parameter (latent vector) to avoid over-fitting, with β being a regularization coefficient that controls the smoothness of the newly added term. J is not convex with respect to all the unknown parameters, but it is convex with respect to either p orq
alone. Therefore, stochastic gradient descent [93] is used to solve for the optimal parameters. The update rules for the user and item latent factor parameters pandqare given by
p(ut+1)←p( t) u +α(2(Ru,i−p( t) u (q( t) i ) T )q(it)−βp(ut)) (2.11) qi(t+1)←qi(t)+α(2(Ru,i−p( t) u (q( t) i ) T) p(ut)−βq( t) i ) (2.12)
Next, we will explore two matrix factorization approaches presented by [94, 95], who improved the basic matrix factorization technique, which we described above, and came up with new ap-proaches, JMF and SemJMF. Then, we will explain three other types of matrix factorization models used in the field: the SVD, SVD++, and time-aware factor models.
[94] extended [19]’s work by incorporating not only known ratings but also information that comes in two forms, from the user’s side and the item’s side. Side information, such as age and gender, come from the user side, although they are not always available due to privacy issues. Genre, size, color, and movie stars are item-side information, and they are almost always available. [94] took advantage of this additional information to enhance the accuracy of recommendations. They extended the basic matrix factorization cost function to create a joint MF (JMF) that includes additional terms for item-side information. Since they conducted their experiments in the movie domain, they used two types of movie information, mood and plot keyword. Two movie-by-movie similarity matrices were constructed using two similarity methods to be added as new terms to the cost function. They compared their work to several non-context aware approaches and showed that their approach outperformed other approaches by 10
2. Semantic Joint Matrix Factorization :
[95] extended [94]’s idea of using item-side information to exploit the power of the semantic web. Working in two domains, music and movies, they extracted semantic information from the DBpedia6 dataset, which is a semantic version of Wikipedia. They retrieved artist cat-egory information from DBpedia using SPARQL to enrich the item-side information. Like [94], they constructed a new matrix for the semantic information, added a new term to the JMF cost function, and obtained better results in comparison to JMF and other techniques. 3. Asymmetric Matrix Factorization :
Building low dimensional representations of users and items using multiple sources of knowl-edge was explored by [96]. In their work, they succeeded in building a model to annotate images using the so-called bag-of-features that belong to images and non-negative matrix factorization (NMF) to build a low dimensional latent vector representation. Later, this ap-proach was used in [97] to propose a solution for the item cold-start problem in collaborative filtering using matrix factorization and utilize multiple domains in the process of building the model. More specifically, item content features, such as genre, are used to build the items’ latent space before learning the user’s latent space using another domain, namely the known
ratings. Although this approach integrated two sources of data to overcome the cold-start problem, it did not provide explainable recommendations.
4. SVD:
SVD works by mapping items and users to a joint latent factor space within dimensionality
f, making this interaction between users and items modeled as inner products [88]. The rule that is used to predict the rating is expressed as follows:
ˆ
rui=u+bi+bu+qTi pu (2.13)
where ˆruiis the estimated rating for itemiby useru. bi,bu, pu, andqiare the model param-eters. The regularized squared error is minimized to learn the model parameters determined by cross-validation: min b∗,q∗,p∗
∑
(u,i)∈K rui−u−bi−bu−qTi pu 2 +λ(b2i +b2u+kqik2+k puk2)λ (2.14)λ is a parameter that controls the regularization term. The optimization technique used is stochastic gradient descent [93].
2.2.5 Explanations
2.2.5.1 Introduction
Recommendations, by themselves, aim to guide the user’s next move (e.g., which movie to watch next or what item to purchase). [98] has stated that the recommendation process happens inside a black box, meaning that users are not aware of why certain items are recommended to them. Thus, adding more clarifying details is desirable. When a website, such as Netflix.com, recommends a movie to a user and attaches a sentence such as "People who watched this movie also watched . . . )," the user will be encouraged to watch the recommended movie [99]. It is proven that explanations play a major role in gaining user trust and enhancing scrutability, which verifies the recommendation’s validity [13].
In the 1990s, explanations were used by so-called expert systems. However, there were no satisfying evaluation techniques for these explanations [100].
2.2.5.2 Explanation Styles and Related Approaches
[101] and [99] proposed several explanation styles. Table 2.1 summarizes them. Table 2.1: Explanation Styles.
[101]’s Styles [99]’s Styles
Neighbor Style Explanation Collaborative-based Style Explanation Influence Style Explanation Content-based Style Explanation Keyword Style Explanation Case-based Reasoning Style Explanation
Knowledge and Utility-based Style Explanation Demographic Style Explanation
Following is a review of some existing systems that use different types of explanation styles in addition to an elaboration of the related studies mentioned in Table 2.2. Herlocher et al. [98] stated that explanations enhance the performance of collaborative filtering recommender systems. In their work, they explored 21 explanation interfaces where they eliminated the recommended items and only retained the explanations for users to choose from and found that, from a promotion point of view, the best interface was the histogram-like explanation interface according to the users’ feedback. Other interfaces include past performance, a table of neighbors’ ratings, similarity to other movies rated, and other information.
Pineda and Brusilovsky [102] discuss the transparency issue in the educational domain. The concentration is not on the interest of the user, such as in the movie or e-commerce domain, but it is in the level of education, which makes it more challenging. Therefore, the recommendation and explanation process requires more effort to estimate the skill level of the students. The focus of this paper [103] is on the transparency of the hybrid recommender systems. They attempt to overcome this issue by generating visualized and personalized explanations for the outputs. The music domain was used to test the approach by conducting a user study. Sato et al. [104] claim that current explanation styles take advantage of similarities between users, items, items’ contents, and demographics. However, context like accompanying persons and usage scenarios are used to generate a different explanation style.
expla-nations into three types: 1) item-based, where explaexpla-nations were created based on similar items, 2) user-based, where the system relied on similar users to explain its recommendations, and 3) feature-based, where various features, such as genre, were used to justify the output. The authors of this work used the KSE explanation style. An example of an explanation could look like "This movie is being recommended to you because it is tagged withmystery, which exists in movies you’ve liked previously". In a similar study that also used KSE as the explanation style [105], a CBF model was designed for recommending digital cameras. They used specific characteristics of cameras, such as memory size and resolution, and allowed each user to choose which set of features met his or her requirements. [106] built a CF recommender system that relies on the latent factor model technique to produce accurate recommendations, along with explanations that are generated using a sentiment analysis of users reviews.
[101] defined the three explanation types mentioned in Table 2.1. In their work, they produced a book recommender system, called LIBRA, which was an extension of [107]’s work that used a CBF technique. A hybrid model was created using user ratings and item content data. Explanation effec-tiveness was measured by promotion and satisfaction. Promotion refers to an explanation’s ability to convince users to choose the recommended items, while satisfaction means that an explanation allows users to check an item’s quality. In their study, they used all three explanation styles listed in the left-hand column of Table 2.1.
[108] evaluated the effectiveness of explanations in terms of how well they helped users make better decisions. They concluded that personalizing feature-based explanations is unfavorable from an effectiveness perspective, although it may increase satisfaction. In contrast to [98], [101] argued that KSE and ISE are better than NSE because the latter suffers from a bias toward top recommended items, which causes an overestimation of the recommended items. This issue does not exist in KSE and ISE.
In [109], the authors designed a recommender system that recommends places for tourists to visit. They grouped users demographically based on their age (e.g., children, adults, and the elderly) and suggested places to each group with justifications that suit their interests. [110] proposed a new recommender system that reads news articles to users using synthesized speech. The system receives voice feedback from users to improve its performance and generate explanations using the KSE explanation style. Symeonidis et al. [111] proposed a system that leverages explanations
aimed toward increasing transparency without sacrificing accuracy. They were motivated by the limitations of some e-commerce recommender systems that depend on ratings and user behavior to explain recommendations but ignore item features. To overcome this limitation, they constructed a feature-based user profile where each user’s interests are represented by item content features. They also created biclusters, which are groups of users who exhibit similar ratings of groups of similarly rated items and used the clusters to find possible patterns of interests and preferences between test users and the group of users. A user study was conducted to show that their approach resulted in higher satisfaction compared to other approaches after showing the justification.
The approaches listed in Table 2.2 are reviewed in this section. First, eight studies are both explainable and semantic-aware, whereas the next seven research items are only explainable with no semantic-awareness (i.e., do not use semantic web technologies, such as RDF, OWL, or SPARQL). The next eight studies in Table 2.2 use semantics but omit explanations. Lastly, the four remaining works in this table are neither non-explainable nor semantic-aware.
The first work was conducted by [2], who used a linked data semantic distance (LDSD) algo-rithm [69] to build a model that recommends movies. More details about this method were presented in the previous subsection 3. [68] used property values to explain why a certain artist was recom-mended. Following is an example of their explanation: Johnny Cash and Elvis Presley share the same value for ’death place’: Tennessee.. Also, Figure 2.4 shows a snapshot of an example.
The approach utilized by [112] exploited linked open data (LOD) to build a movie recommender system, and Section 3 presents additional details of this system. Similar to [2], the values of proper-ties of recommended items are used for explanations. Di Noia et al. emphasized that CBF systems provide more transparency than CF systems. However, in the current study, we are proposing a Hybrid CF system using MF that is accurate and transparent enough for users to accept recom-mendations by generating explanations through semantic web technologies. TasteWeights [3] is an interactive hybrid recommender system designed for the music domain 7. Several sources of information, such as Twitter, Facebook, and Wikipedia, are utilized as a data source for the recom-mendation process. In addition to generating a visual interactive interface that provides justifications to users, the explanation interface allows users to choose the source of the explanation. If the user chooses to see an explanation based on Facebook data, then users will see their friends who liked
Approaches Y ear Domain CF CBF HYB WB BB Explanation Semantic-a w are User Study CSP dbrec [2 ] 2009 Music x X x X x X X x x LOD-RS [112 ] 2012 Mo vies x X x X x X X x x T asteW eight [3 ] 2012 Music x x X X x X X X x Entity-based-RS [4 ] 2017 Mo vies x X x X x X X x x SEP [5 ] 2018 Mo vies x x X X x X X x x RecExp [6 ] 2016 Mo vies, Social x x X X x X X x x SemRec [113 ] 2018 Mo vies,Y elp,Books x x X X x X X x X LOD-TRS [7 ] 2019 Mo vies,Books,Music x X x X x X X X x SemAuto [8 ] 2018 Mo vies X x x x X X X X X EMF [13 ] [14 ] [15 ] 2017 Mo vies X x x x X X x X X Mo viExplain [9 ] 2009 Mo vies x x X X x X x X x T agsplanations [10 ] 2009 Mo vies X x x X x X x X x Hybrid-RS[ 11 ] 2013 Mo vies x x X X x X x X X TEM [114 ] 2018 T ourism x x X x X X x x x Embedding-RS [12 ] 2018 Amazon X x x x X X x x x RippleNet [115 ] 2018 Mo vies,Books,Ne ws X x x x X X x x X Sem-JMF [95 ] 2016 Music X x x x X x X x x MORE [116 ] 2012 Mo vies x X x X x x X x X HealthRecSys [117 ] 2017 Health x X x X x x X X x HeteRecom [118 ] 2012 Mo vies x X x X x x X x x SemSim [119 ] 2018 Mo vies X x x X x x X x X HeteMF [120 ] 2013 Mo vies x x X x X x X x X PLDSD [121 ] 2017 Mo vies x X x X x x X x x Social-RS [122 ] 2012 Mo vies x x X X x x X x X SocialMF [123 ] 2011 Social X x x x X x x x x AMF [96 ] 2010 Images X x x x X x x x X Con vMF [124 ] 2016 Mo vies, Amazon x x X x X x x x x E-Learning-RS [125 ] 2015 E-Learning x X x X x x x x X PMF [126 ] 2007 Mo vies x x X x X x x x x ERBM [127 ] 2017 Mo vies X x x x X X x X X ASEMF [128 ] 2018 Mo vies X x X x X X X X X SeER [129 ] 2019 e-learning x x X x X X X x X This w ork 2019 Mo vies, Books x x XXX x XXX XXX XXX XXX XXX T able 2.2: A comparison of some recommender systems based on the (a) domain, (b) RS style, (c) av ailability of explanation, (d) system aw areness of semantics, (e) user study , and (f) CSP solution to the cold start problem.
the recommended item as an explanation. The same output happens when Wikipedia or Twitter is chosen. The system consists of three layers. The first one contains users’ liked music gathered from the user’s Facebook page. The second layer is the content layer where items’ features are listed from all three information sources (i.e., Wikipedia, Facebook, and Twitter). The third layer is the recommendation layer that shows the top recommended items. When retrieving information from Wikipedia, the semantic version of it, DBpedia, is used to perform the task using the query language SPARQL. The authors indicate that as Herlocker [98] and Middleton [130] emphasized previously, an explanation increases the acceptance of a recommendation, and an explanatory interface also helps users understand why certain recommendations are shown for them. It also encourages users to get educated and involved in the recommendation process. Thirty-two real users participated in a user study to evaluate the system’s performance and how well the explanation interface helped them understand the recommendation process; see Figure 2.5. The authors concluded that although Wikipedia, when it was the source of the explanation, was more accurate than both Facebook and Twitter, explanations based on Facebook friends was favored by users due to trust in their friends’ interests and tastes.
Catherine et al. [4] proposed a white box recommender system that explains its output by using predefined rules. For example, if user U likes movie M, and movie M is linked to entity E then, user U likes entity E. The ProPPR [131] technique is used to rank both items and their entities for recommendations and explanations. They argued that knowledge graphs, in addition to increasing accuracy, helped generate more convincing explanations. An example is shown in Figure 2.6.
Another approach that is explainable and semantic-aware is [5], where they proposed a post-hoc mechanism to generate explanations. After building the recommender system, a unified het-erogeneous information network (HIN) is built to provide justification for the recommended items. Explanation paths between the target user and other system components are established and ranked then used to show the explanations. To rank the explanation paths candidates, three ranking metrics are used, Credibility, readability, and diversity. An example of the explanation is shown in Figure 2.7.
Hu et al. [6] emphasized the importance of explanations in recommender systems. In their approach, they relied on HIN [132] to generate semantic and justifiable recommendations. Fig-ure 2.8 illustrates the explanation style. Another study that relied on the HIN technique to build a
Figure 2.4: An Example of dbrec’s Output, Source: [2].
Figure 2.5: An Example of TasteWeight’s Output, Source: [3].
Figure 2.7: An Example of SEP’s Output, Source: [5].
Figure 2.8: An Example of RecExp’s Output, Source: [6].
recommender system is SemRec [113]. In this work, the meta-paths obtained from the HIN are per-sonalized and prioritized to accommodate users’ preferences. The cold-start problem is resolved in this work, and they stated that their model outperformed other baseline methods in terms of produc-ing a lower error rate. A study conducted by [7] shed light on the significance of natural language explanations in recommender systems and how linked open data can empower them by linking the user’s previously preferred items and items’ attributes to the new recommendations. The explana-tion mechanism is based on the noexplana-tion that descriptive properties that describe the items that the user liked in the past can serve as explanations for the outputs of the recommender system. A user study was conducted to evaluate the system, and the results show that the proposed system succeeded in
Figure 2.9: An Example of LOD-TRS’ Output, Source: [7].
producing transparent recommendations and explanations. An example of their explanation style is shown in Figure 2.9.
The study of [8] focuses on the issue of explaining the output of a black box recommender system. In this work, the recommender system is built using Autoencoder Neural Network tech-nique that is also aware of the Knowledge Graphs retrieved from the Semantic Web. The KGs are also adopted for the explanation generation. The authors claim that explanations increase the users’ satisfaction, loyalty, and trust in the system. In this study, three explanation styles are proposed, popularity-based, pointwise personalized, and pairwise personalized. Figure 2.10 depicts an exam-ple of the explanation styles. For evaluation, an A/B test was conducted to measure transparency, trust, satisfaction, persuasiveness, and effectiveness of the proposed explanations. The pairwise method was preferable by most users more than pointwise method.
All of the previous studies involved white box systems; however, [15], a Ph.D. thesis, involved a black box system. This doctoral thesis investigated whether it is possible to generate explanations four the output of a black box system using a neighborhood technique based on cosine similarity. An MF system recommends items without being able to explain why due to its complete dependency on explicit user preferences. However, the proposed method succeeded in generating explanations using the above-mentioned technique. This allows explanation generation using the three styles listed in the right-hand column of Table 2.1. Because this study was used for comparison to our proposed work, we elaborate on the technical issues of this study in Section 2.2.5.3. MoviExplain
![Figure 2.4: An Example of dbrec’s Output, Source: [2].](https://thumb-us.123doks.com/thumbv2/123dok_us/9897443.2483266/47.918.157.844.119.542/figure-example-dbrec-s-output-source.webp)
![Figure 2.7: An Example of SEP’s Output, Source: [5].](https://thumb-us.123doks.com/thumbv2/123dok_us/9897443.2483266/48.918.284.692.98.487/figure-an-example-of-sep-output-source.webp)
![Figure 2.10: An Example of SemAuto’s Output, Source: [8].](https://thumb-us.123doks.com/thumbv2/123dok_us/9897443.2483266/50.918.204.757.107.550/figure-an-example-of-semauto-output-source.webp)
![Figure 2.16: Snapshot of the camera recommender system, Source: [16].](https://thumb-us.123doks.com/thumbv2/123dok_us/9897443.2483266/59.918.176.796.107.539/figure-snapshot-camera-recommender-source.webp)