Summary
In present study, C18 (determinate) and C19 (indeterminate) cucumber lines were crossed and the hybrid plants were self-pollinated to produce the F2:3 generation. Th irteen ISSR (Inter Simple Sequence Repeat) primers, two retrotransposons and two IRAP (Inter-Retrotransposon Amplifi ed Polymorphism) combination primers were screened for QTLs (Quantitative Trait Loci) controlling plant height in cucumber. Five QTLs using SIM (Single Interval Mapping) were identifi ed but only two major of them were observed using CIM (Composite Interval Mapping) method for plant height in F2:3 generation. Th e distance of one of the identifi ed QTLs to nearest marker was very low and 0.01 CentiMurgan (cM), which showed a high linked marker to this QTL.
Key words
ISSR, IRAP, ERAP (Exon-Retrotransposon Amplifi ed Polymorphism), QTL, Retrotransposon
Quantitative Trait Locus Analysis of Plant
Height– Related Traits in Cucumber Using
F
2:3
Population
Hamid KALVANDI
1Jamal-Ali OLFATI
1, 3 ( )Habibollah SAMIZADEH
2Yavar VAFAE
E
41 University of Guilan, University Campus 2, Department of Horticultural Sciences, Rasht, Iran e-mail: [email protected]
2 University of Guilan, Faculty of Agricultural Sciences, Department of Agronomy and Plant Breeding, Rasht, Iran
3 University of Guilan, Faculty of Agricultural Sciences, Department of Horticultural Sciences, Rasht, Iran
4 University of Kurdistan, Faculty of Agricultural Sciences, Department of Horticultural Sciences, Sanandaj, Iran
651
Hamid KALVANDI, Jamal-Ali OLFATI, Habibollah SAMIZADEH, Yavar VAFAEEIntroduction
Cucumber (Cucumis sativus L. 2n = 2x = 14) is a cross-pol-linated crop and selection is diffi cult due to unsuitable pollen. Furthermore, plant height is a quantitative trait controlled with many genes (Whittaker et al., 1996). Th ese traits are diffi cult to study due to the complex nature of their inheritance. So, in selec-tion programs, breeders have to use traits that have high and posi-tive correlation with this trait.
Quantitative trait loci (QTL) mapping includes: phenotypic evaluation of a relatively large number of plants from a segregat-ing population; genotypsegregat-ing the population for polymorphic genetic markers, and statistical analyses to identify loci aff ecting quantita-tive traits (Haley and Knott, 1992). Application of molecular mark-ers had enabled the identifi cation of the QTLs information involved in important agronomic traits (Qin et al., 2008). Th e methods to detect quantitative trait loci include single marker analysis; interval mapping; composite interval mapping, and mixed linear models (Whittaker et al., 1996; Haley and Knott, 1992). Inter-simple se-quences repeat (ISSR) PCR is a fast and inexpensive genotyping technique based on variation in regions between microsatellites. Th is method can be used for characterization of genetic related-ness among populations; genetic fi ngerprinting; gene tagging; de-tection of clonal variation; identifi cation of cultivars; phylogenetic analysis; detection of genomic instability, and to assess hybridiza-tion (Tanyolac, 2003; Fernandez et al., 2002).
Retrotransposons (also called transposons via RNA intermedi-ates) are genetic elements that can amplify themselves in a genome and are ubiquitous components of the DNA of many eukaryotic organisms. Th ey are 1 of 2 subclasses of transposon, the other is DNA transposon, which does not involve an RNA intermediate. Th ey are particularly abundant in plants, where they are oft en a principal component of nuclear DNA (SanMiguel and Bennetzen, 1998; Li et al., 2004). Inter-retrotransposon amplifi ed polymor-phism (IRAP), a marker system based on transposable elements in barley, was developed by Kalendar et al. (1999). In contrast to other markers, IRAP aims to genomic polymorphism between two nearby retrotransposons in the genome (Kalendar and Schulman, 2006). A population of 113 cucumber recombinant inbred lines (RILs) derived from a cross between Europe 8 and Qiupeng was used as materials in Chen et al. (2014) study and a total of 58 QTLs were detected in their study. Among them, 1 QTL conferring single plant yield (SPY) was located on the linkage group LG4; 2 QTLs confer-ring the number of fruit setting (NFS) were located on LG2 and LG4. Th e above-mentioned QTLs were detected in only one crop-ping season. Th ere were 5 QTLs conferring female fl ower number (FFN) on LG2, of which, ff n2a and ff n2b, were detected in both cropping seasons with the same positive genetic eff ects.
Th e F2:F3 RAPD analysis and mapping of yield components in cucumber by Serquen et al. (1997) resulted in the identifi cation of QTLs describing main stem height, days to anthesis, sex expression, multiple lateral branching, fruit number and weight, and height/ diameter ratio. However, the presence and strength of QTLs were underestimated by these RAPD marker loci (Serquen et al., 1997).
Th e recent development of ISSR and retrotransposone (Tanyolac, 2003; Fernandez et al., 2002; SanMiguel and Bennetzen, 1998; Li
et al., 2004; Kalendar et al., 1999; Kalendar and Schulman, 2006), should allow for increased map saturation and more precise QTL estimation in cucumber. Th erefore, a study was designed to employ
these markers in the analysis of a F3 progeny to characterize plant height associated QTLs in cucumber.
Materials and methods
Th e experiment was conducted at the University of Guilan from 2014 to 2015. Th e lines C18 (determinate) and C19 (indeterminate), released from the cucumber breeding program at the University of Guilan, were crossed and hybrid plants were self-pollinated as parent lines (P1 and P2, respectively) to produce F2:3 generation. Th e sandy loam soil was prepared by plowing and disking and formed into raised beds by plough and harrow prior to plant es-tablishment. Rows were on 1 m centers and plants were about 50 cm apart in the row. Prior to planting 150 kg·ha-1 of nitrogen from
urea, 100 kg·ha-1 of phosphorous from triple superphosphate, and
80 kg·ha-1 of potassium sulfate were applied. Side dressing with
the same amount of nitrogen and phosphorus occurred at 50% fl owering stage. Irrigation begun at plant fi rst fl owering with 250 m3·ha-1 three times weekly. During April of 2014 and 2015, seed
of the generations (parent and F3 during 2015) were planted with 10 plants in a row for each parent. Th e F2 population contained 86 plants and F3 contained 10 progenies from each selfed F2 plants. A randomized complete block design with three replications was applied. Pests and weeds were controlled with the bio-methods. Yellow and blue cards for trips, white fl y and aphid’s absorption and no pesticides were used. Weeds were controlled by hand without use of herbicides. Plant height at harvesting time was measured.
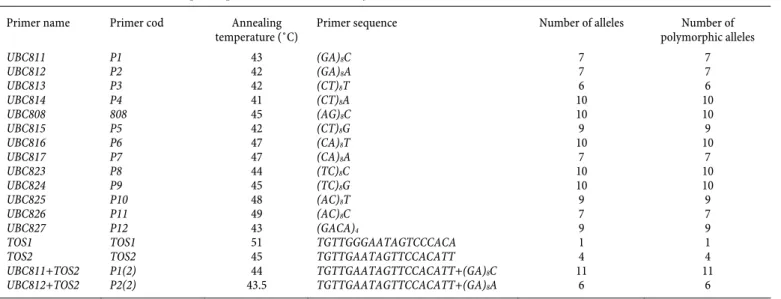
Th e DNA was extracted from fresh young leaves using the procedure of Guo (2003). Th e inter simple sequence repeat (ISSR) protocol employed was similar to that of Fernandez et al. (2002) and the retrotransposon protocol employed was similar to that of SanMiguel and Bennetzen (1998). Th irteen ISSR primers, two retrotransposon and two combination primers (IRAP) (Table 1) exhibiting polymorphism between parents C18 and C19 were fur-ther screened for QTLs loci controlling number of fruit per node. Th e PCR analysis was performed in 15 μl of substrate containing 40 mg DNA, 2.5 mM primer, 10 mM dNTPs, 1.50 μl 10× assay buff er, 0.20 μl Taq polymerase, and 8.10 mL sterile distilled water. Amplifi cation was carried out in a thermal cycler with initial de-naturation for 5 min at 94°C, 40 cycles of denaturing for 1 min at 94°C, annealing for 2 min at 50°C, extension for 2 min at 72°C, and fi nal extension for 5 min at 72°C. Amplifi ed products were sepa-rated by electrophoresis on 1.2% (w/v) agarose gel and visualized by staining with ethidium bromide.
Genotype data were used to perform linkage analyses using Win QTL Cartographer (Basten et al., 2001). A minimum LOD of 2.5 was set as a threshold to relegate marker loci into linkage groups, to order markers, and to estimate interval distances (Kosambi function). A graphic representation of the linkage groups was cre-ated using MapManager QTXb17 (Manly and Olson, 1999). Trait distributions were examined for fi t to normality using the SAS.
Composite interval mapping (CIM) was performed using Model 6 of QTL Cartographer (version 1.21) with a walking speed of 0.5 cM, a window size parameter of 3 cM, and the inclusion of 15 maximum background marker loci in a stepwise forward regres-sion procedure. Th e inclusion of background marker loci allowed for greater sensitivity in QTL detection and a conservative estima-tion of their eff ects (R2). Th e signifi cance of each QTL interval was tested by a likelihood-ratio statistic (LOD). Th e LOD threshold for signifi cance at p = 0.05 was determined using 1,000 permutations.
Results
Plant height distributions were fi tted to normality in the F2:3 generation (Figure 1). Phenotypic values of plant height in P1 and P2 parents and F2:3 populations showed that two parents had a signifi cant diff erence using t-student test (Table 2). Th e highest polymorph allele number was obtained in IRAP when UBC811 (an ISSR marker) and TOS2 (a retrotransposon marker) were applied simultaneously (Table 3). Furthermore, as presented in Table 3, all of the used primers showed a 100 percent polymorphism.
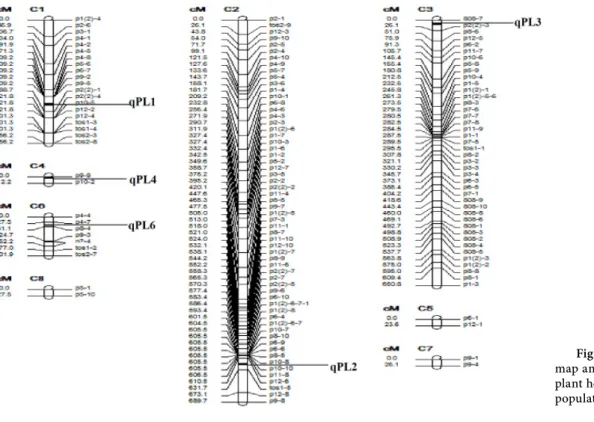
Five QTLs were detected for plant height in cucumber using SIM method, but two of them that showed the highest LOD value were identifi ed by CIM (Table 3 and Figure 2). Th ese QTLs that identifi ed using both SIM and CIM, were located on chromosomes 3 and 4. Th e additive and dominant eff ects for the QTL linked to UBC876-2 and UBC823-7 showed that alleles inherited from these positions had a decreasing eff ect on plant height (Table 3).
Primer name Primer cod Annealing temperature (˚C)
Primer sequence Number of alleles Number of polymorphic alleles UBC811 P1 43 (GA)8C 7 7 UBC812 P2 42 (GA)8A 7 7 UBC813 P3 42 (CT)8T 6 6 UBC814 P4 41 (CT)8A 10 10 UBC808 808 45 (AG)8C 10 10 UBC815 P5 42 (CT)8G 9 9 UBC816 P6 47 (CA)8T 10 10 UBC817 P7 47 (CA)8A 7 7 UBC823 P8 44 (TC)8C 10 10 UBC824 P9 45 (TC)8G 10 10 UBC825 P10 48 (AC)8T 9 9 UBC826 P11 49 (AC)8C 7 7 UBC827 P12 43 (GACA)4 9 9
TOS1 TOS1 51 TGTTGGGAATAGTCCCACA 1 1
TOS2 TOS2 45 TGTTGAATAGTTCCACATT 4 4
UBC811+TOS2 P1(2) 44 TGTTGAATAGTTCCACATT+(GA)8C 11 11
UBC812+TOS2 P2(2) 43.5 TGTTGAATAGTTCCACATT+(GA)8A 6 6
C118 (m±SD) C119 (m±SD) t-value (P1-P2) F2:3 (m±SD) F2:3 Kurtosis F2:3 Skewness
110.18±5.5 179.19±7.6 -8.481** 126.8±18 -0.49 0.29
Mapping method
QTLs Flanking markers Distance to nearest marker Chromosomal location LOD score QTL Peak position (cM) Additive effect Dominant effect QTL effect (%) SIM qPL1 qPL2 qPL3 qPL4 qPL6 p9-5-p2(2)-1 p12-4-tos1-3-tos1-4-tos2-3 808-7-p2(2)-3 p9-9-p10-2 p4-7-p8-4 34.04 17.22 9.01 0.01 6.63 1 2 3 4 6 4.72 4.83 6.82 6.66 2.66 443.24 618.52 9.01 0.01 44.47 -7.63 1.22 -8.35 -13.88 7.07 -15.38 30.20 -20.46 37.62 -7.58 11 0 17 26 12 CIM qPL3 qPL4 808-7-p2(2)-3 p9-9-p10-2 9.01 0.01 3 4 4.54 3.59 9.01 0.01 -5.85 -9.03 -15.86 -14.87 7 9
Table 2. Phenotypic values of plant height in parents (C118 and C119) and F2:3 populations
Table 3. Information on QTL identified from F2:3 population through the simple interval mapping (SIM) and composite interval mapping
(CIM) for plant height
Table 1. List of ISSR and retrotransposon primers used in this study
Figure 1. Frequency distribution of the means of the F2:3
851
Hamid KALVANDI, Jamal-Ali OLFATI, Habibollah SAMIZADEH, Yavar VAFAEEDiscussion
Molecular markers used in the present study have enough poly-morphism that is important for cucumber because many molecu-lar markers cannot produce enough polymorphism for breeding program based on molecular markers such as marker assisted se-lection (Witkowicz et al., 2003).
It is known that vegetative growth related traits in cucumber can be aff ected by environments, but QTLs with relative high and stable phenotypic variation for vegetative traits were detected in this study. We speculate that this region might contain a few genes related to the hormonal biosynthesis and signal transduction path-ways that lead to the vegetative growth. Previous researchers have reported that plant height is genetically controlled by quantita-tive trait loci (QTL) (Marza et al., 2006; Huang et al., 2003). In the present study, the location of two highly signifi cant QTLs of plant height were detected in chromosome 3 and 4 and were consistent with the expected location of (UBC808)-7 + (UBC812+TOS2)-3 and (UBC824)-9 + (UBC825)-2 fl anking markers.
Using the molecular markers tightly linked to targeted agro-nomic traits is an effi cient breeding approach for crops improve-ment, especially for the improvement of some complex traits (having complex environmental relationships like plant height) (Yu et al. 2000; Fan et al. 2006; Zhu and Sun 2006; Lecomte et al. 2004; Yuan et al., 2008).
Application of MAS for the agronomic traits in cucumber has been proved to be very eff ective (Fan et al., 2006). Application of this sequence specifi c marker information on the stable QTLs with high phenotypic variation to the fresh-eating cucumber breeding with MAS is our further project for improving precocity and fruit shape in cucumber production.
Conclusion
In general, although a diff erent QTL numbers were detected for plant height by diff erent QTL mapping methods, all identifi ed QTLs by using CIM mapping method could fi nd those identifi ed by SIM. Th erefore, focusing on the markers linked to the QTLs that were found by both methods, can be used for improvement of plant height in cucumber breeding programs. In this study, (UBC808)-7 + (UBC812+TOS2)-3 and (UBC824)-9 + (UBC825)-2 fl anking mark-ers were found to be closely linked with the QTLs for plant length.
References
Basten, C.J.; Weir, B.S.; Zeng, Z.B. 2001. QTL Cartographer: a reference manual and tutorial for QTL mapping. North Carolina State University. USA.
Chen, Q.; Zhang, H.; Wang, Y.; Li, W.; Zhang, F.; Mao, A.; Cheng, J.; Chen, M. 2014. Mapping and analyzing QTLs of yield-associated agronomic traits of greenhouse cucumbers. Scientia Agricultura Sinica. 43(1): 112-122.
Fan, Z.; Robbins, M.D.; Staub, J.E. 2006. Population development by phenotypic selection with subsequent marker assisted selection for line extraction in cucumber (Cucumis sativus L.). Th eor Appl Genet. 112: 834–855
Fernández, M.E.; Figueiras, A.M.; Benito, C. 2002. Th e use of ISSR and RAPD markers for detecting DNA polymorphism, genotype identifi cation and genetic diversity among barley cultivars with known origin. Th eoretical and Applied Genetics. 104(5): 845-851. Guo, Y.M. 2003. Studies on the inheritance of the cucumber bitterness
and AFLP molecular marker. Journal of Plant Genome. 81: 142-149. Haley, C.S.; Knott, S.A. 1992. A simple regression method for mapping
quantitative trait loci in line crosses using fl anking markers. Heredity. 69: 315-324.
Huang, L.; Brooks, S.A.; Li, W.L.; Fellers, J.P.; Trick, H.N.; Gill, B.S. 2003. Map-based cloning of leaf rust resistance gene Lr21 from the large and polyploid genome of bread wheat. Genetics. 164: 655-664.
Figure 2. The chromosomal
map and QTLs controlling plant height mapped in the F2:3 population
Kalendar, R.; Schulman, A.H. 2006. IRAP and REMAP for
retrotransposon-based genotyping and fi ngerprinting. Nat Protoc 1: 2478–2484.
Kalendar, R.; Grob, T.; Regina, M.; Suoniemi, A.; Schulman, A. 1999. IRAP and REMAP: two new retrotransposon-based DNA fi ngerprinting techniques. Th eor Appl Genet. 98: 704–711. Li, W.; Zhang, P.; Fellers, J.P.; Friebe, B.; Gill, B.S. 2004. Sequence
composition, organization, and evolution of the core Triticeae genome. Plant Journal. 40(4): 500-511.
Manly, K.F.; Olson, J.M. 1999. Overview of QTL mapping soft ware and introduction to map manager QT. Mamm Genome. 10(4): 327-34. Marza, F.; Bai, G.H.; Carver, B.F.; Zhou, W.C. 2006. Quantitative trait
loci for yield and related traits in wheat population Ning7840×Clark. Th eor. Appl. Genet. 112: 688-698.
Qin, Y.; Kim, S.M.; Sohn, J.K. 2008. Identifi cation and characterization of QTLs and QTL interactions for Macro-and Micro-elements in rice
(Oryza sativa L.) grain. J Plant Biotechnol. 35(4): 257-263.
SanMiguel, P.; Bennetzen, J.L. 1998. Evidence that a recent increase in maize genome size was caused by the massive amplifi cation of intergene retrotranposons. Annals of Botany. 82: 37-44.
Serquen, F.C.; Bacher, J.; Staub, J.E. 1997. Mapping and QTL analysis of horticultural traits in a narrow cross in cucumber (Cucumis sativus L.) using random-amplifi ed polymorphic DNA markers. Mol Breed. 3: 257–268.
Tanyolac, B. 2003. Inter-simple sequence repeat (ISSR) and RAPD variation among wild barley (Hordeum vulgare L. subsp.
spontaneum) populations from west Turkey. Genetic Resources and
Crop Evolution. 50(6): 611-614.
Whittaker, J.C.; Th ompson, R.; Visscher, P.M. 1996. On the mapping of QTL by regression of phenotype on marker type. Heredity. 77: 23-32. Witkowicz, J.; Urbańczyk-Wochniak, E.; Przybecki, Z. 2003. AFLP
marker polymorphism in cucumber (Cucumis sativus L.) near isogenic lines diff ering in sex expression. Cell Mol Biol Lett. 8(2): 375-81.
Yuan, X. J.; Pan, J. S.; Cai, R.; Guan, Y.; Liu, L. Z.; Zhang, W. W.; Li, Z.; He, H. L.; Zhang, C.; Si, L. T.; Zhu, L. H. 2008. Genetic mapping and QTL analysis of fruit and fl ower related traits in cucumber (Cucumis
sativus L.) using recombinant inbred lines. Euphytica. 164: 473–491.