c
A DATA-DRIVEN APPROACH TO SOIL MOISTURE COLLECTION AND PREDICTION USING A WIRELESS SENSOR NETWORK AND
MACHINE LEARNING TECHNIQUES
BY
ZHIHAO HONG
THESIS
Submitted in partial fulfillment of the requirements
for the degree of Master of Science in Electrical and Computer Engineering in the Graduate College of the
University of Illinois at Urbana-Champaign, 2015
Urbana, Illinois Advisers:
Professor Ravishankar K. Iyer Professor Zbigniew T. Kalbarczyk
Abstract
Agriculture has been one of the most underinvestigated areas in technology, and the development of Precision Agriculture is still in its early stages. This thesis proposes a data-driven methodology that aims to address some of the current problems in Precision Agriculture development. Soil moisture, a key factor in the crop growth cycle, is selected as an example to demonstrate the effectiveness of our data-driven approach. The success of the data-driven approach depends on two factors: (1) the quality of the data gathered and (2) the effectiveness of its analysis and interpretation. Previous studies have focused on addressing these factors separately, by either developing hardware for collecting soil moisture data or building efficient data analysis models.
In our work, we take a holistic approach by addressing problems on both ends and designing an integrated system for Precision Agriculture that uses a wireless sensor network and machine learning techniques. On the collection side, a reactive wireless sensor node is developed that aims to capture the dynamics of soil moisture while sampling at relatively low frequency to save energy. The sensor node dynamically adjusts its sampling frequency based on soil moisture readings and can be easily configured to meet the specific needs applications. The hardware is prototyped using MicaZ mote and VH400 soil moisture sensor. On the data analysis side, a site-specific soil moisture pre-diction framework is proposed based on models generated by the statistically sound machine learning techniques SVM (support vector machine) and RVM (relevance vector machine). The framework can integrate inputs from other reliable data sources to improve its accuracy. The proposed framework is evaluated under a historical dataset on 9 sites across Illinois. It achieves low error rates (15%) and high correlations (95%) between predicted values and actual values when forecasting soil moisture about 2 weeks ahead.
Acknowledgments
I would like to express my deepest appreciation to my advisers, Professor Ravishankar K. Iyer and Professor Zbigniew T. Kalbarczyk, for their support and guidance. It has been a great experience and an honor to work in the DEPEND group, where I have learned much about research during the past two years. I believe this experience will benefit me greatly in my future career. I would also like to thank Professor Prasanta K. Kalita of the Agricultural Engineering Department for his great insights and feedback on my research. I would also like to thank the University of Illinois for giving me the op-portunity to finish both my bachelor’s and master’s degrees here. During my six years in Urbana, I have made friends and pals with whom I can share sadness and happiness. I am grateful for all the things that I have experi-enced here. They all helped me to learn and grow. Particularly, I thank the following members of the DEPEND group for the insights and support that I have received: Heidi Leerkamp, Daniel Chen, Catello Di Martino, Arjun Prasanna Athreya, Cuong Manh Pham, Homa Alemzadeh, Zachary Estrada, Phuong Minh Cao, Zachary Stephens, Qingkun Li, Subho Sankar Banerjee, Hui Lin, Yogatheesan Varatharajah, Key Whan Chung, Eric Badger, and Saurabh Jha.
Last but not least, I would like to express my deep gratitude toward my family members. I thank them for their understanding, patience, and love. Although we are apart most of the time and communication can be difficult, they always provide support and encouragement when I need it.
Table of Contents
Chapter 1 INTRODUCTION . . . 1
1.1 Contributions . . . 4
1.2 Thesis Organization . . . 5
Chapter 2 BACKGROUND AND RELATED WORK . . . 6
2.1 Precision Agriculture . . . 6
2.2 Soil Moisture . . . 7
2.3 Methods of Soil Moisture Estimation . . . 8
2.4 Wireless Sensor Network . . . 10
2.4.1 Wireless Sensor Node . . . 10
2.4.2 Wireless Sensor Network . . . 11
2.5 Machine Learning . . . 12
2.5.1 Supervised Learning . . . 12
2.6 Related Work . . . 12
2.6.1 WSN in Precision Agriculture . . . 13
2.6.2 Machine Learning in Precision Agriculture . . . 14
2.6.3 Work on Integrated Approach . . . 14
Chapter 3 SYSTEM OVERVIEW . . . 16
3.1 System Overview . . . 16
3.2 Data Source . . . 18
Chapter 4 SOIL MOISTURE COLLECTION SYSTEM . . . 20
4.1 Collection System Overview . . . 20
4.2 Design Methodology . . . 21
4.3 Reactive Node Design . . . 22
4.3.1 Reactive Sensing . . . 22
4.3.2 Reconfigurable Devices . . . 23
4.3.3 Robustness . . . 25
4.4 Work Flow . . . 27
Chapter 5 SYSTEM IMPLEMENTATIONS AND EVALUATION . 29 5.1 Hardware System . . . 29 5.1.1 Hardware Platform . . . 29 5.1.2 Sensors . . . 31 5.1.3 Hardware Configuration . . . 33 5.2 Software System . . . 33 5.2.1 System Environment . . . 33 5.2.2 Software Implementation . . . 34 5.3 Evaluation . . . 34
5.3.1 Testing in the Soil . . . 35
5.3.2 Evaluation at Historical Data Set . . . 37
Chapter 6 SOIL MOISTURE PREDICTION SYSTEM . . . 40
6.1 Prediction System Overview . . . 40
6.1.1 Site-Specific Modeling . . . 42
6.1.2 Inclusion Data from Other Sources . . . 43
6.2 Features Selection . . . 45
6.3 Preprocessing . . . 45
6.3.1 Data Parsing and Error Checking . . . 46
6.3.2 Data Correction . . . 47
6.4 Learning Algorithms . . . 47
6.4.1 Support Vector Machine . . . 48
6.4.2 Relevance Vector Machine . . . 49
6.4.3 Discussion of SVM and RVM . . . 50
Chapter 7 PREDICTION MODEL EVALUATION . . . 52
7.1 Methodology . . . 52
7.2 Soil Moisture Forecasting . . . 53
7.3 Soil Moisture Estimation in Time-Series . . . 56
Chapter 8 CONCLUSION AND FUTURE WORK . . . 60
8.1 Conclusion . . . 60
8.2 Future Work . . . 61
Appendix A TOP-LEVEL CONFIGURATION FILE . . . 63
Appendix B IMPLEMENTATION CODE . . . 65
Appendix C BASE NODE LOGGING APP . . . 73
Chapter 1
INTRODUCTION
The average farm size in the U.S. is increasing every year despite a con-tinuously decreasing farmer population [1]. As a result, more and more cropland is shifting to large farms. A report from the USDA [2] predicts that over 20-25 years the average farm size will double. A large farm relies on a more structured and automated management system to realize better financial returns and use of resources. Globally, the demand for food has skyrocketed, especially in developing countries such as India and China. The prices of wheat and corn have tripled, and the price of rice climbed fivefold in three years from 2005 to 2008 [3], pushing 75 million people into poverty in nearly two dozen counties. Established 20th century solutions to meet food demand—clearing more land and using more fertilizer, pesticide, insecticide, and water—may no longer work [4].
Precision Agriculture (PA) promises to deliver the next generation of agri-culture by actively using technology to collect various types of data and applying site-specific, sensor-based treatment to the farm. Figure 1.1 illustrates the PA vision. Data-driven agriculture is still at an early stage of development and faces many challenges. As pointed out in [5, 6, 7], the major problems for PA to become reality include:
• Crop management decisions and data collection systems need to be designed to meet the needs of specific farms.
• Automated and user-friendly systems need to be developed for users with less software experience.
• The introduction of expert knowledge must be possible. Systems should allow the inclusion of new automated methods for user-defined terms. • Devices need to be affordable and scalable for large farm deployment.
Figure 1.1: The proposed vision of Precision Agriculture
In our vision for PA or next-generation agriculture, farms would be built on adata-driven or data-centric approach. The objective of PA is to use data to improve productivity and yield, lowering resource and labor costs. As the world moves into the era of the Internet of Things (IoT), data are collected in various forms from different types of devices. A unified platform is needed to ensure that the data formats are consistent and that data are readily analyzable.
A combination of different types of data-gathering technologies should be applied together to allow site-specific data to be collected on a large scale without granularity loss. Data accuracy and integrity are crucial to a data-driven approach, as they impact the effectiveness of corresponding analysis tools. Collecting similar types of data using different methods can enhance the accuracy and integrity of the data. Also, mixing different data collec-tion methods allows methods to complement each other's shortcomings. For example, remote sensing techniques are good at collecting large-scale data with coarse granularity, while wireless sensor networks promise to deliver data with fine granularity. As a result, the inclusion of data from other sources should be considered from the system design and modeling perspective. Once data are collected, data mining techniques can be applied to extract patterns and build estimation and prediction models that are valuable to farm man-agement. The data can also be applied back to collection systems to make
them more efficient and reliable. In this way, next-generation agriculture becomes a feedback system where data not only optimize decision-making but also reshape data collection to meet specific needs. Figure 1.1 further highlights our approach and shows different components that contribute to our data-centric agriculture approach.
In this thesis, a site-specific data collection and data mining system is designed and implemented to fulfill part of the proposed vision using a data-driven approach to maintaining soil moisture. Some of the current problems in Precision Agriculture are addressed in our work by using a wireless sen-sor network and machine learning techniques in collection and prediction, respectively. Soil moisture, a key factor in plant growth, is closely related to irrigation, which consumes about 70% of the world’s accessible freshwater each year [8]. We demonstrate that using a data-driven approach, the sys-tem can incorporate user-defined inputs and efficiently collect fine-grained soil moisture data and related meteorological data. Two regression super-vised machine learning algorithms—support vector machine (SVM) [9] and relevance vector machine (RVM) [10]—are used to show the effectiveness of data-driven tools in building a site-specific soil moisture model. In our work, an integrated system is presented that addresses both ends of the data-driven approach: data gathering and data analysis.
Existing studies and research have provided separate solutions on the col-lection and analysis ends. In [11], a wireless sensor network has been de-ployed in large fields to collect soil moisture and meteorological data. The data acquisition procedure starts every 10 min for monitoring soil moisture dynamics in the field. A reactive sensor node was developed in [12] that samples at high frequency during rainfall. On the analysis end, soil moisture modeling has been studied for decades. Soil moisture analysis includes topics on physically based modeling, data-driven modeling, geostatistical analysis, and more. While designing physically based models requires significant in-depth knowledge of soil water and a statistics background, machine learn-ing techniques can efficiently generate site-specific models, once the trainlearn-ing methodology and respected dataset are set. Past research has applied neural networks [13], vector machines [14, 15], polynomial regression [16], and more on historical soil moisture datasets in the hydrology domain. However, none of them built a system from the Precision Agricultural perspective that took a holistic approach by addressing problems in both collection and
analy-sis. The success of the data-driven approach relies on the quality of the data gathered and the effectiveness of its analysis and interpretation. By looking at problems on both ends, a more unified and optimized system can be de-signed from the types of data gathered and the data granularity required for modeling tools.
1.1
Contributions
The specific contributions of this thesis are summarized as follows:
• We propose a data-driven methodology to address some of the cur-rent problems in Precision Agriculture. Soil moisture is at the core of plant growth and has effect on irrigation scheduling, yield forecasting, fertilizers use estimating, etc. Large volumes of data related to soil moisture and climate have been collected decades which are preferable in the context of using data-driven tools, and are easy to retrieve. For the above reasons, soil moisture is selected as an example to demon-strate the effectiveness of the data-driven approach. Using a wireless sensor network and machine learning techniques, we provide solutions for data gathering and data interpretation.
• We prototype a reactive wireless sensor node that can efficiently cap-ture soil moiscap-ture dynamics using insights from historical data. A framework is proposed to let users easily configure the device to be application-specific. The prototyped device is tested on field soil to demonstrate its functionality and the responsiveness of the sensors. Using historical data from the Illinois Climate Network (ICN) [17], we demonstrate the effectiveness of our reactive sampling algorithm in cap-turing soil moisture dynamics compared with static sampling methods. • We present a unique soil moisture prediction framework and evaluate the framework based on Illinois statewide historical data. The proposed framework is built on models generated by the SVM and the RVM algorithms. It achieves low error rates (15%) and high correlations (95%) between predicted values and actual values when forecasting soil moisture about 2 weeks ahead. Our experimental results show that
prediction outputs can remain accurate over a long period of time (one year) when models are corrected by reliable data from other sources every 45 days. A unified, well-formatted statewide dataset about soil moisture profiles and meteorology in Illinois is produced and can be used for further research.
1.2
Thesis Organization
The rest of the thesis is organized as follows: Chapter 2 provides the back-ground of Precision Agriculture, other methods of estimating soil moisture, and the existing work using wireless sensor networks and machine learning techniques in agriculture. Chapter 3 briefly introduces the overall system and dataset used for our data analysis. Chapter 4 presents the detailed design of our smart wireless sensor hardware and its software algorithm. The imple-mentation and evaluation of the collection system are presented in Chapter 5. The prediction model is described in Chapter 6. Chapter 7 discusses the experimental results obtained. The thesis concludes and future work is described in Chapter 8.
Chapter 2
BACKGROUND AND RELATED WORK
In this chapter, we provide background information on Precision Agricul-ture, techniques used in this work, and existing work in the field. First, an overview of Precision Agriculture is presented, followed by a discussion of the importance of soil moisture in agriculture. Then, we discuss the existing approaches to soil moisture measurement, estimation, and prediction. Back-ground information on our techniques and related work is presented at the end.
2.1
Precision Agriculture
Precision Agriculture, or Precision Farming, is a farming management con-cept that was first introduced around the 1980s in the United States. The idea of Precision Farming is to bring automated technology into the agri-culture industry to improve the effectiveness of agricultural practices and to increase the crop yield. The United States Department of Agriculture (USDA) calls this kind of agriculture “as needed” farming, in which farm-ing decisions are made based on data-driven approaches[18]. The closed cycle in figure 2.1 helps to illustrate the concept in detail by breaking the concept down into a set of activities.
Within the Precision Agriculture framework, site-specific data on soils, crops, nutrients, pests, or yield are collected for analysis. By processing those raw but site-specific data, farmers are able to gain fine-grained insights into their farms and make smart decision accordingly. For instance, the agri-culture sector consumes about 70% of the planet's accessible freshwater [8]. With the help of fine-grained, on-site soil moisture information, a farmer can apply water to places where it is needed instead of applying the same amount of water across the farm. Fine-grained information reduces the financial cost
Figure 2.1: Precision Agriculture decision making cycle [18] of irrigation and avoids the problems of over-irrigation.
As pointed out in [19], Precision Agriculture should be a holistic approach to reorient the total system of agriculture towards low input, high efficiency, and sustainability. This encourages us to take a systems approach to our topic of soil moisture and design a system that covers all the components of the decision-making cycle shown in figure 2.1.
2.2
Soil Moisture
The soil moisture value represents the fraction of the total volume of soil that is occupied by liquid (water), as expressed in the equation below. Quantita-tively, wfv (water fraction by volume) orvwc (volumetric water content) are used as units to describe soil moisture level within a range of 0 to 1.
vwc= Vw Vt
whereVw represents liquid phase (water) in the soil sample andVtis the total volume of the sample.
Soil moisture plays a crucial role in crop growth and final yield because plant roots extract water from soil and react quickly to the environmental changes. In the work of [20, 21, 22], a strong correlation is found between
soil moisture and crop yields of wheat and corn.
The impact of soil moisture on crop growth varies significantly with depth. In [23, 24], water extraction at different depths is studied. Although corn roots typically extend to 90 cm, 96% of the water absorption from the crop seeding stage to the growing stage happens at depth of 5 cm to 30 cm, which is called the root zone. This information helps us to identify target depths for our soil moisture system.
Aside from the agriculture sector, soil moisture is frequently studied in hydrology and environmental science. It can be a critical factor in flooding and erosion. Therefore, soil moisture estimation and prediction methods can be useful in crop production, irrigation scheduling, flood prevention, and more. Agricultural soil moisture study should focus on the root zone, from depth of 5 cm to 30 cm, where crops extract the most water.
2.3
Methods of Soil Moisture Estimation
Conventionally, the most accurate method of obtaining soil moisture is the gravimetric method [25]. The gravimetric method requires a person to physi-cally go to the field and take soil samples. The soil samples are kept in closed containers and proceed to the drying phase. In the drying stages, several steps are carefully taken to turn the soil into a solid via either a microwave oven or conventional oven. The soil moisture content can be calculated based on the mass loss of the sample during the overall process. Although accu-rate soil moisture value can be obtained, it is obvious that this method is time consuming and cost prohibitive. Furthermore, the gravimetric method can present the problems of choosing sample sites, and it is not suitable for large-scale farms.
Another method used to estimate soil moisture is modeling of soil pro-files. In [26, 27, 28, 29], various models are proposed using physically-based empirical data. The model parameters are estimated together with environ-mental factors such as precipitation, temperature, etc. While these models show good results in their respected papers, designing a mathematical model requires significant in-depth knowledge of soil water and a statistics back-ground. The physically based parameters require specific devices to measure. The models derived are very general, and a “one size fits all” model is
pro-posed for a particular soil type. We believe that obtaining a good “one size fits all” model can be very challenging due to the spatial and temporal varia-tions in precipitation, soil property, temperature, vegetation characteristics, and many other environmental factors.
Remote sensing techniques have drawn lots of attention in this research field in recent decades due to advancements in satellite sensing and imaging classification technology. It has been proven that there is a strong correla-tion between soil moisture values and microwave emissivity and infrared data [30]. Satellites equipped with large diameter antennas and microwave sen-sors enable us to capture large-scale microwave images with relatively good spatial resolution. The collected data are then used to estimate large-scale soil moisture for the purpose of modeling the interaction between land and atmosphere with higher accuracy. To capture images with higher resolution requires that satellites stay at lower elevation and be equipped with larger diameter antennas, which in turn require more fuel to maintain in space [31]. With the advancement of unmanned aerial vehicles (UAV), remote sensing has become less expensive and more accessible to farmers.
Active and passive microwave remote sensing shows great capability to obtain observation of soil moisture at global and regional levels and has become the main focus of researchers in hydrology. One ongoing, state-of-the-art NASA research that launched in 2014 is the Soil Moisture Active Passive (SMAP) [32]. The SMAP utilizes a very large antenna and combined radiometers/radar to measure soil moisture at higher resolution than current radiometers can achieve. The passive radiometer will have a nominal spatial resolution of 36 km, and the active radar will have a resolution of 1 km [31]. SMAP uses high-resolution radar observation to disaggregate coarse resolution radiometer observation and produces a soil moisture value of 3 km resolution. These methods of integrating the use of active and passive sensors to downscale the passive microwave estimation of soil moisture has shown promising results in the work of [33, 34].
Remote sensing methods still have many shortcomings when applied in agriculture. First, the measurement is usually in macro-scale with each pixel in the 8-10 km range, which is too coarse. The large pixel size does not reflect the variations within the pixel and fails to provide fine-grained information by only forecasting the “average” value within the pixel. Secondly, the depth of soil that remote sensing is capable of forecasting is limited to the surface
area. As pointed out in [31, 35], the penetration depth is on the order of one tenth of the wavelength. The typical sensing depth of soil is around 2 cm to 5 cm, which does not cover the full depths of plant roots. The ma-jority of water extraction for corn and wheat happens within the range of 5 cm to 30 cm, as mentioned in [23, 24]. Lastly, the raw collected data can be noisy. The electromagnetic response of the land surface is modified by surface roughness, vegetation canopy effects, and other factors that interact with atmosphere before the data is received by the sensor. With the increase in sensing frequency, more noise is added to the data. These factors influ-ence the accuracy of the raw data and thus make the modeling result more inaccurate.
2.4
Wireless Sensor Network
In our work, we apply a wireless sensor network and machine learning tech-niques to soil moisture in order to overcome or compensate for the disad-vantages of the methods discussed in the previous section. Background in-formation about these two techniques and related work are presented in the following section.
2.4.1
Wireless Sensor Node
Wireless sensor networks (WSNs) have been widely used in data collection and monitoring. The data are collected automatically and promise to reflect fine-grained, dynamic changes. A wireless sensor node consists of four main parts: sensing unit, processing unit, transmission unit, and power unit, as shown in figure 2.2. A sensing unit comprises sensors and analog-to-digital converters (ADC). A wireless sensor node usually provides multiple ports where analog sensors can be attached. The analog signals produced by the sensor are fed to an ADC, which converts the reading into digital format. The processing unit is a lightweight microcontroller with a small amount of memory to process data. The transmission unit, often referred to as a RF chip, is responsible for sending and receiving data to the network. The RF chip can be in either sending state or receiving state, but not both. The power unit receives power from an external power supply and provides power
Figure 2.2: Wireless sensor node structure [36] to other units.
2.4.2
Wireless Sensor Network
A wireless sensor network comprises spatially distributed autonomous sen-sors and a base station. Each sensor node is pre-loaded with some routing protocols that route data packets to the base station. The commonly used protocols are the star topology protocol, the tree-based protocol, and the cluster-based protocol. In star network protocol, all sensing nodes are con-sidered peers, and communication happens only between the base station and peer nodes. This ensures minimal overhead to maintain the infrastructure. Tree-based protocol performs well if nodes are spatially distributed, while cluster-based protocol is more suitable in situations where the distribution of sensors is dense. The job of the base station is to collect data from the network and communicate with other networks or services, such as logging, Internet, or satellite.
2.5
Machine Learning
Data analysis tools can be applied to extract useful information, once field data are collected. In our work, machine learning techniques are used as tools to establish prediction models.
Machine learning is a scientific discipline that explores the design of algo-rithms that can learn from the data [37]. The main objective is to find an unknown relationship or to infer the function dependency between input and output data. Depending on the target or output type of the algorithm, the problem can be either classification (if the targets are nominal) or regres-sion (if the targets are numerical). Based on the label status of the target value, machine learning techniques can be categorized as supervised, semi-supervised, and unsupervised. For building prediction models, supervised learning is used, since the training targets are well labeled.
2.5.1
Supervised Learning
In supervised learning, the objective of the learning algorithms is to infer a function from labeled training data. Pairs of training data consisting of input and output data are fed to the learning algorithm. The algorithm optimizes parameters of underlying functions by minimizing some objective function, such as error rate or boundary margin, and produces an optimized inferred function. Varieties of supervised learning have been developed, such as per-ceptrons, neural networks, and vector machines. This work uses two vector machine learning algorithms—support vector machine (SVM) and relevance vector machine (RVM)—to build models based on a preliminary study in [16], which explored various techniques for soil moisture prediction.
2.6
Related Work
In the next two sections, related work on WSNs and machine learning tech-niques is presented. In the last section, work that takes a systems approach and integrates both techniques is discussed.
2.6.1
WSN in Precision Agriculture
The development of WSN applications in Precision Agriculture makes it pos-sible to increase efficiency, productivity, and profitability while minimizing unintended impact on wildlife and agricultural production systems. Real-time information from the fields provides a solid base for farmers to adjust strategies at any time.
The following are several successful projects using wireless sensor tech-niques.
• An automatic irrigation controller for Precision Agriculture was pre-sented in [38]. The controller is an embedded sensor node that reg-ulates the desired soil moisture level based on sensor readings. The sensor node takes soil moisture samples periodically, and the irrigation scheme is adjusted based on the readings.
• Wireless sensors have also been deployed to monitor the temperatures in vineyards [39]. The temperature information is used for predicting two important factors that impact the wine quality: head summation and potential frost damage.
• Akyildiz and Stuntebeck [40] developed an underground sensors system for monitoring soil conditions by deploying sensor nodes completely underground. The system can provide irrigation and fertilization in-formation based on the measured water and mineral content.
• Sensors were also applied in the greenhouse environment, which is rel-atively stable and protects devices from harsh weather. Liu et al. [41] developed a wireless sensor network in a greenhouse that integrates a variety of sensors to measure substrate water, temperature, electrical conductivity, daily photosynthetic radiation, and leaf wetness in real time. The result shows an improvement in plant growth yield and in water and fertilizer schemes while reducing plant diseases related to over-watering. Wang et al. [42] developed a specialized wireless sensor node for monitoring temperature, relative humidity, and light inside greenhouses.
2.6.2
Machine Learning in Precision Agriculture
The following projects have shown promising results for applying machine learning techniques to agriculture.
• In terms of soil moisture, most of the machine learning techniques have been explored in the area of hydrology. Techniques such as neural networks [13], SVM [15], and multivariate relevance vector machines (MVRVM) [14] have been applied at sites such as rangeland and wa-tershed. In [15], SVM techniques were used to predict soil moisture at the Little Washita River watershed in Oklahoma. In [14], MVRVM (a variation of RVM) was applied to predict deep root zone soil moisture based on surface parameters. In all of the work mentioned above, the prediction period is set to around 7-10 days ahead.
• There are some projects that focus on irrigation scheduling. In [43], the authors used neural networks to identify nonlinear relationships between plant water status and the textural features of pictorial infor-mation of the plant canopy.
• In [44], the authors use genetic machine learning approaches by running the WEKA [45] workbench to identify the status of strawberry plants. The system gathers environmental data related to lights and soil mois-ture to determinate the plants’ health status. A number of rules are generated by the machine learning tools in WEKA to determine the threshold at which the plants’ health status changes.
2.6.3
Work on Integrated Approach
While most of the research addresses sensing and analysis separately, there are a few projects that integrate the two approaches and build a complete system.
• In [46], a system is built for nitrogen fertilizer. A nitrogen sensor is designed and built to examine the water condition in the plant and soil online. Appropriate amounts of nitrogen fertilizer are then applied based on the reference number. The reference value of a crop-specific nitrogen requirement is established based on the data fusion of remote sensing data, real-time sensing data, and established knowledge.
• A Precision Agriculture application is presented in [47] that has a decision-making layer on top of the sensor deployment. In this work, the system learns by analyzing logging data from the sensors. Ma-chine learning techniques are used to introduce new rules for water, pesticides, or fertilizers.
• In [48], a real-time feedback system is designed for personal health. The data is collected in real time from mobile sensors on people and sent to a server for analysis. The analysis engine is able to extract information from raw data and give real-time recommendations about certain actions to both the data source and people who share similar patterns in their data.
Chapter 3
SYSTEM OVERVIEW
The goal of this chapter is to give a brief overview of our soil moisture system and the data used in our data-driven approach. Detailed descriptions of the collection and prediction systems are presented in the following chapters.
3.1
System Overview
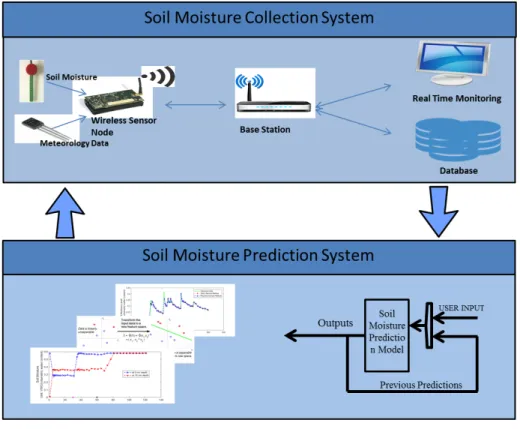
Figure 3.1 shows an overview of the system, which can be separated into two parts: collection and prediction. Using data-driven approaches, solutions in each part address the problems mentioned in the Introduction and are eval-uated using historical data. The design principle is to create frameworks where the system can be configured in a site-specific way and be able to take inputs from other sources. Following the Precision Agriculture decision-making framework in section 2.1, our work provides solutions for each part in the decision-making cycle, from “data collection” to “analysis and decision” and then to “evaluation and revision.” Using our sensor node, the data can be collected and received by the base station for real-time monitoring and data analysis purposes (data collection). We demonstrate that the collected data can be used to provide data pattern insights and train prediction mod-els (analysis and decision). The analysis results on data patterns are then applied back to the collection system for configuring fine-tuned device pa-rameters (evaluation and revision). We believe the same methodology can be applied to designing systems in other areas of agriculture as well. Due to the large data size required by the machine learning algorithms, the field collected data from our sensor node are not used in our prediction experi-ments. However, the two sub systems are connected in the sense that the same soil and environmental attributes are collected and used in collection and prediction, respectively.
Figure 3.1: Proposed soil moisture collection and prediction system In the collection system, a wireless sensor system is designed based on data analysis from the Illinois Climate Network (ICN). The wireless sensor node is prototyped using MicaZ mote [49] and collects soil moisture and other meteorological data. The sensor node is an intelligent reactive device that focuses on collecting soil moisture dynamics data with respect to surrounding environment changes. To address the problems of site-specific and user inputs in Precision Agriculture, the sensor node is programmed using open source platform TinyOS [50] and offers two user-defined variables regulating the level of data granularity and sample intervals. A reliability layer is added on top of the sensor node to increase overall robustness. Our wireless sensor network can be used for applications such as in-field soil moisture collection and other kinds of remote site data collection, since it is specifically designed for applications that require a long lifetime.
In the prediction system, machine learning techniques are applied on 9 different sites across the ICN, and a prediction framework is built on top of the machine learning models to predict soil moisture n days ahead. The models predict the soil moisture value based on meteorological parameters
including temperature, humidity, wind speed, solar radiation, precipitation, and soil temperature together with the previous days’ soil moisture values. The sparse and well-studied machine learning techniques SVM and RVM are applied on the historical data to derive mathematical models. Designed from a Precision Agriculture perspective, the site-specific model is able to incor-porate data from other sources at the granularity of one day. In contrast to soil moisture as studied in hydrology, where variations in soil attributes are caused mainly by environmental changes, cropland is regularly maintained by people. Hence, the variations can come from both meteorologic changes and human interventions. The feature of taking user-provided data at fine granularity makes the system more robust by allowing the model to inter-act with human knowledge or real soil moisture data from other sources. The proposed framework achieves low error rates (15%) and high correla-tions (95%) between predicted values and actual values when forecasting soil moisture about 2 weeks ahead. It should be noted that some factors affect-ing soil moisture, such as leaf area index and root water extraction, are not included in our current work, due to the lack of these data. Depending on the crop type and its growth stage, these types of data vary. Our machine learning method can incorporate these parameters by treating them as new features to improve model accuracy, once these data become available.
3.2
Data Source
The data used in this study are from the Illinois Climate Network (ICN) program, which is one of the main programs under the Illinois State Water Survey (ISWS). ISWS operates as a Division of the Prairie Research Insti-tute of the University of Illinois at Urbana-Champaign. It is responsible for collecting, analyzing and archiving high-quality, objective data related to water sources in Illinois. ICN monitors weather and soil conditions at the 19 locations identified in figure 3.2. Historical data from 1989 to 2012 are available to the public upon request.
The meteorological dataset from ICN consists of data from the 19 auto-mated weather stations scattered across Illinois and maintained by ISWS staff. The weather stations collect temporal weather observations on numer-ous weather variables such as temperature, precipitation, relative humidity,
Figure 3.2: Statewide map of ICN sites
barometric pressure, wind speed, wind direction, and solar radiation. Most sensors are polled every 10 seconds and are averaged by the hour. All the weather data are downloaded to the ISWS database once a day.
The soil-related dataset is formed from 17 sites across Illinois. Most of the soil sites are co-located with one of the 19 weather stations mentioned above. At some sites, data are collected manually from site visits twice a month during the growing season (March to October) and once a month during the rest of the year. At the rest of the sites, the data are collected by sensors placed at different soil depths. The soil moisture data are measured at the site using Stevens Hydra Probe sensors that sample every hour at depths of 2, 4, 8, 20, 39 and 59 inches below the soil surface with accuracy of ± 0.03 vwc. The soil moisture information has a great impact on Illinois agriculture, offering potential insights into water resource management of the state. Also, across the U.S., there are approximately 220 remote sites collecting soil moisture and soil temperature along with precipitation, wind, and solar radiation data. The Soil Climate Analysis Network (SCAN) [51] offers those data to the public upon request, too.
Chapter 4
SOIL MOISTURE COLLECTION SYSTEM
This chapter introduces the design aspect of our wireless sensor network. The goal of this chapter is to provide a detailed description of our soil moisture data collection network with focus on design principles. It begins with an overview of the sensor node, its features and novelty. Then we discuss the design methodology used in the work, followed by descriptions of sensor node flow. We propose that data analysis can be applied to historical data to gain insights into soil moisture at monitoring locations and to create a framework in which the device can be configured to be more site-specific.
4.1
Collection System Overview
Our objective in the collection system is to design and prototype a wireless device that can efficiently collect the soil moisture data and related envi-ronmental data needed for training prediction models in Chapter 6. The prototyped sensor node is composed of environmental sensors and hardware devices from MicaZ platform. It is capable of collecting soil temperature, air temperature, humidity, and soil moisture at different depths. Data analysis is applied on the ICN data to help gain insights into data characteristics and patterns at monitoring locations.
The sensor node is a reactive device that focuses on collecting soil moisture dynamics with respect to changes in surrounding environmental parameters. Based on analysis of the ICN dataset, soil moisture does not change much during most non-rain days. A sampling rate adjustment algorithm is imple-mented and loaded on the hardware to adjust its sample rate according to the difference between previous and current readings. Reactive sensing allows the device to intelligently capture soil moisture dynamics with fine granular-ity while not spending unnecessary energy on sampling and communication
operations. The sensor node is modular and has two user-defined variables, making it a more application-specific device. By setting these two variables, users specify the level of data granularity and sample intervals for the sensor application. Lastly, we add a layer of reliability to the sensor to increase the robustness of the system. Our wireless sensor network can be useful for ap-plications such as in-field soil moisture collection and other remote site data collection applications, since it is specifically designed for applications that require long life and remote site deployment. Compared to previous related work [52, 53, 54, 55], our sensor network has three distinctive features:
• Reactive Sensing extends the lifetime of the system by reactively sensing data based on environment changes.
• Reconfigurable Devices provide a framework in which user-defined variables can be easily used to configure different applications on an open source platform.
• Robustness is achieved by logging accurate data locally in the pres-ence of network loss or power failure in harsh outdoor field conditions.
4.2
Design Methodology
Soil moisture data has been collected for decades in the U.S. Public websites such as the Soil Climate Analysis Network (SCAN) [51] and Illinois Climate Network (ICN) give data to the public upon request. With this huge amount of historical data, the problem becomes how to leverage that data and trans-fer the raw data into useful information.
We take a data-driven approach to gain insight into the data and use anal-ysis results to shorten the development cycle. By analyzing historical data, we are able to gain knowledge about monitoring locations and monitoring subjects. This helps us design the system to be more application-specific and efficient in gathering high-quality data with minimal power consump-tion. Also, there is usually a long iterative process of hardware deployment in which several field tests need to be performed in order to fine tune the hardware parameters. The analysis results also shorten the process of eval-uating the design and tuning hardware parameters.
• Present problems of existing solutions for the data collection process
• Provide insights into interested data characteristics
• Evaluate the effectiveness of sensor-sampling algorithms
The following work provides valuable insights into our hardware design and sensor deployment. In [52], a wireless sensor network has been deployed on buildings for structural health monitoring with high-frequency sampling. The performance of EEPROM flash memory on a Mica node is measured. In [53, 54], MicaZ motes have shown solid performance in collecting data in wild fields. It was found in [56] that, among all the MicaZ operations, transmitting a packet and writing to a flash memory take the most energy per operation. Bogena et al. [55] evaluated a low-cost soil water content sensor (EC-5) for wireless network sensor application. In their work, the sensor node took samples periodically, and the accuracy of the reading was studied given the changes of temperature.
4.3
Reactive Node Design
Our sensor node has three main advantages over previous designs. In this section, we present each advantage in detail.
4.3.1
Reactive Sensing
Power management is one of the most important aspects of wireless sensor networks. The sensor node is embedded hardware with only limited compu-tational power and energy supply. The main contributors to power consump-tion are transmitting packets, writing to memory, and sampling data. In a MicaZ mote, packet transmission and flash write are the top two power con-suming operations. Receiving a packet, transmitting a packet, and writing to flash memory cost about 8 nAh, 20 nAh, and 83 nAh, respectively [54]. Furthermore, in real deployment [55], it is shown that the battery maximum voltage supply starts degrading over time. The performances of sensor and radio transmission are affected when the power supply cannot meet their minimum requirements.
To extend the lifetime of a sensor node, it should be in sleep mode as long as possible. The power management in MicaZ allows the hardware to
alternate between activity and sleep mode. The power draw in active mode is 5 to 20 mA, while the sleep mode only draws 5 µA [55]. The sleep mode can significantly reduce power consumption by moving the microcontroller into lower power states and only keeping a few necessary components, such as the clock, in a functional state.
A sampling rate adjustment algorithm is implemented and loaded on the hardware to adjust sensing frequency based on soil moisture readings. Un-like other sensor applications in which the sensor samples at a high frequency (several samples per second), the soil moisture content in a wild field does not change much on an hourly basis, especially in non-rainy days. Hourly sampling is a waste of energy and adds no value to the collected information. A sample frequency adjustment algorithm is implemented on the sensor node to make the hardware collect data more intelligently and efficiently. Since our sampling decision algorithm runs on embedded systems, the algorithm should be straightforward and simple. In our design, the decision of whether to adjust the sample frequency is based on the difference between previ-ous readings and current readings. If the difference exceeds some pre-set threshold, it is likely a rainy period at monitoring locations. In response, the sample intervals are exponentially decreased to a much shorter sample window to capture the variations. Once the soil moisture readings become stable, the sample intervals start to increase linearly until the maximum sam-ple interval is reached. More detail on the algorithm is covered in section 4.4.
4.3.2
Reconfigurable Devices
A trade-off exists between obtaining high-resolution data and having an energy-efficient and sustainable sensor network. Obtaining high-resolution data requires hardware to take samples, perform computation, and trans-mit packets at short intervals and thus takes more energy. Depending on the particular situation at a real deployment site and the monitoring goal, the requirements for the monitoring period and the data granularity can be quite different. For example, if the sensor system is used for experiments on soil properties in a lab setting where environmental parameters such as temperature are manipulated by people, a higher resolution of soil properties
is needed for accurate analysis. However, if sensors are deployed on a remote island for a years-long monitoring project, the importance of system lifetime outweighs the importance data resolution. As a result, the system should be flexible for various applications and be site-specific according to the concept of Precision Agriculture.
In our design, users can create a more customized, site-specific sensor node to better meet individual application requirements and goals. To achieve that, users need to specify two variables: maximal sample interval and level of granularity. Themaximal sample interval is the largest sample rate that a node can hold. By default, if the soil moisture values stay the same, sensors continuously monitor soil at the maximal sample interval rate. The level of granularity specifies the threshold value, which triggers the sampling rate adjustment algorithm in the reactive sensing part. It can be understood as the level of sensor sensitivity to environmental changes. The lower the
level of granularity, the more often the sample rate adjustment algorithm can be triggered and the more samples taken. These two variables let the users use their knowledge of the monitoring target and goal to create an application that meets their needs. The TinyOS platform is used for software implementation. The open source feature of the platform makes the porting of code much easier. After specifying those two variables, a more customized TinyOS image can be compiled and installed onto the mote.
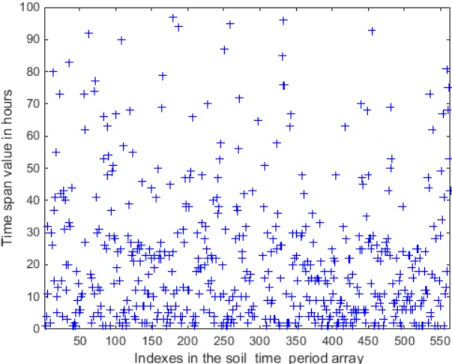
The introduction of the two user-specified variables allows the sensor node to incorporate inputs from data analysis or expert knowledge. For instance, historical data can be used to determine optimal values for monitoring soil moisture at the ICN DeKalb site. It is observed that the hourly soil moisture values at 5 cm, 10 cm, and 15 cm do not vary much most of the time at the station and only change rapidly if there is precipitation. Figure 4.1 shows the distributions of time periods that soil moisture values at depth 5 cm take to have a variation greater than 0.04 vwc. The analysis examines the data in chronological order by checking if the current soil moisture value varies from the baseline value by more than 0.04 vwc. If so, the time span between the two values is added to the end of soil time period array. The baseline value is initialized to the first data point in the dataset and is refreshed to the cur-rent value every time new time span data is added to thesoil time period ar-ray. The analysis is based on 2 years data—2*365*24=17,520 data entries— collected from the ICN DeKalb station, which provided hourly soil moisture
Figure 4.1: Soil moisture at 5 cm depth with level granularity 0.04 data. The mean of distribution is 44 hours, and most points are located at a 10-30 hour range, as shown. Compared to locations with frequent rain, the sample interval at DeKalb can be set to about 10-20 hours instead of 2 or 4. By extending the sample frequency from 2 and 4 hours to 12 and 16 hours, the lifetime of the sensor node can be significantly extended. Statis-tical methods such as linear interpolation and reactive sensing can further compensate for the loss of data granularity.
4.3.3
Robustness
In the process of data collection, the robustness of the wireless system can be affected by many factors. We categorize two main sources of impact on the overall robustness of the system: embedded devices and the wireless communication link.
Embedded systems (sensor node and sensor) are unreliable and error-prone due to their hardware computational constraints. When deployed in a remote area, the sensor node needs to withstand the harsh outdoor environment and maintain its power. It is common for sensor nodes to shut down due to
battery depletion. The data stored in volatile memory cannot survive the power cycle and are lost once the sensor node is shut down. Also, errors can be introduced into the data when samples are read. In practice, the sensor hardware, especially analog hardware, tends to give an inaccurate sample reading in its first use after long hours of inactivity. Inaccurate sensor reading hurts the accuracy of data modeling and of future analysis. The data error is hard to detect in the dataset and must be addressed from the source.
To prevent errors or inaccurate data readings from propagating to the analysis dataset, the sensor node is programmed to perform three consecutive sensor readings for each sample operation. The last reading of the sensor is considered the “accurate” reading and sent to base station. Based on our observations of sensor readings, we decided to program the sensor node to read three times, but the number of readings can be easily changed depending on the situation.
Wireless communication is unreliable and likely to lose data as well. In order to receive messages from the sensor node, the base station needs to be present and to remain in listening mode. Even with the presence of the base station, a sent message can also be lost during communication and fail to reach base station. The quality of the wireless link depends on environmental factors, such as air moisture level, but also on overall message traffic. In experiments on large-scale sensor networks, the loss rate usually worsens due to message conflicts at the base station.
We use a base station message acknowledgment mechanism from the RF chip, together with local EEPROM flash memory, to increase the system ro-bustness. EEPROM is a configurable, non-volatile flash memory on MicaZ mote that is able to preserve the data with the power cycle of the sensor node. The MicaZ mote has about 4 Kbyte of EEPROM memory and can permanently store up to hundreds of data entries. When a message is re-ceived at the base station’s transceiver end, the base station sends out an acknowledgment message to indicate the message has been successfully de-livered. If the acknowledgment message is not received within a certain time window, the sensor node logs the message into EEPROM flash. There are two common approaches to deal with message delivery failures: either re-send the message immediately or store the data locally. We choose the second ap-proach, since we assume the distribution of sensor nodes is sparse. Message delivery failures should be rare and are most likely due to absence of a base
station. Work in [12] uses EEPROM as a backup storage device, and sensor nodes log each sent message. Compared to that approach, our design is more energy-efficient. It has been shown that writing to flash is more expensive in terms of energy cost than transmitting a packet. The operation of flash writing should be performed only as needed.
Our sensor node is also able to perform properly as a logger alone, because of local EEPROM flash memory. Soil moisture loggers are often used in agriculture to log the events periodically, and real-time monitoring is not required.
4.4
Work Flow
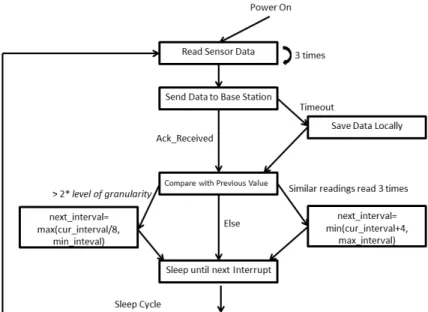
Figure 4.2 illustrates the work flow of the sensor node. Most of the time, the sensor node stays insleepmode. When a timer interrupt happens, the sensor node first takes three consecutive readings from the data acquisition board on the analog ports. The last reading is set as the final reading. Data are packed into one message with the event timestamps and node ID. The sensor node sends the message to the base station and waits for the acknowledgment
signal. If the acknowledgment is not received within a certain time, the message is written to the flash memory for logging. If the acknowledgment is received, the sensor node moves on to the reactive sampling algorithm section.
4.4.1
Reactive Sampling Algorithm
The reactive sampling algorithm checks whether the sample interval should be adjusted. If in the latest 3 readings, all the values are within the level of granularity specified by the user, the sample interval is increased by 4 until it exceeds the maximal sample interval. If the difference between the previous and current readings is greater than 2 * level of granularity, the sample interval is shortened to one eighth of the current sample interval. Reactive sampling ensures that when a rapid change is detected, the system is able to sample at much shorter intervals. This increases the chances that interesting data is sampled. An evaluation of the algorithm is presented in the next chapter to test its performance on real collected data.
Reactive sampling does not guarantee that all the soil moisture fluctuation will be captured, but it increases the chances. The intuition behind reactive sampling is that when soil moisture varies, it is likely raining or during a rainy period that can last a few days. Reactive sampling does not work in the event of a sudden but short rain storm. Depending on the real deployment scenarios and requirements, the algorithm parameters can be further tuned. Another possible solution is to integrate the barometer sensor readings into the algorithm. Barometer sensor readings can serve as an indication of rain likelihood and trigger the sample intervals to change. A barometer sensor is available in our sensor node platform and can be studied in further work.
Chapter 5
SYSTEM IMPLEMENTATIONS AND
EVALUATION
In this chapter, the sensor node’s hardware components and software imple-mentations are presented. First, the hardware platform and sensors used in this work are introduced, followed by a detailed description of the software application installed. At the end, demonstration results on the functional-ity of the sensor network and the effectiveness of our reactive algorithm are presented.
5.1
Hardware System
5.1.1
Hardware Platform
Aside from basic functionality, we mainly consider two aspects when se-lecting proper wireless hardware platform on which to build a sensor node: (1) peripheral hardware supports and (2) software supports. The following hardware components are chosen as our sensor hardware platform:
• Crossbow MicaZ is used as our sensor node platform and programmed in NestC. MicaZ Mote is designed specifically for deeply embedded sensor networks and operates in the 2.4 GHz ISM band. The node is compliant with IEEE 802.15.2 with 250kbps data rate [49]. It is based on Atmel AT-mega128L low-power microcontroller and can be configured to run sensor application processing and a network communication stack simultaneously. The communication range is estimated at around 75m to 100m outdoor and 20m to 30m indoor [49].
• MDA300CA Data Acquisition Board [57] is used to collect analog readings from the sensor. MDA300CA is a multi-function data acquisition board with temperature and humidity sensors. It can be used as an interface
board between sensor and mote in various sensing applications. The hard-ware provides 2.5 V, 3.3 V, and 5 V excitation voltages to external sensors. There are 7 single-end ADC channels on the MDA300CA, which provides a sensor reading resolution of 12 bits. Signals with dynamic range of 0 to 2.5 V can be plugged into these channels. The formula to convert readings to voltage is as follows:
V oltage= 2.5∗ ADC READIN G 4096
• MIB520CB [58] board is used as the base station and USB programming board. MIB520CB provides a USB interface to a PC, allowing data on the mote to be sent to a PC via serial port. To program the mote, it needs to be mounted on the MIB520CB via a 51-pin connector before a TinyOS image can be installed on it. MIB520CB can also act as an interface between a PC and a base station node. When doing data collection, MIB520CB can send the data from the mote to the PC in real time.
MSP430 Launchpad [59] from Texas Instruments (TI) is considered as a possible sensor node. MSP430 Launchpad is a popular microcontroller eval-uation kit from TI for use in prototyping design. One additional radio chip needs to be mounted on top of the evaluation kit to enable wireless commu-nication. However, MSP430 products from TI are not officially supported by the TinyOS system, and porting requires much effort. Unlike writing in TinyOS, which provides relatively high-level abstraction of the sensor com-ponent and radio, developers of Launchpad need to obtain detailed low-level hardware knowledge specific to Launchpad in order to program the board. Also, the supply power voltage Vcc from Launchpad is 3.6 V, which is below the minimum voltage required by our soil moisture sensor.
Another candidate sensor node is Waspmote [60] developed by Libelium. Waspmotes are commercial-use sensor nodes designed for real world appli-cations. Libelium offers more than 70 sensors that can be integrated with Waspmote for various sensing applications. However, we chose MicaZ over Waspmotes because the latter is proprietary hardware and more expensive than the MicaZ hardware platform.
One advantage of using MicaZ is that it is officially supported by the TinyOS system and a power management system is provided. Power
con-sumption is an important factor when building a sensor node. Unlike other sensor nodes that sample at a high frequency, our application only requires taking samples hourly. Thus, power management is essential to ensure that the wireless radio chip, microcontroller, and sensor devices are in the sleep
mode most of the time.
The TinyOS platform offers modules such as basic scheduler and MCUSleep to help manage the power states of a microcontroller and other devices auto-matically. Microcontrollers often have several power states, each with partic-ular rules to determine the on/off state of several components. For example, the MSP430 microcontroller turns off ADC components at LPM3 mode. Mi-crocontrollers should always be in the lowest possible power state that can fulfill the application requirements.
The basic principles of those power management modules are to estimate incoming tasks based on the task queue and other conditions. Every time a microcontroller handles an interrupt, the scheduler moves the state to ac-tive. However, if the task queue is empty, radio is off, and SPI interrupt is disabled, the scheduler moves the mote into sleep mode by moving the microcontroller into one of the low-power states. With the help of power management modules in TinyOS, the lifetime of the WSNs can be greatly increased.
5.1.2
Sensors
The following sensors are used in our soil moisture sensor node to collect various types of data:
• Temperature and Humidity Sensor
The temperature and humidity sensor Sensirion SHT11 is included on the MDA300CA sensor board. It measures relative humidity (RH) with a resolution of 0.03 RH and accuracy of +-3.5% RH. The temperature sensor has a measurement range of -40◦C to 123.8◦C with a resolution of 0.01◦C and accuracy of +- 0.5◦C at 25◦C.
• Soil Moisture Sensor - VH400 [61]
To collect soil moisture data, VH400 Soil sensor, a low-cost sensor probe, is used. It measures volumetric water content (vwc) and outputs a voltage
proportional to the moisture level. Since the probe measures the dielectric constant of soil using a transmission line, it is insensitive to water salinity and will not corrode over time. The sensor can be used in irrigation and sprinkler systems, moisture monitoring, water conservation, etc.
The VH 400 takes supply voltages 3.5 V to 20 V DC and outputs related moisture content from 0 to 3 V. When activated, the senor consumes less than 7mA current, which is perfect for a low-power, embedded system. To convert the ADC reading value to vwc, we used the formula above, from the sensor datasheet. The curve can be approximated with four linear segments: SoilM oisture(vwc) = 10∗V −1, if 0< V oltage≤1.1 25∗V −17.5, if 1.1< V oltage≤1.3 48.08∗V −47.5, if 1.3< V oltage≤1.82 26.32∗V −7.89, if 1.82< V oltage≤2.2
• Soil Temperature Sensor Probe - THERM200 [62]
To obtain the soil temperature, a THERM200 soil temperature sensor probe is used. THERM200 is a soil temperature probe that has a temper-ature span from -40◦C to 85◦C. It outputs a voltage linearly proportional to the temperature to calculate the temperature from voltage. It is highly accurate with a 0.125◦C resolution. THERM200 is compatible with data loggers and other wireless sensor applications.
The sensor is powered from 3.6 V to 20 V DC and outputs a voltage of 0 to 3 V, where 0 represents -40◦C and 3 V represents 85◦C. To convert the ADC reading value to soil temperature, the following formula is used from the datasheet with unit of ◦C:
5.1.3
Hardware Configuration
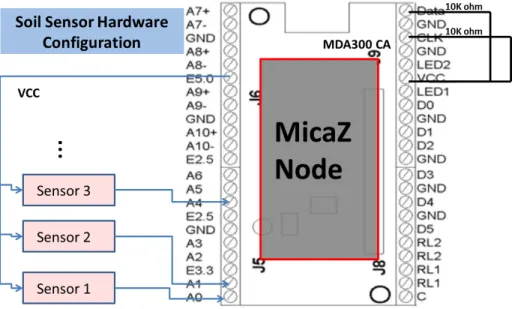
Figure 5.1 illustrates the hardware configuration of a single sensor node in which the MicaZ mote is mounted on top of the MDA300CA data acquisition board. Up to 7 sensors can be connected to the analog ports of MDA300CA. To enable the data bus of I2C, two 10 kΩ resistors are needed to connect the pin DATA with VCC and pin CLK with VCC, as shown in the figure.
Figure 5.1: Hardware configuration of soil moisture sensor node
5.2
Software System
5.2.1
System Environment
The application is written in NesC under the TinyOS 2.x environment. TinyOS and its programming language NesC are specifically designed for em-bedded systems such as wireless sensor networks. They support event-driven concurrency mode and use modular, inference-driven design. The modular or component design provides a mechanism for structuring, naming, and link-ing software components into a robust embedded system. Each component provides and uses interfaces that are the access points of that component. The bidirectional interface declares a set of functions that can be categorized
into two types: commands and events. A command is a type of a function that an interface provider must implement, and an event is a function that the user must implement. The modular components provide a higher level of abstraction of hardware management and serve as basic building blocks for specific applications. This open-source feature gives the applications more flexibility and lets the developers create more complex designs.
5.2.2
Software Implementation
From a high-level view, each module used in our application can be catego-rized as being one of four types: Sensing, Wireless Communication, Control Unit, or Logging Unit. Figure 5.2 illustrates components and their interface functions used in each category.
SensorMDA300 and LogStorage components are used for sensing and log-ging purposes. SensorMDA300-implemented functions read the analog and digital readings at specific ports and return readings in hex format. Since the sensors draw power directly from the sensor node battery, the on/off state of the 5 V supply power line is controlled by the software via the power com-mands interface as well. LogStorage abstraction supports reliable (atomic) logging of events so as to survive the hardware power cycle. In our applica-tion, circular logging is used; that is, when storage is full, the least recently written data can be overwritten by new data.
Control Units are responsible for overall internal logic between compo-nents, such as scheduling the tasks and controlling the interrupt timing. At boot-up, the system will first initialize the scheduler, then it will initiate various other components, including timing and sensing units. A signal with error code is sent to the scheduler once the system has booted up. For the wireless communication part, AMsendC is used to send packets, and Ac-tiveMessage is used for the acknowledgment mechanism and split control.
5.3
Evaluation
In this section, the experimental results of our sensor node are presented from both the hardware functionality and the effectiveness of reactive sensing aspects. A real experiment on the soil was performed to test the functionality
Figure 5.2: Software configuration of soil moisture sensor node of the sensor node and responsiveness of soil moisture sensors. As expected, the sensor node is able to collect data at different soil depths (5 cm and 10 cm), and the soil moisture sensors are responsive to changes in soil moisture values. A second experiment was conducted on an ICN network dataset to evaluate the effectiveness of the sensing algorithm. Three years of hourly soil moisture data (around 24*365*3=26,280) from the DeKalb station were applied to show that our algorithm can improve the energy efficiency and still capture the dynamics of soil moisture in a timely manner.
5.3.1
Testing in the Soil
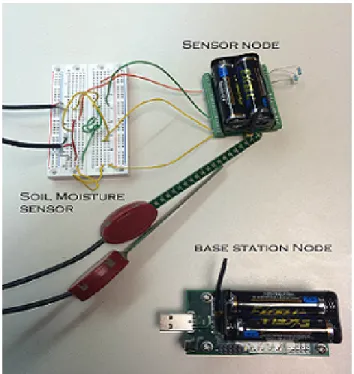
An experiment was conducted on the field soil to test the responsiveness of our sensor and functionality of the sensor network. In the experiment, two VH400 soil moisture sensors were attached to the sensor node, as shown in figure 5.3, and buried completely under the ground surface at 5 cm and 10 cm depths. The soil sample was taken from an open corn field and transferred to a bucket container. The hardware was configured such that the maximal sample interval was 40 seconds and the granularity level was 0.08 vwc. The adjustment of the sampling interval was based on the reading at the 5 cm depth. At each iteration, the data were read once instead of three times before being sent to the base node. This was done to show that errors can
Figure 5.3: Physical appearance of the sensor node
occur during sensor power-on stage. A Java program was running on a PC concurrently to receive raw data from the base node. The job of the Java program was to take hex ADC data, parse the hex value, convert to the proper units and write to a log file in real time. The experiment lasted an hour in a lab setting, and results are shown in figure 5.4.
The red line (star) represents the soil moisture readings at 10 cm, and the blue line (circle) represents the readings at 5 cm. The first readings from both sensors are errors due to sensor warm-up stages. Such errors should not occur once the sensor takes three conservative readings before sending data to the base station. At point 30 (indicted by magenta diamond), a small volume of water was poured into the bucket. At point 60 (indicated by black upward-pointing triangle), a large volume of water was poured into the bucket.
The sensor node was able to collect data at different depths and reactively adjust the sampling interval. When the small volume was poured into the bucket, only the soil at 5 cm depth was saturated with water, and soil mois-ture at 10 cm stayed at the same level. When a large volume was applied, the soil at both levels got saturated. On the 5 cm depth line, the frequency of sampling increases at times 5 and 35, due to our reactive algorithm.
Figure 5.4: Sensor node performance on soil bucket
5.3.2
Evaluation at Historical Data Set
Historical data from the DeKalb station were used for evaluating the effec-tiveness of the reactive sampling algorithm in open-field soil moisture col-lection. The data were real soil moisture data at depth 5 cm from 2009 to 2011, containing 17,520 data entries at a per-hour granularity. The results show that the reactive sampling algorithm is able to effectively collect soil moisture dynamics.
Two static sample intervals and our reactive sampling algorithm were ap-plied and compared on the same dataset to check their performance on cap-turing soil moisture changes. In method 1, a reactive sampling algorithm was used with the maximal sample interval set to 12 hours, and the level of granularity set to 0.03 vwc. In methods 2 and 3, the samples were taken every 12 hours and 4 hours, respectively. For each new data sample, we com-puted the difference between the new sample value and its previous value and then compared it with the level of granularity value. For each run of a specific method, the number at the respectiveGranularity Distance field was increased by one on each sample iteration. Granularity Distance is defined in the following formula. For example, if the difference between two consecutive readings is within the level of granularity, the Granularity Distance is 0.
Granularity Distance=babs(new sample value−previous value)
level of granularity c

![Figure 2.1: Precision Agriculture decision making cycle [18]](https://thumb-us.123doks.com/thumbv2/123dok_us/9944358.2487256/14.918.278.639.108.422/figure-precision-agriculture-decision-making-cycle.webp)
![Figure 2.2: Wireless sensor node structure [36]](https://thumb-us.123doks.com/thumbv2/123dok_us/9944358.2487256/18.918.227.693.109.444/figure-wireless-sensor-node-structure.webp)