colloids
and interfaces
Review
Thickness and Structure of Adsorbed Water Layer and
E
ff
ects on Adhesion and Friction at
Nanoasperity Contact
Chen Xiao1, Pengfei Shi1, Wenmeng Yan1, Lei Chen1,*, Linmao Qian1and Seong H. Kim1,2 1 Tribology Research Institute, Key Laboratory of Advanced Technology of Materials, Ministry of Education,
Southwest Jiaotong University, Chengdu 610031, China
2 Department of Chemical Engineering and Materials Research Institute, The Pennsylvania State University, University Park, PA 16802, USA
* Correspondence: [email protected]; Tel.:+86-159-8213-9010
Received: 30 June 2019; Accepted: 2 August 2019; Published: 6 August 2019
Abstract:Most inorganic material surfaces exposed to ambient air can adsorb water, and hydrogen bonding interactions among adsorbed water molecules vary depending on, not only intrinsic properties of material surfaces, but also extrinsic working conditions. When dimensions of solid objects shrink to micro- and nano-scales, the ratio of surface area to volume increases greatly and the contribution of water condensation on interfacial forces, such as adhesion (Fa) and friction
(Ft), becomes significant. This paper reviews the structural evolution of the adsorbed water layer
on solid surfaces and its effect onFa andFt at nanoasperity contact for sphere-on-flat geometry.
The details of the underlying mechanisms governing water adsorption behaviors vary depending on the atomic structure of the substrate, surface hydrophilicity and atmospheric conditions. The solid surfaces reviewed in this paper include metal/metallic oxides, silicon/silicon oxides, fluorides, and two-dimensional materials. The mechanism by which water condensation influencesFais discussed
based on the competition among capillary force, van der Waals force and the rupture force of solid-like water bridge. The condensed meniscus and the molecular configuration of the water bridge are influenced by surface roughness, surface hydrophilicity, temperature, sliding velocity, which in turn affect the kinetics of water condensation and interfacialFt. Taking the effects of the thickness and
structure of adsorbed water into account is important to obtain a full understanding of the interfacial forces at nanoasperity contact under ambient conditions.
Keywords: water adsorption; water condensation; molecular configuration; adhesion force; friction force
1. Introduction
Understanding interfacial properties of water adsorbed on/at solid surfaces is a central theme across many scientific disciplines [1,2]. Adsorption of water from the surrounding environment onto solid surfaces is inevitable unless the surface is chemically inert or its surface energy is extremely low. The extent of adsorption plays a crucial role in a broad range of industrial processes, such as microelectromechanical systems, nanomanufacturing, heterogeneous catalytic reactions, electronic devices/sensors, nanomechanics, and lubrication [3–6]. Indeed, water condensation causing high interfacial forces, such as adhesion (Fa) and friction (Ft), is a serious problem in micro/nanomaterial
engineering when the surface-to-volume ratio becomes significantly large and the surface properties dominate the material performance [7–9].
Water adsorption on solid surfaces is governed by the subtle balance between water-water hydrogen-bonding (H-bonding) and water-solid H-bonding as well as dispersive interactions governed
Colloids Interfaces2019,3, 55 2 of 31
by Lifshitz theory. These interactions determine the molecular configuration of water molecules in the adsorbed layer. The structure of the adsorbed water layer on a solid surface has been analyzed with various spectroscopic techniques and molecular dynamics (MD) simulations [10–13] and found to be quite different from bulk water (or liquid water). For instance, the structure of the adsorbed water layer is determined by the extension of water-solid interactions from the interior to the exterior of the surface. If a solid surface is hydrophilic, strong interactions between the solid surface and water molecules may result in the formation of a strongly H-bonded water layer, also denoted as ordered water, solid-like water, ice-like water, or quasi-ice, in the adsorbed layer [10]. Water condensation around nanoasperity contacts varies with not only the intrinsic properties of the contacting surfaces (e.g., atomic structure, dangling bond, wettability, chemical activity, and surface roughness), but also the working conditions (e.g., temperature, humidity, sliding velocity, and atmosphere) (Figure1) [14–16]. Apart from the amount of adsorbed water, the structure of the adsorbed water layer also plays a significant role in interfacial forces at the nanoasperity contact, especially under ambient conditions.
Colloids Interfaces 2019, 3, x FOR PEER REVIEW 2 of 30
Water adsorption on solid surfaces is governed by the subtle balance between water-water hydrogen-bonding (H-bonding) and water-solid H-bonding as well as dispersive interactions governed by Lifshitz theory. These interactions determine the molecular configuration of water molecules in the adsorbed layer. The structure of the adsorbed water layer on a solid surface has been analyzed with various spectroscopic techniques and molecular dynamics (MD) simulations [10–13] and found to be quite different from bulk water (or liquid water). For instance, the structure of the adsorbed water layer is determined by the extension of water-solid interactions from the interior to the exterior of the surface. If a solid surface is hydrophilic, strong interactions between the solid surface and water molecules may result in the formation of a strongly H-bonded water layer, also denoted as ordered water, solid-like water, ice-like water, or quasi-ice, in the adsorbed layer [10]. Water condensation around nanoasperity contacts varies with not only the intrinsic properties of the contacting surfaces (e.g., atomic structure, dangling bond, wettability, chemical activity, and surface roughness), but also the working conditions (e.g., temperature, humidity, sliding velocity, and atmosphere) (Figure 1) [14–16]. Apart from the amount of adsorbed water, the structure of the adsorbed water layer also plays a significant role in interfacial forces at the nanoasperity contact, especially under ambient conditions.
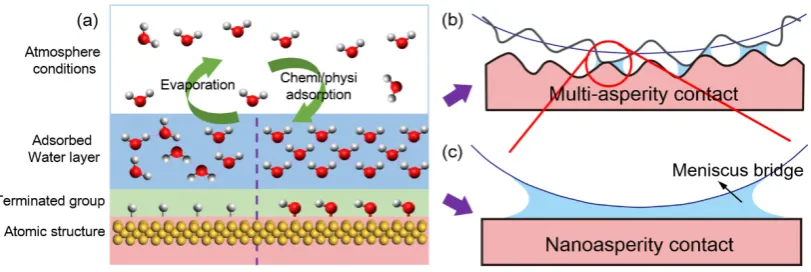
Figure 1. (a) The molecular configuration of adsorbed water layer on solid surfaces is governed by atomic structure of substrates, terminated groups on solid surfaces, and atmosphere conditions. A dynamic equilibrium exists in adsorbed water layer on solid surfaces with continuous evaporation and chemi/physi adsorption. (b,c) Schematically showing meniscus bridge formation at contacting and near-contacting asperities at multi-asperity contact and at single nanoasperity contact, which strongly affects the interfacial forces (i.e., adhesion force and friction force). The single-asperity contact in (c) is also regarded as a microscopic prospective of the multi-asperity contact in (b).
This review focuses on water adsorption behaviors on solid surfaces and their effects on Fa and Ft at nanoasperity contacts for a sphere-on-flat geometry. The influences of surface structure and
chemistry as well as atmosphere conditions on water adsorption behaviors on metal/metallic oxides, Si/Si oxides, fluorides, two-dimensional (2D) materials, and other material surfaces are summarized. The changes in the kinetics of water condensation due to these factors and their effects on interfacial forces at the nanoasperity contact, including Fa and Ft, are discussed.
2. Water Adsorption on Solid Surfaces
2.1. Effect of the Surface Atomic Structure on Water Adsorption
The unique properties of water in the liquid state stem largely from its dipole moment and H-bonding capability [17,18]. When water is adsorbed on solid surfaces, interactions with the solid surface cause its properties to deviate from that of liquid water [19,20]. One of the most typical characteristics of adsorbed water is that an ordered structure can exist on some solid surfaces due to strong hydrogen-bonded interactions between the water molecules and substrate atoms [13,21]. Using ultrafast electron crystallography with a spatial resolution of 0.01 Å, Ruan et al. [22,23] measured the structures and dynamics of interfacial water on Cl- and H-terminated Si(111) surfaces
Figure 1. (a) The molecular configuration of adsorbed water layer on solid surfaces is governed by atomic structure of substrates, terminated groups on solid surfaces, and atmosphere conditions. A dynamic equilibrium exists in adsorbed water layer on solid surfaces with continuous evaporation and chemi/physi adsorption. (b,c) Schematically showing meniscus bridge formation at contacting and near-contacting asperities at multi-asperity contact and at single nanoasperity contact, which strongly affects the interfacial forces (i.e., adhesion force and friction force). The single-asperity contact in (c) is also regarded as a microscopic prospective of the multi-asperity contact in (b).
This review focuses on water adsorption behaviors on solid surfaces and their effects onFaand
Ftat nanoasperity contacts for a sphere-on-flat geometry. The influences of surface structure and
chemistry as well as atmosphere conditions on water adsorption behaviors on metal/metallic oxides, Si/Si oxides, fluorides, two-dimensional (2D) materials, and other material surfaces are summarized. The changes in the kinetics of water condensation due to these factors and their effects on interfacial forces at the nanoasperity contact, includingFaandFt, are discussed.
2. Water Adsorption on Solid Surfaces
2.1. Effect of the Surface Atomic Structure on Water Adsorption
Colloids Interfaces2019,3, 55 3 of 31
molecules adsorbed at the Cl interface are undissociated. Compared with those on H-terminated surfaces, the interactions of water with Cl-terminated Si(111) are relatively stronger because of electrostatic contributions [24]. These interactions explain why the ordered structure of water forms on Cl-terminated Si(111) but not on the H-terminated Si surface. Using scanning tunnel microscope (STM), a self-assembled molecular water monolayer with a long-range order structure was shown to form on a TiO2anatase (101) surface without any other termination groups [25].
Colloids Interfaces 2019, 3, x FOR PEER REVIEW 3 of 30
and observed the coexistence of ordered water and crystal-like ice structures on Cl-terminated surfaces at a cryogenic temperature (Figure 2). The analysis of surface diffraction features indicates that water molecules adsorbed at the Cl interface are undissociated. Compared with those on H-terminated surfaces, the interactions of water with Cl-terminated Si(111) are relatively stronger because of electrostatic contributions [24]. These interactions explain why the ordered structure of water forms on Cl-terminated Si(111) but not on the H-terminated Si surface. Using scanning tunnel microscope (STM), a self-assembled molecular water monolayer with a long-range order structure was shown to form on a TiO2 anatase (101) surface without any other termination groups [25].
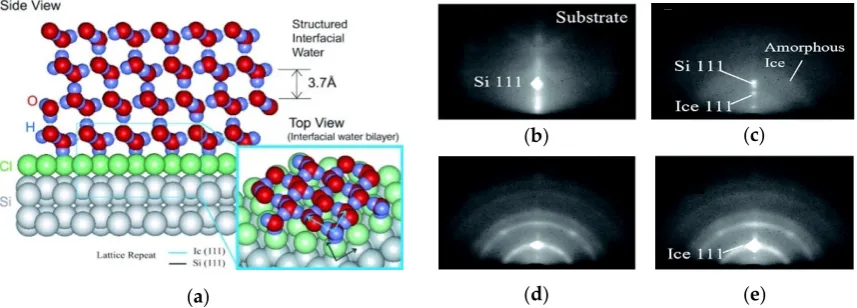
Figure 2. (a) Schematic illustrating the structural water adsorbed on the Cl-terminated Si(111) surface. This ordered water film structure lasts up to three to four layers and forms crystalline islands. (b–e) showing the evolution of in situ growth of ordered ice water on the Cl-terminated silicon surface at a cold temperature of 110 K. The adsorption of water on the substrate can be seen from the disappearance of 111 silicon Bragg points (b) and the formation of 111 crystal ice Bragg points, along with the diffraction ring of amorphous ice (c). The structure is stable when the rings, spots and fringes are almost unchanged as diffraction shows (d,e). Reprinted from Ref. [22,23], Copyright 2004, with permission from Science.
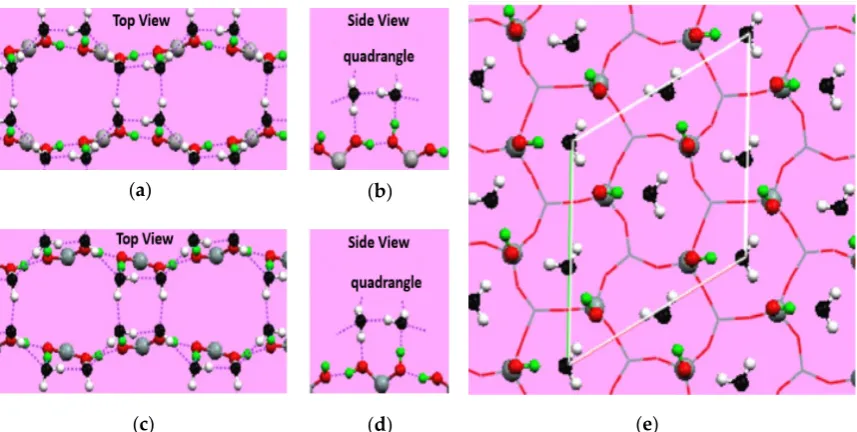
Both the structural and dynamic properties of the adsorbed water layer depend on the atomic-scale geometry and chemical properties of solid surfaces [26]. For example, the structure of water adsorbed on Cu(110) is a quasi-one-dimensional (1D) chain. However, the adsorbed water on Cu(111) behaviors a three-dimensional (3D) hexagonal structure. Moreover, 2D overlayers with mixtures of pentagons and heptagons were observed on Pt surfaces, but no uniform 2D ice layer has been detected [27–30]. Another example is water-silica interfaces, which are probably one of the most extensively studied systems [31–35]. Based on density functional theory and MD simulations, a well-ordered 2D structure with quadrangular and octagonal patterns of H-bond networks, also known as an ice tessellation, is expected to form on a β-cristobalite(100) surface due to strong H-bond interactions between water molecules and geminal silanol groups (Figure 3a). In contrast, only isolated water molecules would exist on β-cristobalite(111) surfaces because silanol groups on this surface do not interact with each other (Figure 3b) [36]. This surfacial atomic structure dependence of water adsorption is also found on other solid surfaces. Zhang et al. [37] investigated the adsorbed water film on 111 and 100 crystal surfaces of calcium fluorite (CaF2) using MD
simulations and sum frequency generation (SFG) vibrational spectroscopy; they reported that a gap exists between surface fluoride ions and interfacial water molecules in the (111) surface (Figure 4a). This surface is modestly hydrophobic with a water contact angle of ~20°. By contrast, the (100) surface is hydrophilic, has a zero contact angle, and is fully hydrated by water molecules (Figure 4b). Up to three water layers can interact with the (100) surface, whereas only two water layers interact with the (111) surface. These studies show that the different atomic structures or termination groups of solid surfaces not only affect the structure and morphology of the adsorbed water layer, but also change the hydrophobicity.
(b) (c)
(d) (e)
(a)
Figure 2.(a) Schematic illustrating the structural water adsorbed on the Cl-terminated Si(111) surface. This ordered water film structure lasts up to three to four layers and forms crystalline islands. (b–e) showing the evolution of in situ growth of ordered ice water on the Cl-terminated silicon surface at a cold temperature of 110 K. The adsorption of water on the substrate can be seen from the disappearance of 111 silicon Bragg points (b) and the formation of 111 crystal ice Bragg points, along with the diffraction ring of amorphous ice (c). The structure is stable when the rings, spots and fringes are almost unchanged as diffraction shows (d,e). Reprinted from Ref. [22,23], Copyright 2004, with permission from Science.
Both the structural and dynamic properties of the adsorbed water layer depend on the atomic-scale geometry and chemical properties of solid surfaces [26]. For example, the structure of water adsorbed on Cu(110) is a quasi-one-dimensional (1D) chain. However, the adsorbed water on Cu(111) behaviors a three-dimensional (3D) hexagonal structure. Moreover, 2D overlayers with mixtures of pentagons and heptagons were observed on Pt surfaces, but no uniform 2D ice layer has been detected [27–30]. Another example is water-silica interfaces, which are probably one of the most extensively studied systems [31–35]. Based on density functional theory and MD simulations, a well-ordered 2D structure with quadrangular and octagonal patterns of H-bond networks, also known as an ice tessellation, is expected to form on aβ-cristobalite(100) surface due to strong H-bond interactions between water molecules and geminal silanol groups (Figure3a). In contrast, only isolated water molecules would exist onβ-cristobalite(111) surfaces because silanol groups on this surface do not interact with each other (Figure3b) [36]. This surfacial atomic structure dependence of water adsorption is also found on other solid surfaces. Zhang et al. [37] investigated the adsorbed water film on 111 and 100 crystal surfaces of calcium fluorite (CaF2) using MD simulations and sum frequency generation (SFG)
Colloids Interfaces2019,3, 55 4 of 31
Colloids Interfaces 2019, 3, x FOR PEER REVIEW 4 of 30
Figure 3. Water adsorption on different crystallographic planes obtained in molecular dynamics
(MD) simulations. (a) Adsorbed water structure on two different adsorption sites of the
β-cristobalite(100) surface, i.e., the bridge site of two adjacent vicinal hydroxyl groups (a,b) and that of two adjacent geminal silanols (c,d). The water molecules have been colored with black oxygen and white hydrogen to distinguish from the hydroxyl groups on the surface (colored dark gray and light grayd). (e) Adsorbed water structure on the β-cristobalite(111) surface. Reprinted from Ref. [36], Copyright 2005, with permission from APS publications.
(a) (b)
Figure 4. MD simulation snapshot of the equilibrium configuration of water molecules at fluorite (111) surface (a) and (100) surface (b) (green: fluorine; cyan: calcium). Reprinted from Ref. [37], Copyright 2015, with permission from ICE Virtual Library.
2.2. Effect of Surface Wettability on Water Adsorption
In generally, surface wettability (hydrophilicity/hydrophobicity) is assessed by the contact angle of a water droplet [38]. The water contact angle on a highly hydrophilic surface may be as low as nearly zero and rises with the hydrophobicity of the solid surface [39,40]. Qualitatively, water adsorption preferentially occurs on hydrophilic surfaces [41–46]. Apart from the amount or thickness of the water layers adsorbed on a surface, the surface chemistry can also alter the configuration of water molecules in the adsorbed layer. When a surface is hydrophilic, both ordered and liquid-like water structures can coexist as the outermost adsorbed layer [10,47]. In contrast, adsorbed water assumes a more liquid-like structure on hydrophobic surfaces [41]. Using MD simulations, Willard et al. [48] reported that water molecules adsorbed on hydrophobic surfaces showed diffusive behavior due to the lack of strong interactions with the surface. Gordillo et al. [49] demonstrated that water molecules on graphite do not form H-bond interactions with the surface.
(a) (b)
(c) (d) (e)
Figure 3.Water adsorption on different crystallographic planes obtained in molecular dynamics (MD) simulations. (a) Adsorbed water structure on two different adsorption sites of theβ-cristobalite(100) surface, i.e., the bridge site of two adjacent vicinal hydroxyl groups (a,b) and that of two adjacent geminal silanols (c,d). The water molecules have been colored with black oxygen and white hydrogen to distinguish from the hydroxyl groups on the surface (colored dark gray and light grayd). (e) Adsorbed water structure on theβ-cristobalite(111) surface. Reprinted from Ref. [36], Copyright 2005, with permission from APS publications.
Colloids Interfaces 2019, 3, x FOR PEER REVIEW 4 of 30
Figure 3. Water adsorption on different crystallographic planes obtained in molecular dynamics
(MD) simulations. (a) Adsorbed water structure on two different adsorption sites of the
β-cristobalite(100) surface, i.e., the bridge site of two adjacent vicinal hydroxyl groups (a,b) and that of two adjacent geminal silanols (c,d). The water molecules have been colored with black oxygen and white hydrogen to distinguish from the hydroxyl groups on the surface (colored dark gray and light grayd). (e) Adsorbed water structure on the β-cristobalite(111) surface. Reprinted from Ref. [36], Copyright 2005, with permission from APS publications.
(a) (b)
Figure 4. MD simulation snapshot of the equilibrium configuration of water molecules at fluorite (111) surface (a) and (100) surface (b) (green: fluorine; cyan: calcium). Reprinted from Ref. [37], Copyright 2015, with permission from ICE Virtual Library.
2.2. Effect of Surface Wettability on Water Adsorption
In generally, surface wettability (hydrophilicity/hydrophobicity) is assessed by the contact angle of a water droplet [38]. The water contact angle on a highly hydrophilic surface may be as low as nearly zero and rises with the hydrophobicity of the solid surface [39,40]. Qualitatively, water adsorption preferentially occurs on hydrophilic surfaces [41–46]. Apart from the amount or thickness of the water layers adsorbed on a surface, the surface chemistry can also alter the configuration of water molecules in the adsorbed layer. When a surface is hydrophilic, both ordered and liquid-like water structures can coexist as the outermost adsorbed layer [10,47]. In contrast, adsorbed water assumes a more liquid-like structure on hydrophobic surfaces [41]. Using MD simulations, Willard et al. [48] reported that water molecules adsorbed on hydrophobic surfaces showed diffusive behavior due to the lack of strong interactions with the surface. Gordillo et al. [49] demonstrated that water molecules on graphite do not form H-bond interactions with the surface.
(a) (b)
(c) (d) (e)
Figure 4.MD simulation snapshot of the equilibrium configuration of water molecules at fluorite (111) surface (a) and (100) surface (b) (green: fluorine; cyan: calcium). Reprinted from Ref. [37], Copyright 2015, with permission from ICE Virtual Library.
2.2. Effect of Surface Wettability on Water Adsorption
Colloids Interfaces2019,3, 55 5 of 31
interactions with the surface. Gordillo et al. [49] demonstrated that water molecules on graphite do not form H-bond interactions with the surface.
Chen et al. [41] compared the configurations of adsorbed water layer on a hydrophilic Si oxide surface (terminated with Si–OH groups, water contact angle<5◦) and a relatively hydrophobic Si surface (terminated with Si–H groups, water contact angle≈83◦) by characterizing O–H stretching vibrations using attenuated total reflection infrared (ATR-IR) spectroscopy. As shown in Figure5a and b, the difference in the H-bonding interactions of water molecules adsorbed on these two surfaces is manifested in the peak shape of the O–H stretching mode in the range of 3000–3800 cm−1. In general, ice water shows a peak centered at ~3220 cm−1[50,51], while liquid water exhibits a broad peak centered at ~3400 cm−1
[52,53]. Thus, the OH stretching band can be deconvoluted into these two components: A solid-like component with a strongly H-bonded, relatively ordered structure and a liquid-like component with a disordered structure [53].
Colloids Interfaces 2019, 3, x FOR PEER REVIEW 5 of 30
Chen et al. [41] compared the configurations of adsorbed water layer on a hydrophilic Si oxide surface (terminated with Si–OH groups, water contact angle <5°) and a relatively hydrophobic Si surface (terminated with Si–H groups, water contact angle ≈ 83°) by characterizing O–H stretching vibrations using attenuated total reflection infrared (ATR-IR) spectroscopy. As shown in Figure 5a and b, the difference in the H-bonding interactions of water molecules adsorbed on these two surfaces is manifested in the peak shape of the O–H stretching mode in the range of 3000–3800 cm−1.
In general, ice water shows a peak centered at ~3220 cm−1 [50,51], while liquid water exhibits a broad
peak centered at ~3400 cm−1 [52,53]. Thus, the OH stretching band can be deconvoluted into these
two components: A solid-like component with a strongly H-bonded, relatively ordered structure and a liquid-like component with a disordered structure [53].
On the hydrophilic OH-terminated Si oxide surface, the dominance of the peak at ~3220 cm−1
(blue line in Figure 5a) implies the abundance of the ordered water structure over the disordered structure (Figure 5c). This configuration is congruent with the structures previously proposed from other spectroscopic observations [13,51,54] and MD simulations [55,56]. A similar water adsorption behavior has been observed on other hydrophilic surfaces reported by Thiel, et al. and Beaglehole, et al. [57,58]. On the hydrophobic H-terminated Si surface, the main peak was observed at ~3400 cm−1
(green line in Figure 5b), indicating the weakly H-bonded disordered structure is dominating. While the thickness of water increases up to four layers of hydrophilic OH-terminated Si oxide surfaces at near-saturation humid conditions, it remains less than a monolayer coverage on the hydrophobic Si surface (Figure 5d) [59]. On hydrophobic surfaces, adsorbed water molecules would form clusters. Based on the spectral shape of the OH stretching mode (Figure 5b), the structure of these clusters appears to be highly disordered or dynamically changing, regardless of the relative humidity (RH) of the environment [60]. Using atomic force microscopy (AFM), Cao et al. [61] visualized the microscopic structures of adsorbed water on H–Si(111), graphite, and functionalized mica, and found that water is adsorbed as nanodroplets ~10–100 nm in size on these surfaces under ambient conditions.
Figure 5. Water adsorptions on hydrophilic OH-terminated silicon oxide surface and hydrophobic H-terminated silicon surface. ATR-IR spectra of the O-H stretching region of water adsorbed on (a) hydrophilic OH-terminated silicon oxide surface (Si-OH) and (b) hydrophobic H-terminated silicon surface (Si-H) at relative humidity (RHs) of 15%, 30%, 45%, 60%, 75% and 90%. The insets schematically show the Si-OH functional groups on a native oxide layer and the Si-H groups on the HF-etched surface. Si: blue, O: red, H: grey. The O-H stretching region is fitted with two
(c) (d)
(a) Si-OH (b) Si-H
Figure 5.Water adsorptions on hydrophilic OH-terminated silicon oxide surface and hydrophobic H-terminated silicon surface. ATR-IR spectra of the O-H stretching region of water adsorbed on (a) hydrophilic OH-terminated silicon oxide surface (Si-OH) and (b) hydrophobic H-terminated silicon surface (Si-H) at relative humidity (RHs) of 15%, 30%, 45%, 60%, 75% and 90%. The insets schematically show the Si-OH functional groups on a native oxide layer and the Si-H groups on the HF-etched surface. Si: blue, O: red, H: grey. The O-H stretching region is fitted with two components-strongly H-bonded water (blue lines centered at 3200~3275 cm−1) and weakly H-bonded water (green lines centered at 3400~3450 cm−1). (c) and (d) respectively illustrating the schematic of structural of adsorbed water layer on hydrophilic Si-OH and hydrophobic Si-H surfaces. The dotted yellow lines represent hydrogen bonds. Note that illustration is not to scale. Upper-right inset in (d) showing the schematic of clusters of water molecules on the hydrophobic Si-H surface. Reprinted from Ref. [41], Copyright 2018, with permission from ACS publications.
Colloids Interfaces2019,3, 55 6 of 31
line in Figure5b), indicating the weakly H-bonded disordered structure is dominating. While the thickness of water increases up to four layers of hydrophilic OH-terminated Si oxide surfaces at near-saturation humid conditions, it remains less than a monolayer coverage on the hydrophobic Si surface (Figure5d) [59]. On hydrophobic surfaces, adsorbed water molecules would form clusters. Based on the spectral shape of the OH stretching mode (Figure5b), the structure of these clusters appears to be highly disordered or dynamically changing, regardless of the relative humidity (RH) of the environment [60]. Using atomic force microscopy (AFM), Cao et al. [61] visualized the microscopic structures of adsorbed water on H–Si(111), graphite, and functionalized mica, and found that water is adsorbed as nanodroplets ~10–100 nm in size on these surfaces under ambient conditions.
Apart from the molecular configuration of the adsorbed water layer, the entropy of water adsorption depends on the surface wettability [60]. The water layer adsorbed on hydrophilic surfaces at low humidity seems to have much lower entropies than bulk water, and the entropy of the water layer increases as the surface becomes more hydrophobic. MD simulation studies showed that interfacial water molecules on a hydrophilic surface remained in the interfacial region longer than those on a hydrophobic surface [10–13]. The physical structure of the material surface can also determine the configuration of the adsorbed water layer. Chen et al. [62] varied the contact angle of a Si surface from ~0◦to ~85◦via aging of the H-terminated Si surface in various environments (e.g., DI water, humid air, anhydrous ethanol). Their study showed that the amount of adsorbed water as well as solid-like structure decreases with the increase in hydrophobicity of flat substrate surfaces. However, the aged surface with a gel-like structure could uptake significantly more water from humid air than flat Si surfaces with complete OH-termination (SiOx/OH) even if the latter is more hydrophilic (Figure6).
Colloids Interfaces 2019, 3, x FOR PEER REVIEW 6 of 30
components-strongly H-bonded water (blue lines centered at 3200~3275 cm−1) and weakly H-bonded water (green lines centered at 3400~3450 cm−1). (c) and (d) respectively illustrating the schematic of structural of adsorbed water layer on hydrophilic Si-OH and hydrophobic Si-H surfaces. The dotted yellow lines represent hydrogen bonds. Note that illustration is not to scale. Upper-right inset in (d) showing the schematic of clusters of water molecules on the hydrophobic Si-H surface. Reprinted from Ref. [41], Copyright 2018, with permission from ACS publications.
Apart from the molecular configuration of the adsorbed water layer, the entropy of water adsorption depends on the surface wettability [60]. The water layer adsorbed on hydrophilic surfaces at low humidity seems to have much lower entropies than bulk water, and the entropy of the water layer increases as the surface becomes more hydrophobic. MD simulation studies showed that interfacial water molecules on a hydrophilic surface remained in the interfacial region longer than those on a hydrophobic surface [10–13]. The physical structure of the material surface can also determine the configuration of the adsorbed water layer. Chen et al. [62] varied the contact angle of a Si surface from ~0° to ~85° via aging of the H-terminated Si surface in various environments (e.g., DI water, humid air, anhydrous ethanol). Their study showed that the amount of adsorbed water as well as solid-like structure decreases with the increase in hydrophobicity of flat substrate surfaces. However, the aged surface with a gel-like structure could uptake significantly more water from humid air than flat Si surfaces with complete OH-termination (SiOx/OH) even if the latter is more
hydrophilic (Figure 6).
Figure 6. The relationship between adsorbed water thickness and the water contact angle on Siwater, Siair, Sialcohol, and SiOx/OH surfaces. Insets: schematic illustrating water adsorption on Siwater surface with gel-like chains network formed in DI water (upper) and the transform from hydrophobicity to hydrophilicity (bottom). The gray shadow area and the dashed line are drawn to guide eyes for these two conditions. The RH for all measurements is controlled at 35 ± 5%. Reprinted from Ref. [62].
2.3. Effect of External Environments on Water Adsorption
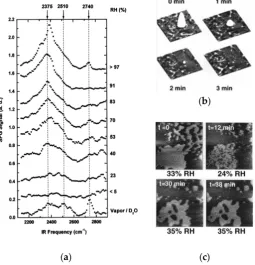
In addition to the intrinsic surface properties of materials described above, the external environmental conditions such as RH, temperature, and storage time can influence water adsorption. Miranda et al. [63] studied water adsorption on mica at various RH conditions using SFG vibrational spectroscopy. The results of this work revealed that the structure of the adsorbed water layer evolves with RH. In the adsorption spectrum of heavy water (D2O), the sharp peak at 2740 cm−1 corresponds to
the O–D stretching of non-H-bonded O–D groups (free O–D stretching), while the broad peaks at 2375 and 2510 cm−1 represent O–D stretching modes associated with ordered and disordered H-bonded
networks, respectively (Figure 7a) [51,64]. The O–D stretching modes associated with H-bonded O–D groups begin to emerge at RH of 23%, and the component corresponding to the ordered structure
Figure 6.The relationship between adsorbed water thickness and the water contact angle on Siwater, Siair, Sialcohol, and SiOx/OH surfaces. Insets: schematic illustrating water adsorption on Siwatersurface with gel-like chains network formed in DI water (upper) and the transform from hydrophobicity to hydrophilicity (bottom). The gray shadow area and the dashed line are drawn to guide eyes for these two conditions. The RH for all measurements is controlled at 35±5%. Reprinted from Ref. [62].
2.3. Effect of External Environments on Water Adsorption
In addition to the intrinsic surface properties of materials described above, the external environmental conditions such as RH, temperature, and storage time can influence water adsorption. Miranda et al. [63] studied water adsorption on mica at various RH conditions using SFG vibrational spectroscopy. The results of this work revealed that the structure of the adsorbed water layer evolves with RH. In the adsorption spectrum of heavy water (D2O), the sharp peak at 2740 cm−1corresponds to
Colloids Interfaces2019,3, 55 7 of 31
groups begin to emerge at RH of 23%, and the component corresponding to the ordered structure becomes stronger than the component corresponding to the disordered structure at RH≥40%. When RH exceeds 90%, the spectrum is completely dominated by the ordered O–D peak, indicating the domination of the ordered structure over the disordered one in the adsorbed water layer. Xu et al. [65] investigated the evolution of the adsorbed water layer on a mica surface with changes in RH by modifying the water structure by contacting with the tip of a scanning polarization force microscope. The tip contact produced a circular depression in the local polarizability at low RH (<20%), and capillary condensation induced the formation of water droplets and 2D islands around the contact point at other high RHs. In contrast to the evaporation of droplets over a short period of time, the ordered structure islands can remain much longer time (Figure7b). However, the water droplets rapidly evaporated as RH decreased from 33% to 24%. The water molecules were condensed again as RH was increased back to 35%, and the recovery of the islands ceased after 38 min (Figure7c).
Colloids Interfaces 2019, 3, x FOR PEER REVIEW 7 of 30
becomes stronger than the component corresponding to the disordered structure at RH ≥ 40%. When RH exceeds 90%, the spectrum is completely dominated by the ordered O–D peak, indicating the domination of the ordered structure over the disordered one in the adsorbed water layer. Xu et al. [65] investigated the evolution of the adsorbed water layer on a mica surface with changes in RH by modifying the water structure by contacting with the tip of a scanning polarization force microscope. The tip contact produced a circular depression in the local polarizability at low RH (<20%), and capillary condensation induced the formation of water droplets and 2D islands around the contact point at other high RHs. In contrast to the evaporation of droplets over a short period of time, the ordered structure islands can remain much longer time (Figure 7b). However, the water droplets rapidly evaporated as RH decreased from 33% to 24%. The water molecules were condensed again as RH was increased back to 35%, and the recovery of the islands ceased after 38 min (Figure 7c).
(b)
(a) (c)
Figure 7. (a) Sum frequency generation (SFG) spectra of a water (D2O) film on a mica surface as a function of RH at room temperature (296 K); The spectrum of the bulk waver/vapor interface is added as a comparison (the bottom trace). (b) SPFM images (6 μm × 6 μm) showing the evaporation of a droplet of water left on the mica surface after breaking the capillary neck formed around the atomic force microscopy (AFM) tip during contact. (c) SPFM images (3.4 μm × 3.4 μm) showing the size of the water islands at different RH. Reprinted from Ref. [63,65], Copyright 1998, with permission from ACS publications & APS publications.
Similar to observations on the mica surface, the water layer grows gradually with increasing RH on other hydrophilic surfaces [66,67]. However, the evolution of water structures on highly-hydroxylated Si oxide surfaces with a water contact angle less than 5° is fairly diverse. Figure 8a presents the thickness of the adsorbed water layer, as well as the ordered and disordered components with varying RH, on the Si oxide surface. The values recorded are estimated based on the ATR–IR spectra of O–H stretching measured on the substrate surface. At low RH (<30%), the ordered O–H peaks are dominant, so the adsorbed water mainly has a solid-like structure on the Si oxide surface that propagates for up to ~3 layers from the surface. The solid-like structure, also denoted as the ice or ordered structure, competes with the liquid water structure in the RH range of 30–60%, above which the liquid structure dominates the adsorbed water (Figure 8b). Similar results on the RH dependence of adsorbed water structures have been obtained by MD simulations [41]. Rahaman et al. [67] studied the dynamics of water adsorption on calcite surfaces as a function of RH
Figure 7. (a) Sum frequency generation (SFG) spectra of a water (D2O) film on a mica surface as a function of RH at room temperature (296 K); The spectrum of the bulk waver/vapor interface is added as a comparison (the bottom trace). (b) SPFM images (6µm×6µm) showing the evaporation of a
droplet of water left on the mica surface after breaking the capillary neck formed around the atomic force microscopy (AFM) tip during contact. (c) SPFM images (3.4µm×3.4µm) showing the size of the
water islands at different RH. Reprinted from Ref. [63,65], Copyright 1998, with permission from ACS publications & APS publications.
Colloids Interfaces2019,3, 55 8 of 31
structures have been obtained by MD simulations [41]. Rahaman et al. [67] studied the dynamics of water adsorption on calcite surfaces as a function of RH and found that water molecules appeared to be much more tightly bound to the surface at low RHs than at high RHs, indicating the domination of an ordered water layer under these conditions.
Colloids Interfaces 2019, 3, x FOR PEER REVIEW 8 of 30
and found that water molecules appeared to be much more tightly bound to the surface at low RHs than at high RHs, indicating the domination of an ordered water layer under these conditions.
(a) (b)
Figure 8. (a) Adsorption isotherm of adsorbed water layer on silicon oxide surface estimated based on the ATR-IR spectra of O-H stretching region measured at room temperature. Regions A, B, and C are marked to demonstrate the growth of ice-like water at low RH (< ~30%), transitional growth from ice-like structure to liquid-like structure at middle RH (~30% < RH < ~60%), and the growth of liquid water at high RH (> ~60%). (b) Schematic illustrating the structural evolution of adsorbed water layer on hydrophilic silicon oxide surface. Reprinted from Ref. [10], Copyright 2005, with permission from ACS publications.
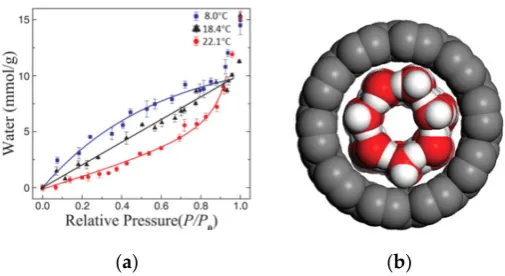
RH-dependent water adsorption behaviors have been studied on hydrophobic graphene surfaces. No adsorbed water exists on the surface of graphene/mica at RHs below 2%, and a polygonal island structure can be observed at RHs above 90% [68]. Furthermore, water molecules are capable of adsorbing inside single-walled carbon nanotubes (SWNTs). As RH increases, the amount of water adsorbed in the SWNTs increases at temperatures between 8.0 and 22.1 °C (Figure 9a) [69,70]. Here, the environmental temperatures have a significant impact on the water adsorption in SWNTs. More water molecules are adsorbed in SWNTs at lower temperatures, especially at RHs below 90%, than at higher ones, thereby indicating that a hydrophobic-hydrophilic transition in SWNTs can be realized by cooling treatment [19,71]. Ketteler et al. [72] demonstrated that the water film coverage on a TiO2 (110) surface increases with increasing RH but decreases with increasing
temperature. Using grand canonical Monte Carlo simulations, Puibasset et al. [73] compared the adsorption of water in disordered mesoporous silica glass (Vycor-like) at temperatures of 300 and 650 K. The results showed a hysteresis loop in the adsorption/desorption data at low temperatures and a reversible curve at high temperatures. The results described above demonstrate that the structure of interfacial water is sensitive to temperature.
(a) (b)
Figure 9. (a) Water adsorption isotherms inside single-walled carbon nanotubes (SWNTs) as a function of RH measured at different temperatures, including 8.0 °C (squares), 18.4 °C (triangles), and 22.1 °C (circles). (b) Schematic illustration showing a monolayer water adsorbed inside SWNTs at 8.0 °C. Reprinted from Ref. [19,71], Copyright 2008, with permission from Science.
Figure 8.(a) Adsorption isotherm of adsorbed water layer on silicon oxide surface estimated based on the ATR-IR spectra of O-H stretching region measured at room temperature. Regions A, B, and C are marked to demonstrate the growth of ice-like water at low RH (<~30%), transitional growth from ice-like structure to liquid-like structure at middle RH (~30%<RH<~60%), and the growth of liquid water at high RH (>~60%). (b) Schematic illustrating the structural evolution of adsorbed water layer on hydrophilic silicon oxide surface. Reprinted from Ref. [10], Copyright 2005, with permission from ACS publications.
RH-dependent water adsorption behaviors have been studied on hydrophobic graphene surfaces. No adsorbed water exists on the surface of graphene/mica at RHs below 2%, and a polygonal island structure can be observed at RHs above 90% [68]. Furthermore, water molecules are capable of adsorbing inside single-walled carbon nanotubes (SWNTs). As RH increases, the amount of water adsorbed in the SWNTs increases at temperatures between 8.0 and 22.1◦C (Figure9a) [69,70]. Here, the environmental temperatures have a significant impact on the water adsorption in SWNTs. More water molecules are adsorbed in SWNTs at lower temperatures, especially at RHs below 90%, than at higher ones, thereby indicating that a hydrophobic-hydrophilic transition in SWNTs can be realized by cooling treatment [19,71]. Ketteler et al. [72] demonstrated that the water film coverage on a TiO2(110) surface increases with increasing RH but decreases with increasing temperature. Using
Colloids Interfaces2019,3, 55 9 of 31
Colloids Interfaces 2019, 3, x FOR PEER REVIEW 8 of 30
and found that water molecules appeared to be much more tightly bound to the surface at low RHs than at high RHs, indicating the domination of an ordered water layer under these conditions.
(a) (b)
Figure 8. (a) Adsorption isotherm of adsorbed water layer on silicon oxide surface estimated based on the ATR-IR spectra of O-H stretching region measured at room temperature. Regions A, B, and C are marked to demonstrate the growth of ice-like water at low RH (< ~30%), transitional growth from ice-like structure to liquid-like structure at middle RH (~30% < RH < ~60%), and the growth of liquid water at high RH (> ~60%). (b) Schematic illustrating the structural evolution of adsorbed water layer on hydrophilic silicon oxide surface. Reprinted from Ref. [10], Copyright 2005, with permission from ACS publications.
RH-dependent water adsorption behaviors have been studied on hydrophobic graphene surfaces. No adsorbed water exists on the surface of graphene/mica at RHs below 2%, and a polygonal island structure can be observed at RHs above 90% [68]. Furthermore, water molecules are capable of adsorbing inside single-walled carbon nanotubes (SWNTs). As RH increases, the amount of water adsorbed in the SWNTs increases at temperatures between 8.0 and 22.1 °C (Figure 9a) [69,70]. Here, the environmental temperatures have a significant impact on the water adsorption in SWNTs. More water molecules are adsorbed in SWNTs at lower temperatures, especially at RHs below 90%, than at higher ones, thereby indicating that a hydrophobic-hydrophilic transition in SWNTs can be realized by cooling treatment [19,71]. Ketteler et al. [72] demonstrated that the water film coverage on a TiO2 (110) surface increases with increasing RH but decreases with increasing
temperature. Using grand canonical Monte Carlo simulations, Puibasset et al. [73] compared the adsorption of water in disordered mesoporous silica glass (Vycor-like) at temperatures of 300 and 650 K. The results showed a hysteresis loop in the adsorption/desorption data at low temperatures and a reversible curve at high temperatures. The results described above demonstrate that the structure of interfacial water is sensitive to temperature.
(a) (b)
Figure 9. (a) Water adsorption isotherms inside single-walled carbon nanotubes (SWNTs) as a function of RH measured at different temperatures, including 8.0 °C (squares), 18.4 °C (triangles), and 22.1 °C (circles). (b) Schematic illustration showing a monolayer water adsorbed inside SWNTs at 8.0 °C. Reprinted from Ref. [19,71], Copyright 2008, with permission from Science.
Figure 9.(a) Water adsorption isotherms inside single-walled carbon nanotubes (SWNTs) as a function of RH measured at different temperatures, including 8.0◦C (squares), 18.4◦C (triangles), and 22.1◦C (circles). (b) Schematic illustration showing a monolayer water adsorbed inside SWNTs at 8.0◦C. Reprinted from Ref. [19,71], Copyright 2008, with permission from Science.
3. Effect of Water Adsorption on Adhesion at Nanoasperity Contact
3.1. Brief Introduction of Water Adsorption-Dependent Adhesion Forces
Fais the force required to separate two contacting or near-contacting surfaces. In general, the
components that can contribute toFabetween surfaces are capillary force (Fc), van der Waals force
(FvdW), electrostatic force (FE), and chemical bonding force (FB) [14,73–75]. In dry or vacuum conditions,
Fais mainly determined by the attractive force of two contacting surfaces, such asFvdW,FE, andFB,
due to the lack of adsorbed water. If the tip and sample sit in air for a sufficiently long time, surface charges are expected to fully dissipate [76]. Thus,FE=0.FBcan also be neglected when the contacting
surfaces are fully saturated with non-reactive functional groups. Therefore,Fais dominated byFvdW
under dry or vacuum conditions. At ambient conditions, water molecules can condense around the contact interface and form a meniscus (bridge) around the annulus of the contact area [77]. This meniscus attracts the two surfaces to come in close contact and causes greater adhesion. In this case, the adhesion between surfaces is mainly dominated byFcandFvdW.
A typical technique to quantify interfacial adhesion involves measurement of the pull-offforce using AFM. Extensive experiments carried out in humid air show thatFais dominated by the capillary
interaction, which varies with RH as well as the surface wettability or surface chemistry [14,15]. The RH-dependentFcplays an important role in adhesion behaviors. For example, as RH increases,Fc
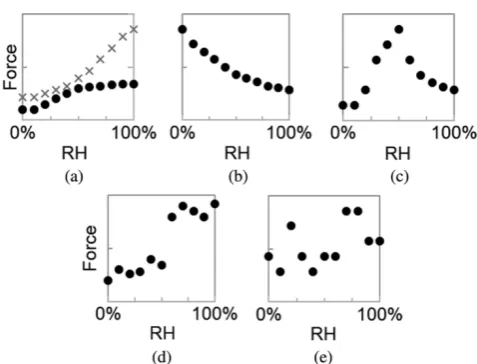
has been reported to monotonically increase [78], monotonically decrease [79], exhibit a maximum [80, 81], increase in a step-wise manner [82], or remain constant [83] (Figure 10). The discrepancies among these reports may be due to the differences in the humidity measurement ranges, sample preparation processes, and measurement methods. Thus, experimental details must be considered before conclusions on the influence of RH onFaare drawn. Researchers believe that RH and surface
wettability are among the factors determiningFaat single-asperity contact [77,80,81]. In general, trend c
in Figure10is most frequently observed for hydrophilic contact surfaces (i.e., silanol group terminated Si3N4[65], mica [84] or SiO2surface [80,81]), which is usually attributed to the formation of water
meniscus around the contact. When either or both of the contact surfaces are hydrophobic, theFchas a
limited contribution toFadue to weak capillary condensation. In this case, adhesion is dominated by
Colloids Interfaces2019,3, 55 10 of 31
Colloids Interfaces 2019, 3, x FOR PEER REVIEW 9 of 30
3. Effect of Water Adsorption on Adhesion at Nanoasperity Contact
3.1. Brief Introduction of Water Adsorption-Dependent Adhesion Forces
Fa is the force required to separate two contacting or near-contacting surfaces. In general, the
components that can contribute to Fa between surfaces are capillary force (Fc), van der Waals force
(FvdW), electrostatic force (FE), and chemical bonding force (FB) [14,73–75]. In dry or vacuum conditions, Fa is mainly determined by the attractive force of two contacting surfaces, such as FvdW, FE, and FB, due
to the lack of adsorbed water. If the tip and sample sit in air for a sufficiently long time, surface charges are expected to fully dissipate [76]. Thus, FE = 0. FB can also be neglected when the contacting surfaces
are fully saturated with non-reactive functional groups. Therefore, Fa is dominated by FvdW under dry
or vacuum conditions. At ambient conditions, water molecules can condense around the contact interface and form a meniscus (bridge) around the annulus of the contact area [77]. This meniscus attracts the two surfaces to come in close contact and causes greater adhesion. In this case, the adhesion between surfaces is mainly dominated by Fc and FvdW.
A typical technique to quantify interfacial adhesion involves measurement of the pull-off force using AFM. Extensive experiments carried out in humid air show that Fa is dominated by the
capillary interaction, which varies with RH as well as the surface wettability or surface chemistry [14,15]. The RH-dependent Fc plays an important role in adhesion behaviors. For example, as RH
increases, Fc has been reported to monotonically increase [78], monotonically decrease [79], exhibit a
maximum [80,81], increase in a step-wise manner [82], or remain constant [83] (Figure 10). The discrepancies among these reports may be due to the differences in the humidity measurement ranges, sample preparation processes, and measurement methods. Thus, experimental details must be considered before conclusions on the influence of RH on Fa are drawn. Researchers believe that
RH and surface wettability are among the factors determining Fa at single-asperity contact [77,80,81].
In general, trend c in Figure 10 is most frequently observed for hydrophilic contact surfaces (i.e., silanol group terminated Si3N4 [65], mica [84] or SiO2 surface [80,81]), which is usually attributed to
the formation of water meniscus around the contact. When either or both of the contact surfaces are hydrophobic, the Fc has a limited contribution to Fa due to weak capillary condensation. In this case,
adhesion is dominated by other RH-independent factors, such as FvdW and surface topography
(Figure 10e) [15,85–87].
Figure 10. Possible trends of adhesion force versus RH curves in AFM measurements. (a) Monotonic
increase (two different types); (b) Monotonic decrease; (c) Increasing to maximum and then
decreasing; (d) Step-wise increase; and (e) RH independence. Reprinted from Ref. [15], Copyright 2015, with permission from Taylor & Francis.
The variations in adhesion caused by capillary effects are strongly related to the configuration Figure 10.Possible trends of adhesion force versus RH curves in AFM measurements. (a) Monotonic increase (two different types); (b) Monotonic decrease; (c) Increasing to maximum and then decreasing; (d) Step-wise increase; and (e) RH independence. Reprinted from Ref. [15], Copyright 2015, with permission from Taylor & Francis.
The variations in adhesion caused by capillary effects are strongly related to the configuration of the condensed water bridge around the annulus of the contact area. For instance, Asay and Kim [81] calculated theFaat single-asperity contact between silicon oxide surfaces based on Xiao and Qian’s
model [80] and found that the theoretical values, includingFcandFvdW, are much smaller than the
experimental results at all RH conditions tested. The capillary effect alone cannot explain the high
Faobserved on the hydrophilic silicon oxide surface; this was explained to be due to the ignorance
of the solid-like water structure. In this case, the contribution of the rupture of H-bond bridges between strongly H-bonded networks at the center of the contact region must be considered in the adhesion. In the following subsections, the effect of water condensation on adhesion is reviewed from its contribution toFvdW,Fc, and the force of solid-like water bridge breaking.
3.2. Effect of Water Adsorption on van der Waals Force
FvdW, which is named after the Dutch scientist Johannes Diderik van der Waals, refers to the
distance-dependent interaction between atoms or molecules [74]. Unlike ionic or covalent bonds, these attractions do not result from a chemical bond. They are comparatively weak and, therefore, more susceptible to disturbance.FvdWvanishes quickly with increasing distance between interacting
molecules [88]. Normally, the value ofFvdWis approximate to the pull-offforce at the contact interface
measured in vacuum. The pull-offforce is determined from the force–distance curve based on the maximum deflection in the attractive region just before the AFM probe snaps offto the freestanding position [76]. In ambient conditions, the presence of water at the contact interface can vary theFvdW;
in this case, estimatingFvdWfrom the experimentally-measuredFabecomes difficult [76]. Thus,FvdW
is usually estimated from a theoretical calculation.
TheFvdWin a typical sphere/plane geometry (Figure11) contact can be calculated by [89]:
FvdW=AHamakerR/6a2. (1)
This force is a function of the sphere radius (R) and Hamaker constant (AHamaker) of the medium
Colloids Interfaces2019,3, 55 11 of 31
between these two limiting cases as RH increases from zero to saturation. At intermediate RHs,FvdW
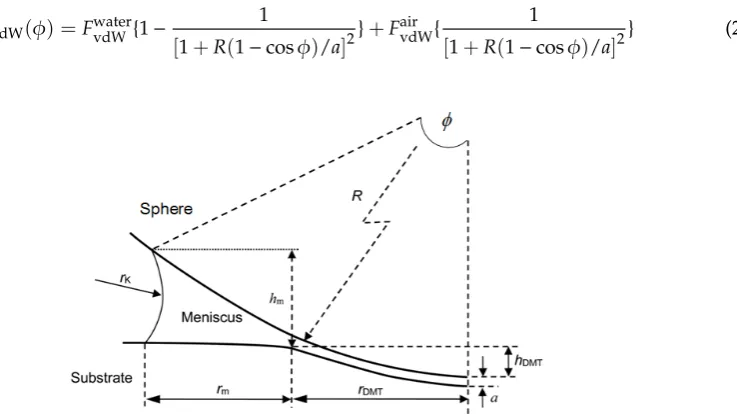
can be expressed by the following crude approximation to account for the filling angle (φ) [77,80,90],
FvdW(φ) =FwatervdW{1− 1
[1+R(1−cosφ)/a]2 }+Fair
vdW{
1
[1+R(1−cosφ)/a]2
} (2)
Colloids Interfaces 2019, 3, x FOR PEER REVIEW 10 of 30
of the condensed water bridge around the annulus of the contact area. For instance, Asay and Kim [81] calculated the Fa at single-asperity contact between silicon oxide surfaces based on Xiao and
Qian’s model [80] and found that the theoretical values, including Fc and FvdW, are much smaller than
the experimental results at all RH conditions tested. The capillary effect alone cannot explain the high Fa observed on the hydrophilic silicon oxide surface; this was explained to be due to the
ignorance of the solid-like water structure. In this case, the contribution of the rupture of H-bond bridges between strongly H-bonded networks at the center of the contact region must be considered in the adhesion. In the following subsections, the effect of water condensation on adhesion is reviewed from its contribution to FvdW, Fc, and the force of solid-like water bridge breaking.
3.2. Effect of Water Adsorption on van der Waals Force
FvdW, which is named after the Dutch scientist Johannes Diderik van der Waals, refers to the
distance-dependent interaction between atoms or molecules [74]. Unlike ionic or covalent bonds, these attractions do not result from a chemical bond. They are comparatively weak and, therefore, more susceptible to disturbance. FvdW vanishes quickly with increasing distance between interacting
molecules [88]. Normally, the value of FvdW is approximate to the pull-off force at the contact
interface measured in vacuum. The pull-off force is determined from the force–distance curve based on the maximum deflection in the attractive region just before the AFM probe snaps off to the freestanding position [76]. In ambient conditions, the presence of water at the contact interface can vary the FvdW; in this case, estimating FvdW from the experimentally-measured Fa becomes difficult
[76]. Thus, FvdW is usually estimated from a theoretical calculation.
The FvdW in a typical sphere/plane geometry (Figure 11) contact can be calculated by [89]:
FvdW = AHamakerR/6a2. (1)
This force is a function of the sphere radius (R) and Hamaker constant (AHamaker) of the medium in which the two objects are placed. According to Israelachvili [76], the separation a for most solid contacts can be taken as ~2 Å to make use of the continuum theory at the atomic scale. Then, the
values of FvdW in air (
air vdW
F
) and water (F
vdWwater) can be estimated. FvdW can be expected to take a valuebetween these two limiting cases as RH increases from zero to saturation. At intermediate RHs, FvdW
can be expressed by the following crude approximation to account for the filling angle (ϕ) [77,80,90],
water air
vdW vdW 2 vdW 2
1 1
( ) {1 } { }
[1 (1 cos ) / ] [1 (1 cos ) / ]
F F F
R a R a
φ
φ
φ
= − +
+ − + − (2)
Figure 11. A geometric model of a liquid meniscus formed between a sphere and a flat substrate. Here, ϕ is the filling angle, R the sphere radius, hDMT the DMT indentation depth, hm the height of meniscus, rK the Kelvin radius (or meridional radius) of meniscus, rm the meniscus-only portion of the total radius from the contact center, and rDMT the DMT contact radius. Reprinted from Ref. [91], Copyright 2017, with permission from ACS publications.
Figure 11.A geometric model of a liquid meniscus formed between a sphere and a flat substrate. Here,
φis the filling angle,Rthe sphere radius,hDMTthe DMT indentation depth,hmthe height of meniscus, rKthe Kelvin radius (or meridional radius) of meniscus,rmthe meniscus-only portion of the total radius from the contact center, andrDMTthe DMT contact radius. Reprinted from Ref. [91], Copyright 2017, with permission from ACS publications.
In general, condensation of the water meniscus between the sphere–plate contact interface decreasesA. For example, in the case of Si3N4/SiO2contact,AHamakeris 1.04×10⁻¹⁹and 1.9×10⁻²⁰J
when the medium is air and water, respectively [92]. Then, Equation (2) demonstrates that the growth of the water layer causes a decrease inFvdWwith increasing RH. Thus, the contribution ofFvdWto
Fadecreases with increasing RH (Figure10b). Chen et al. [4] measured theFaon a hydrophobic
H-terminated Si surface (water contact angle ~83◦) and found that the force decreases substantially as the test environment transits from humid air to liquid water. During this process,AHamakeris reduced
by 80% [80,85,93]. On a hydrophobic Si surface, water adsorption is very weak (Figure5d), soFcis
negligible andFvdWdecreases, leading to a considerable decrease ofFa. Furthermore, the decrease in
Faat high RHs (as shown in Figure10c) may be partly attributed to the decreasingFvdW. However, the
situation is complicated for hydrophilic surfaces (Figure10a,c,d). Water condensation caused by the capillary effect becomes significant in RH-dependent adhesion behaviors.
3.3. Effect of Water Condensation on Capillary Force
The meniscus condensed between two neighboring surfaces can induce attractive interactions (such asFc), which are the physical basis for many adhesion phenomena [14,15]. In earlier research,
theFcfor a sphere-on-plane geometry was simply defined based on the contact angles of a sphere (θ1)
and plane (θ2) [80],
Fc=4πγR(cosθ1+cosθ2) (3)
whereγis the surface tension of the liquid andRis the radius of sphere. Equation (3) is valid for macroscale contact, whereRis much larger than the height of the sphere immersed in the meniscus, or in the case when one or both of the contact surfaces is/are hydrophobic. In this model, the effect of the environment (such as RH) on the capillary-relatedFais very limited. Adhesion behaviors on
hydrophobic surfaces (such as self-assembled monolayers [80,94], CaF2[83], Au-coated Si3N4[95], and
Colloids Interfaces2019,3, 55 12 of 31
reveals a cluster-like structure, and its average thickness is less than one layer even when RH reaches the near-saturation level (Figure5d) [4,59]. In this case, the capillary interaction is much weaker compared with other attractive forces (i.e., the van der Waals component), and its contribution to adhesion can be neglected [80,83,85,94].
On some hydrophilic surfaces, the dependence of adhesion on surface wettability may be predicted by using Equation (3), although an exact value cannot be obtained. For example, Seo et al. [94] obtained different hydrophilic graphene surfaces by UV/O3treatment and found that the adhesion energy
(estimated fromFa) increases gradually with surface hydrophilization. The variations in adhesion as a
function of surface wettability obey the model in Equation (3). Many research groups have shown the possibility of controlling interfacial adhesion by adjusting the wettability of a surface [91–93]. As shown in Figure12, upon eithern- orp-type doping with subsurface polyelectrolytes, graphene surfaces become more hydrophilic [59], water adsorption is enhanced, andFa(i.e., the pull-offforce) increases
significantly. This behavior is consistent with the wettability-dependent adhesion modulation [96].
Colloids Interfaces 2019, 3, x FOR PEER REVIEW 12 of 30
Figure 12. (a) Schematic illustrations showing graphene wettability modulation by doping-induced Fermi level shifts. (b) Water contact angle (left axis) measured by environmental scanning electron microscopy and the work function (right axis) measured by scanning Kelvin probe microscopy of n-doped (by high molecular weight (HMW) poly(allylamine hydrochloride) (PAH) and poly-L-lysine (PLL)), the p-doped graphene (by HMW poly(sodium 4-styrenesulfonate) and
poly(acrylic acid) (PAA)), and undoped graphene on SiO2. (c) Adhesion force measurements on
doped and undoped graphene samples using an octadecyltrichlorosilane-coated silicon AFM probe. Hydrophilic SiO2/Si was used as a control substrate and showed the lowest adhesion force. Reprinted from Ref. [96], Copyright 2016, with permission from ACS publications.
Fc describes the force exerted on neighboring surfaces due to the surface tension of the condensed
liquid and the curvature of the meniscus. According to the thermodynamic equilibrium between solid and liquid (Young’s equation) and between liquid and vapor (Young-Laplace equation) [14], the Fc
exerted on the asperity by the meniscus comes from both the capillary pressure (pressure difference ∆p outside and inside the meniscus due to the curvature) and the surface tension: Fc = Fp + Fs [97]. Xiao and
Qian [80] proposed a relationship between Fc and the filling angle (φ) between the tip and the water
meniscus for a typical sphere-plate contact geometry (Figure 11). Fp and Fs can be estimated based on
the contact angles of a sphere (θ1) and a plane (θ2) [89] as follows:
2
1 2
cos( ) cos
( ) ( sin sin )
1 cos p F R a R θ φ θ φ πγ φ φ φ + + = − +
+ − (4)
1 1 1
( ) 2 sin( ) 2 sin sin( )
s
F φ = πγr θ φ+ = πγR φ θ φ+ (5)
where a is the minimum distance between the sphere and the plane [80]. At thermal equilibrium, the filling angle (ϕ) is determined by the Kelvin equation [98,99],
1 2
0
cos( ) cos( )
1
ln /
Sin (1 cos )
s
kT P P
v P R a R
θ φ
θ
γ
γ
φ
φ
+ +
= Δ = +
+ − (6)
where v0 is the molecular volume of water and P/Ps is RH.
The height of the water bridge at the contact interface and the related Fc can be calculated from
Equations (4-6). A significant decrease in Fc at high RHs is a consequence of a marked decrease in the
Laplace pressure relative to the size of the water bridge, which is considered to play a dominant role in the drop in Fa with RH in many studies [15]. Bartošík et al. [93] investigated the Fa between a
hydrophilic silicon oxide surface and a Si AFM tip and found that the Fa increases at low RH and
then decreases at high RH and this trend is reversible. Similar behaviors were predicted for different radii of the contacted asperity tip (Figure 13a) based on the formulation given by Xiao and Qian [80] considering the variation in FvdW. When RH is fixed, the Fa dominated by capillary interaction has
been observed to increase linearly with the increase of tip radius. All calculated constituents, including Fc, tension force, and FvdW, show a linear dependence on the tip radius (Figure 13b). The
transition of Fa with RH can be explained by changes in relative contributions of these individual
components. As shown in Figure 13c, the decrease in Fc caused by the Laplace pressure mainly
contributes to the drop in Fa at high RHs. However, the variations in FvdW also play a significant role
in the adhesion behavior.
Figure 12.(a) Schematic illustrations showing graphene wettability modulation by doping-induced Fermi level shifts. (b) Water contact angle (left axis) measured by environmental scanning electron microscopy and the work function (right axis) measured by scanning Kelvin probe microscopy of n-doped (by high molecular weight (HMW) poly(allylamine hydrochloride) (PAH) and poly-L-lysine (PLL)), the p-doped graphene (by HMW poly(sodium 4-styrenesulfonate) and poly(acrylic acid) (PAA)), and undoped graphene on SiO2. (c) Adhesion force measurements on doped and undoped graphene samples using an octadecyltrichlorosilane-coated silicon AFM probe. Hydrophilic SiO2/Si was used as a control substrate and showed the lowest adhesion force. Reprinted from Ref. [96], Copyright 2016, with permission from ACS publications.
The schematic shown in Figure10reveals that the adhesion behavior strongly depends on RH. However, the contribution of this factor to adhesion is not considered in Equation (3). Taking graphene as an example,Faremains low at low humidity due to the lack of a capillary meniscus. In this case,
FvdWshould play a dominant role. However, when RH>23%, an adsorbed water layer begins to form
and expands from the initial liquid island to the entire graphene surface, thereby increasing theFc
andFaas RH rises to ~45% [88]. Several other studies demonstrated that the increase of RH above
50% may result in a decrease ofFa, especially on hydrophilic surfaces (Figure10c) [80,81,93]. Xiao and
Qian [80] built a new formulation to fit this complex RH-dependent adhesion behavior and explain the observed decrease inFaat high RH. The authors indicated that the decrease in capillary pressure force
governed this behavior when the dimension of the meniscus became comparable with the tip size.
Fcdescribes the force exerted on neighboring surfaces due to the surface tension of the condensed
liquid and the curvature of the meniscus. According to the thermodynamic equilibrium between solid and liquid (Young’s equation) and between liquid and vapor (Young-Laplace equation) [14], theFc
exerted on the asperity by the meniscus comes from both the capillary pressure (pressure difference∆p
outside and inside the meniscus due to the curvature) and the surface tension:Fc=Fp+Fs[97]. Xiao