Ni-Cr-Mo Cladding on Mild Steel Surface
using CO
2
Laser and Process Modeling with
Response Surface Methodology (RSM)
SUBRATA MONDAL
School of Laser Science and Engineering, Jadavpur University, Kolkata-32, India [email protected]
ASISH BANDYOPADHYAY
Mechanical Engineering Department, Jadavpur University, Kolkata-700032, India [email protected]
PRADIP KUMAR PAL
Mechanical Engineering Department, Jadavpur University, Kolkata-700032, India [email protected]
Abstract:
Laser cladding is one of the advanced coating technologies in the present day. Application of mild steel component in an open atmosphere is limited owing to its high corrosiveness in nature. To overcome this limitation, in the present work an anti-corrosive powder mixture of Ni, Cr and Mo with a selected ratio is deposited as a thin layer on
the mild steel plate with the help of 3.5 kW CO2 laser. The laser cladding process is selected as it is fast and precise,
compared to other coating technology. Experiments are performed according to L9 Taguchi orthogonal array. The
parametric study on laser cladding process using response surface methodology (RSM) is presented in this paper. This includes the study of influence of process parameters on responses and process optimization to find the optimal input parameters combination by expecting the improved clad quality. Based on experimental data, a mathematical model is developed to find the relationship between process input parameter and responses. It is seen that there is a high degree of approximation between the experimental results and predicted one.
Keywords: Laser cladding; Taguchi method; Regression analysis; Optimization; MRA; RSM; CO2 laser.
1. Introduction
Fig.1Ishikawa diagram for performance characteristics in laser cladding process
1.1 Literature Review
Various researchers carried out their extensive research work using CO2 laser to investigate the laser
coating performance on corrosion and wear behavior. Kathuria [3] presented a study of laser cladding process in both stationary and scanning beam modes with the laser cladding of satellite six on mild steel and Cr-Ni materials. The effects of the various parameters such as input power, beam interaction time, scanning frequency and traverse speed were considered. Shepeleva et al. [4] presented a comparison between the laser cladding process in which the method of direct injection of cladding powder into the melt pool is used and plasma cladding process. They captured optical and SEM photographs of cross section of clad-substrate interface. It was found that the laser cladded zone has a smooth interface with the substrate, which prevents stress concentration at the clad-substrate interface during application. They also concluded that laser cladded zone, unlike the plasma treated surfaces are free of micro cracks and pores. Chryssolouris et al. [5] performed an experimental investigation on laser cladding with aluminum alloy as substrate and copper based powder as cladding material. The process parameters of their experiments had been powder feed rate (g/min), process speed (mm/min) and gas supply (l/h). They observed that the process speed did not affect dilution depth while increasing powder feed rate might have a negative effect on performance. They concluded that in order to achieve an optimum clad result, in terms of increased clad depth and minimum alloying zone, powder feed rates should be kept low and process speed should be high. Meng et al. [6] conducted powder laser cladding experiments in order to improve wear resistance of titanium alloy (Ti-6Al-4V substrate) using NiCoCrAlY powder. The process parameters of this process were laser power (750 W), scanning speed (3-7 mm/s)
and laser beam diameter (Φ3 mm). They observed that with high laser scanning speed, thick preplaced powder layer
could not be melted completely and the quality of the coating was poor. They concluded that with the preplaced NiCoCrAlY powder, a laser cladding on Ti-6Al-4V surface without cracks and pores could be obtained and micro hardness of the surface is two times higher than that before cladding. J Paulo Davim et al [7, 8] performed experimental study on geometric form of clad layer. They examined the effect of processing parameters such as laser power, scanning velocity and powder mass flow rate on clad height, clad width and depth penetration into the substrate. An analysis of variance (ANOVA) was performed to investigate the influence of processing parameters in the form of single cladding layer and hardness of coating. They also presented a prediction of laser clad geometry
concluded that clad height increased with powder mass flow rate and laser power and decreased with scanning velocity. The depth of penetration increased with laser power and powder mass flow rate. The clad width increased with powder mass flow rate.
The present work investigates the parametric effects of laser cladding parameters such as laser power, scan speed and powder feed rate on performance evaluation parameters namely clad height and clad width and a process optimization for the selection of optimal parameters combination using response surface methodology (RSM). The result of optimization can be used to set the process parameters at optimum level for the better clad quality during laser cladding operation. The result obtained through RSM technique can also be compared with other optimization
method like genetic algorithm, scatter search approach etc. A 3.5 kW continuous wave CO2 laser has been used to
perform the present work.
2.EXPERIMENTAL DETAILS
2.1Selection of Materials
The experiments are performed on Φ 3 inches x 0.5 inch thick specimens of commercial mild steel (S235).
The surfaces of the substrate are sand blasted prior to laser cladding. The powder (feeding material) used in laser cladding is a mixture of nickel, chromium and molybdenum powder. The powder particles are of globe-shaped with size of 45-106 µm. Chemical composition of the powder is shown in Table 1. In order to improve the surface characteristics of this substrate an anticorrosive powder material is used as the clad material. It is a non-magnetic, corrosion and oxidation resistant. Nickel and chromium provide resistance to oxidizing environment, while nickel and molybdenum to non-oxidizing environment. Pitting and crevice corrosion are prevented by molybdenum.
Table 1. Composition of feeding powder
Elements Chromium Molybdenum Nickel
Percentage in weight 20% 5% Bal.
2.2Design of Experiments
The running expense for each experiment is relatively high which leads to need of design of experiment. The design of experiment is a statistical tool which helps to minimize the number of experiments so that appropriate data will be collected, the minimum number of experiments will be performed to acquire the necessary technical information and suitable statistical methods will be used to analyze the collected data. The initial task of this stage is to find out the key process control parameters with their ranges and performance evaluation parameter (output) that is to be measured. The levels of each variable represent the range for which the effect of that variable is desired to be known.
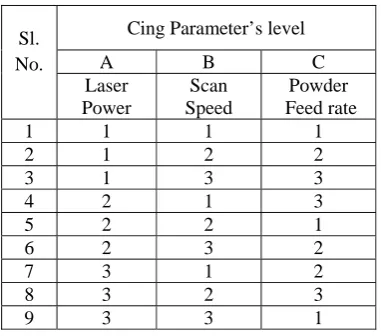
Taguchi's method for experimental design is straightforward and easy to apply to many engineering situations, making it a powerful yet simple tool [9]. In order to minimize the number of experiments, the experiments are planned against a three level Taguchi’s Orthogonal Array that required 9 runs in total to be carried out. The reason for selecting the three levels of each parameter is that the third level for a factor facilitates investigation of a quadratic relationship between the response and each of factors.
The process parameters of laser power, scan speed of table and powder feed rate were varied to investigate the
Table 2. Experimental layout using an L9 orthogonal array
Sl. No.
Cing Parameter’s level
A B C Laser
Power
Scan Speed
Powder Feed rate
1 1 1 1
2 1 2 2
3 1 3 3
4 2 1 3
5 2 2 1
6 2 3 2
7 3 1 2
8 3 2 3
9 3 3 1
2.3 Experimentation
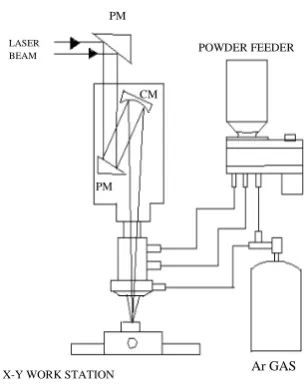
The equipment used for laser cladding is a 3.5 kW continuous wave CO2 Laser Rapid Manufacturing
(LRM) system. The LRM set-up consists of a high power laser system integrated with the beam delivery system, powder feeding system and job/beam manipulation system [10]. Fig. 2 depicts the schematic arrangement of the LRM machine. Ni-Cr-Mo powder has been fed into the molten pool using a volumetric-controlled powder feeder through a co-axial powder feeding nozzle. Argon gas is used as a shielding gas and powder carrier. The key process parameters are selected from the literature survey and those are laser power, scan speed and powder feed rate. First a number of single tracks are deposited at various machining conditions to obtain continuous and uniform tracks which lead to facilitate to determine the range of process parameters for control levels in Taguchi method (Table.3).
Then the actual experiments are performed as per the L9 Taguchi orthogonal array. Focal length (f=2 mm) and
Table 3:Control factors and their levels
Control factors Levels
1 2 3 A. Feed rate (gm/min) 5 8 11
B. Scan speed (m/min) 0.3 0.5 0.8
C. Laser power (kW) 1 1.25 1.5
Fig. 2:The schematic arrangement of experimental – LRM - set-up
3. Results and Discussion
3.1 Influence of process parameters on clad height
-The parametric influences of laser process parameters on clad height are presented as response surface plots and these are given in Figs.5 (a), (c), (e). To show the combined effect of any two cladding parameters on the clad height the third parameter is kept constant. For example the effect of laser power, scan sped on clad height is shown in Fig.5 (a) as response surface plot while keeping constant powder feed rate at 8 gm/min. From Fig.5 (a) it is observed that with increase of laser power and scan speed clad height increases with different gradient. Because, when the laser power is high, the incident energy of laser beam is more, and consequently the amount of melted material is more which leads to more deposition on the substrate. On the other hand when the scan speed is low, the accumulation of powder material on the substrate is more which is not sufficient for melting by the same laser power. From Fig.5 (e) it is seen that increase of powder feed rate at higher scan speed the clad height is high.
Fig.3. A photograph of laser clad beads with Ni-Cr-Mo powder on mild steel substrate using 3.5 kW CO2 laser
Fig.4. Geometry of cross-section of a single layer and single bead clad
POWDER FEEDER
Ar GAS PM
PM
CM
LASER BEAM
0.30 0.40 0.50 0.60 0.70 0.80 1.00 1.10 1.20 1.30 1.40 1.50 0.1 0.15 0.2 0.25 0.3 0.35 0.4 C lad Hei g ht
A: Laser power B: Scan Speed
1.00 1.10 1.20 1.30 1.40 1.50
0.30 0.40 0.50 0.60 0.70
0.80 Clad Height
A: Laser power
B: Scan Sp eed 0.15 0.2 0.25 0.3 0.35
1.00 1.10 1.20 1.30 1.40 1.50
5.00 6.00 7.00 8.00 9.00 10.00
11.00 Clad Height
A: Laser power
C : P o wd er Fe ed ra te 0.1 0.15 0.2 0.25 0.3 5.00 6.00 7.00 8.00 9.00 10.00 11.00 1.00 1.10 1.20 1.30 1.40 1.50 0.05 0.1 0.15 0.2 0.25 0.3 0.35 Cl a d He ig h t
A: Laser power C: Powder Feedrate
The combined effect of two process variables on clad height can also be interpreted with the contour plot diagram as shown in Fig.5 (b), 5(d), 5(f). From Fig. 5 (c) it is seen that at constant laser power and powder feed rate at 8 gm/min clad height increases slowly with the decrease of scan speed. From Fig. 5 (f) it is seen that at 1.25 kW laser power clad height increases highly with the increase of either scan speed or powder feed rate. But form Fig. 5 (d) it is seen that clad height first decreases and then increases with the increase of either laser power or powder feed rate while scan speed is constant at 0.55 m/min.
(a) (b)
(c) (d)
(kW)
(gm/min)
5.00 6.00 7.00 8.00 9.00 10.00 11.00 0.30 0.40 0.50 0.60 0.70 0.80 0 0.1 0.2 0.3 0.4 0.5 C lad H ei g ht
B: Scan Speed C: Powder Feedrate
0.30 0.40 0.50 0.60 0.70 0.80
5.00 6.00 7.00 8.00 9.00 10.00 11.00
B: Scan Speed
C: Po wder F eedr ate 0.1 0.2 0.3 0.4
1.00 1.10 1.20 1.30 1.40 1.50
0.30 0.40 0.50 0.60 0.70
0.80 Clad Width
A: Laser power
B: Scan Sp eed 3 3.5 4 4.5 0.30 0.40 0.50 0.60 0.70 0.80 1.00 1.10 1.20 1.30 1.40 1.50 2.5 3 3.5 4 4.5 5 C lad W idt h
A: Laser power B: Scan Speed
Fig.5. Response Surface and Contour plot for clad height: (a) Response surface (b) Contour plot for Combined Effect of Laser power and scan speed, (c) Response surface (d) Contour plot for Combined Effect of Laser power and powder federate, (e) Response surface (f) Contour plot for
Combined Effect of Scan speed and powder federate
3.2 Influence of process parameters on clad width
The effect of variation of process parameters on clad width is shown as response surface plot and contour plot in Fig.6. It is observed that with increase of laser power and scan speed, clad width increases. Similarly it is found that with the increase of laser power and powder feed rate clad width increases as more powder material naturally leads to higher clad width. But at higher laser power clad width increases very slowly with the powder feed rate. In Fig.6(c) it is seen that clad width increases very slowly with the increase of powder feed rate at constant laser power and fixed scan speed. The possible reason is the same as discussed earlier in respect of effect process parameters on clad height.
With clad width as response, the contour plots of the quadratic model (Response Surface) with one variable kept at central level and the other two varying within the experimental ranges are shown in Fig. 6 (b), (d), (f). It is seen that there are significant interactive effects on clad width between laser power, scan speed and powder feed rate.
(m/min)
(gm/min)
(m/min)
(kW)
(e) (f)
5.00 6.00 7.00 8.00 9.00 10.00 11.00 1.00 1.10 1.20 1.30 1.40 1.50 2.8 3 3.2 3.4 3.6 3.8 4 4.2 4.4 C la d W idt h
A: Laser power C: Powder Feedrate
1.00 1.10 1.20 1.30 1.40 1.50
5.00 6.00 7.00 8.00 9.00 10.00
11.00 Clad Width
A: Laser power
C: P o wde r Fe ed ra te 3 3.2 3.4 3.6 3.8 4 4.2
0.30 0.40 0.50 0.60 0.70 0.80
5.00 6.00 7.00 8.00 9.00 10.00
11.00 Clad Width
B: Scan Speed
C: P o w der Fee d rate 3 3.5 4 4.5 5.00 6.00 7.00 8.00 9.00 10.00 11.00 0.30 0.40 0.50 0.60 0.70 0.80 2.5 3 3.5 4 4.5 5 C lad W id th
B: Scan Speed C: Powder Feedrate
(c) (d)
\
(e) (f)
Fig.6 Response Surface and Contour plot for clad width: (a) Response surface (b) Contour plot for Combined Effect of Laser power and scan speed, (c) Response surface (d) Contour plot for Combined Effect of Laser power and powder federate, (e) Response surface (f) Contour plot for
Combined Effect of Scan speed and powder federate
4. Response Surface Methodology
Response Surface Methodology (RSM) can be regarded as a statistical technique for optimizing the objective functions through some mathematical methods. Basically, this involves doing several experiments. Using the result of one experiment, direction for what to do next is provided [11]. The field of RSM consists of the experimental strategy for exploring the space of the process or independent variables, empirical statistical modeling to develop an appropriate approximating relationship between the yield and process variables and optimization methods for
(kW)
(gm/min)
finding the values of process variables that produce desirable values of the response [12]. The main objective of RSM is to find the combination of factor levels to achieve the optimal response.
In the present work the RSM is used to study the parametric effect of process parameters on laser clad quality. The result of experiment is used to develop the regression model as discussed in the following section. The effect of laser power, scan speed and powder feed rate on clad height as well as clad width is shown graphically in Fig.5 and Fig.6. by constructing the response surface and contour diagram.
4.1 Regression Model Equation using RSM
Multiple regression analysis (MRA) is one of the most widely used statistical techniques for analyzing multifactor data [13]. In the present work a regression model is developed by establishment of correlation between the process control parameters such as laser power, scan speed and powder feed rate with the output parameters namely clad height and clad width, one can use this relationship in various algorithms. A quadratic regression model for two responses- clad height(H) and clad width (W) are developed based on experimental results using MINITAB software of version 13. This model will help to predict the response as a function of independent variables and their interactions.
In order to obtain the second-order response surface model equation the following equation may be assumed-
Where Yu is the predicted response, β0 the intercept coefficient, βi the linear terms, βii the squared terms, βij the
interaction terms, xiu and xju are coded levels of the process control variables, the residual, eu measures the
experimental error of the u-th observation and n is the total number of designed variables [14, 15]. The coefficients of the model for the corresponding response are estimated using multiple regression analysis technique included in RSM. The response surfaces of clad height and clad width can be expressed by the following quadratic equations in tems of coded factors.
Clad Height (mm) = 0.15 - 0.015 * A - 0.082 * B + 0.067* C + 0.030* A * B - 0.065 * A * C - 0.068 * B * C + 0.042* A2 + 0.063* B2 …..(4.2)
Clad Width (mm) = 3.75 + 0.31* A - 0.78* B + 0.37* C + 0.23* A * B - 0.28* A * C + 0.14* B * C + 0.070* A2 + 0.10* B2 …..(4.3)
Where, A= Laser Power (kW) B= Scan Speed (mm/min) C = Powder Feed rate (gm/min)
4.2 Model adequacy checking
Generally, it is necessary to check the fitted model to ensure that it provides a tolerable approximation to the real system. Unless the model shows an adequate fit, proceeding with the investigation or optimization of the fitted response surface may give poor or misleading results. The residuals from the least square method play an important role in judging model adequacy. A check is made for the normality assumption, by constucting a normal probability plot of the residuals as shown in Fig.7. The normality assumption is satisfied as the residual plot approximated along a straight line. Fig.8 presents a residual versus predicted response plot. It is seen that residuals scatter randomly on the display, suggesting that the variance of the original observation is constant for all values of response. Both of the
2 0
1 1
n n n
u i iu ii iu ij iu ju u
i i i j
Y
β
β
x
β
x
β
x x
e
= = <
Predicted
Int
er
nal
ly
S
tudent
iz
ed
R
es
idua
ls
-3.00 -1.50 0.00 1.50 3.00
0.12 0.18 0.23 0.29 0.35
Internally Studentized Residuals
N
or
m
al
%
P
roba
bi
lit
y
-1.34 -0.67 0.00 0.67 1.34
1 5 10 20 30 50 70 80 90 95 99
plots (Fig.7 and Fig.8 ) are satisfactory, so it can be concluded that the developed mathematical model is good enough to describe the clad bead dimension by respone surface methodology.
5. Multi-objective optimization for clad bead geometry
To obtain the process variables’ combination for superior clad bead geometry (W/H ≤ 15) during laser
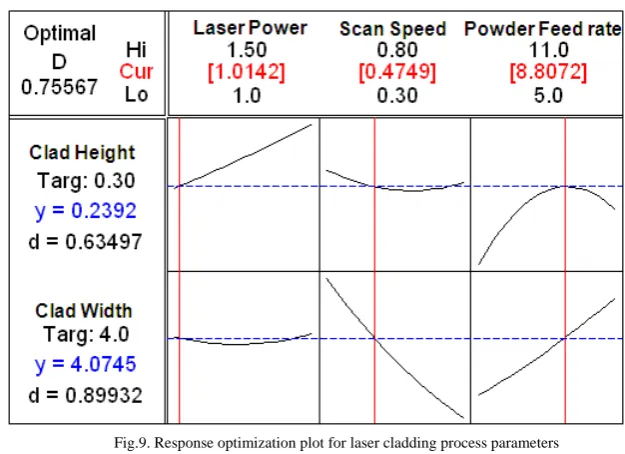
cladding operation, the multi objective optimization method is applied based on Response Surface Methodology (RSM). RSM based optimization technique produces a unique and powerful optimization discipline that differs from traditional practices. This approach can economically satisfy the needs of problem solving and design optimization with minimum number of experiments without the need for process model developments [16]. Here the goal is to maximize the clad bead geometry parameters. Therefore, “Larger-the- better” criteria are chosen during optimization technique. Fig.9 shows the multi-rsponse optimization result for the present set of experimental investigation during laser cladding process for mild steel. It is observed from this figure that the parametric combination during multi-objective optimization of both the responses i.e. clad height and clad width was achieved at laser power of 1.0142 kW, scan speed of 0.4749 mm/min and powder feed rate of 8.8072 gm/min. During multi-objective optimization the clad bead geomtry responses are optimized with consideration of composite desirability (D) value of 0.75567. One validation experiment is conducted at some feasible value close to each of process parameters (1 kW laser power, 0.5 mm/min scan speed and 9 gm/min powder feed rate) obtained at optimal parametric setting condition and the measured clad dimension is compared with RSM predicted optimal results.
The result obtained from multi-objective optimization method is applied to laser cladding process for
achieving improved clad quality and absolute prediction error is calculated with respect to experimental data using Eqn. 5.1 and shown in Table:4. It is seen that the prediction errors at optimal parametric condition of the present model are within acceptable range. Therefore, it can be concluded that proposed empirical models can successfully predict the clad bead geometry- clad height and clad width during laser cladding operation for mild steel material.
Fig.7. Plot of Normal percentage probability versus internally Studentized Residuals
Fig.9. Response optimization plot for laser cladding process parameters
Table 4. Validation experiment at multi-objective optimization setting
Responses
Multi-objective optimization of clad geometry- clad
height and clad width Prediction error in
percentage
RSM predicted result Experimental result
Clad height-H (mm) 0.23916 0.25 4.336 %
Clad width-W (mm) 4.07450 3.85 5.83117 %
6. Conclusion
The present paper addresses the application of CO2 laser cladding process to mild steel surface and the
influence of process parameters on clad bead dimensions. The results of experiment are extended to develop the regression model using response surface methodology (RSM). Multi-objective optimization is done to find out the
optimal parametric setting to achieve desired clad bead dimension with aspect ratio ≤ 15, during laser cladding
process. The optimization result shows that at laser power of 1.014 kW, scan speed of work table at 0.475 mm/min, and powder feed rate of 8.807 gm/min, both the responses clad height and clad width are optimized at 0.25 mm and 3.85 mm respectively. From the regression model it is experienced that scan speed of work table and powder feed rate are most significant parameter in laser cladding process. The range of these parameters should be selected carefully, because the clad quality is very sensitive to these responses. The response surface methodology is found to be effective for the identification of key process parameters and development of significant relationship between the process variables and response.
References
[1] Hans Gedda, Laser surface cladding a literature survey, 2000:07. ISSN: 1402-1536. ISRN: LTU-TR—00/07—SE.
[2] Yanxiang Li, Jian Ma, Study on overlapping in the laser cladding process, Surface and Coatings Technology 90 (1997) l-5 [3] Kathuria K., Laser-cladding process: a study using stationary and scanning CO2 laser beams. Surf Coat Technol 1997; 97:442–7.
[4] L. Shepeleva, B. Medres, W.D. Kaplan, M. Bamberger, A. Weisheit, “Laser cladding of turbine blades”, Surface and Coatings Technology 125 (2000) 45-48.
[7] J Paulo Davim, C Oliveira, and A Cardoso, Laser cladding: an experimental study of geometric, DOI: 10.1243/09544054JEM641 form and hardness of coating using statistical analysis.
[8] Godfrey C. Onwubolu, J.Paulo Davim, Carlos Oliveira, A. Cardoso, Prediction of clad angle in laser cladding by powder using response surface methodology and scatter search, Optics & Laser Technology 39 (2007) 1130–1134.
[9] Uğur Eşme, Application of Taguchi Method for the Optimization of Resistance Spot Welding Process, The Arabian Journal for Science and Engineering, Volume 34, Number 2B.
[10] C.P. Paul, P. Ganesh, S.K. Mishra, P. Bhargavaa, J. Negib, A.K. Nath, Investigating laser rapid manufacturing for Inconel-625 components. In: Optics & Laser Technology 39 (2007) 800–805
[11] Response-Surface Methods in R, Using rsm, Russell V. Lenth, Journal of Statistical Software, 28 July 2010.
[12] Bappa Acherjee , DiptenMisra, Dipankar Bose , K.Venkadeshwaran, Prediction of weld strength and seam width for laser transmission welding of thermoplastic using response surface methodology, Optics & Laser Technology 41 (2009) 956–967.
[13] J. Paulo Davim, Carlos Oliveira, A.Cardoso, Predicting the geometric form of clad in laser cladding by powder using multiple regression analysis (MRA, Materials and Design 29 (2008) 554–557.
[14] Montgomery DC. Design and analysis of experiments. 5th Edition. New York: Wiley; 2001.
[15] Optimization of coagulation–flocculation process for a paper-recycling wastewater treatment using response surface methodology, Jian-Ping Wang, Yong-Zhen Chen, Xue-Wu Ge, Han-Qing Yu , Colloids and surfaces A: Physicochem. Eng. Aspects 302 (2007) 204–210. [16] V.N. Gaitonde, S.R. Karnik, B.T. Achyutha, B. Siddeswarappa, Taguchi optimization in drilling of AISI 316L stainless steel to minimize