This may be the author’s version of a work that was submitted/accepted for publication in the following source:
Hine, Julian &Kamruzzaman, MD
(2012)
Journeys to health services in Great Britain: An analysis of changing travel patterns 1985-2006.
Health and Place,18(2), pp. 274-285.
This file was downloaded from: https://eprints.qut.edu.au/46563/
c
Consult author(s) regarding copyright matters
This work is covered by copyright. Unless the document is being made available under a Creative Commons Licence, you must assume that re-use is limited to personal use and that permission from the copyright owner must be obtained for all other uses. If the docu-ment is available under a Creative Commons License (or other specified license) then refer to the Licence for details of permitted re-use. It is a condition of access that users recog-nise and abide by the legal requirements associated with these rights. If you believe that this work infringes copyright please provide details by email to [email protected] License: Creative Commons: Attribution-Noncommercial-No Derivative Works 2.5
Notice:Please note that this document may not be the Version of Record (i.e. published version) of the work. Author manuscript versions (as Sub-mitted for peer review or as Accepted for publication after peer review) can be identified by an absence of publisher branding and/or typeset appear-ance. If there is any doubt, please refer to the published source.
Journeys to Health Services in Great Britain: An Analysis
of Changing Travel Patterns 1985-2006
Julian Hine a, Md. Kamruzzaman b 1
a Built Environment Research Institute, University of Ulster, Shore Road, Newtownabbey,
County Antrim, BT37 0QB, Northern Ireland, UK.
b
Urban and Regional Planning Discipline, School of Urban Development, Queensland University of Technology, 2 George Street, Brisbane 4000, Queensland, Australia.
1
Corresponding author. Tel.: +61 (0)7 3138 2510; fax: +61 (0)7 3138 1170. E-mail addresses: [email protected] (Julian
Abstract
This paper examines changing patterns in the utilisation and geographic access to health services in Great Britain using National Travel Survey data (1985-2006). The utilisation rate was derived using the proportion of journeys made to access health services. Geographic access was analysed by separating the concept into its accessibility and mobility
dimensions. Regression analyses were conducted to investigate the differences between different socio-spatial groups in these indicators over the period 1985-2006. This study found that journey distances to health facilities were significantly shorter and also gradually
reduced over the period in question for Londoners, females, those without a car or on low incomes, and older people. However, most of their rates of utilisation of health services were found to be significantly lower because their journey times were significantly longer and also gradually increased over the periods. These findings indicate that the rate of utilisation of health services largely depends on mobility level although previous research studies have traditionally overlooked the mobility dimension.
Keywords
1. Introduction
This paper examines changes in the patterns of utilisation and geographic access to health services and also investigates the relationships between these in Great Britain (GB) over the period of 1985-2006. Although this type of analysis is not new, with work in other countries having been completed (for example in the USA (Buchmueller et al., 2006; Luo et al., 2004), China (Akin et al., 2005), India (Kumar, 2004), and Costa Rica (Rosero-Bixby, 2004)), a longitudinal analysis of data over a twenty year period has rarely been reported in the literature. In addition, no research has been conducted which examines the dynamics of health journeys in the context of GB with the exception of a number of studies that have examined changes in travel patterns associated with undertaking other types of activities such as commuting (Pooley and Turnbull, 2000; Titheridge and Hall, 2006), and shopping (De Kervenoael et al., 2006). Although the utilisation of health care facility depends on many factors (e.g. geographic, economic, cultural and political); geographic access has been identified as the most significant factor in underpinning the use of it (Kumar, 2004; Lovett et al., 2002; Rosero-Bixby, 2004).
Geographic access is a function of both access to opportunities (accessibility) and access to transport (mobility) (Battellino et al., 2005; Coyle et al., 2009; Hurni, 2006; Murawski and Church, 2009). This is largely due to the fact that despite being mobile, individuals may actually be unable to access health care due to the poor geographical distribution of services (inaccessibility) (Farrington-Douglas and Allen, 2005; Field, 2000; Stanley and Stanley, 2004). Whereas poor transport services can result in low or non-existent levels of mobility (immobility). Lovett et al. (2002) for example have shown that 13% of the population was not able to reach a GP in East Anglia due to the lack of daily bus services. This suggests that accessibility gains mean little when there is no viable means of transport for patients to access facilities (Murawski and Church, 2009).
and utilisation of health care facilities (Niggebrugge et al., 2005); and consequently changes in mobility patterns over time (see, Akin et al., 2005; Buchmueller et al., 2006; Chan et al., 2006; Kumar, 2004; Luo et al., 2004; Rosero-Bixby, 2004). Instead, geographic distance from population centroids (e.g. post code, census tract) to the nearest service has been used as an indicator of accessibility, and has found that utilisation patterns decrease exponentially with distance. Although this distance decay concept is well grounded in the health geography literature (Arcury et al., 2005; Målqvist et al., 2010; Nemeta and Bailey, 2000; Tanser et al., 2006), this type of accessibility measure is highly spatially aggregated and does not take into account the differential abilities and travel behaviours exhibited by different groups living in the same area. Consequently, these studies do not provide the relative distance decay behaviour associated with the utilisation of health services. For instance, a car-owning individual can traverse a distance with relative ease whereas a non-car owning individual finds it difficult if no other mode of transport is available.
It is clear therefore that there are two important issues which are related to the measurement of geographic access to health services. Firstly, a disaggregated approach is required which is also related to the fact that certain groups (e.g. high-income) do not necessarily travel to the nearest facility if they have better options (e.g. a private clinic) to choose from
(Buchmueller et al., 2006). Secondly, that even a disaggregated measure of the level of accessibility (e.g. individuals travel distance to healthcare) alone cannot capture evidence of the difficulties associated with travelling to a particular healthcare facility. As a result,
Although revealed preference travel data such as travel distance and travel time have been widely used to identify patterns of accessibility and mobility in transport research, the application of these indicators to identify geographic access and consequently the rate of utilisation of health services is very rare (see, Buliung and Kanaroglou, 2006; Kamruzzaman et al., 2011; Morency et al., 2011; Schönfelder and Axhausen, 2003). Martin et al. (2002) have identified that a lack of sufficient empirical data covering wider geographic areas hinders the development of research opportunities using indicators such as journey time and journey distance. Due to a lack of empirical data, Chan et al. (2006) have derived measures of travel time and travel distance using Medicare billing data in five states (Alaska, Idaho, North Carolina, South Carolina, and Washington) in the US. This data contains ZIP codes both for the physician providing the care and patients, and as a result, allowed the
calculation of realised travel distance and approximate travel time using the fastest route between the ZIP codes.
al., 2006; Field, 2000; Higgs, 1999; Luo et al., 2004; Panelli et al., 2006; Wellstood et al., 2006).
2. Changes in health and transport policies in GB
Although both transport and health policies have witnessed a number of key changes since the 1950s, the lack of transport as a barrier to access health services was not readily identified in GB until the beginning of this decade. Both policy areas have, however, been subject to reforms where cost containment and increasing competition rather than improving access to health services have been key policy objectives. A number of studies have dealt with the changes made between the 1950s and 2000 and is therefore not discussed here in detail (see, Bond, 1997; Glaister et al., 1998; Ham, 1996; Maynard and Bloor, 1995; Shaw et al., 2009; White and Farrington, 1998; Young, 1996). Briefly, the notable changes in
transport policy can be summarised as the deregulation of local bus services under the Transport Act 1985 which came into effect from October 1986. The impacts of this deregulation have been documented as a decline in passenger trips, a growth in
bus-kilometres travelled, an increase in average trip length, a rise in fares, and a restructuring of routes (White and Farrington, 1998). Rail privatisation, started in 1992 and completed in 1997, increased rail patronage and consequently reduced road traffic volumes (Knowles, 1998).
Key changes in health policy include the creation of a ‘quasi-market’ in 1990 by separating purchasing and provision functions of the NHS (National Health Services) and local
choose four elective care providers for their treatment (started in 2005) (Brereton and Vasoodaven, 2010; Department of Health, 2000). Devolution gave the Northern Ireland Assembly, Scottish Parliament, and National Assembly for Wales great power over health and transport services in 1998. They now receive block grants that are not related to need but can be spent as they choose (Greer, 2009).
During early 2000, a number of transport studies, such as those conducted by the
Department of the Environment, Transport and the Region (2000) in England, Church et al. (2000) in the context of London, and Hine and Mitchell (2001) in the context of Scotland, used a variety of travel data to establish a link between transport disadvantage and a lack of access to health facilities. These studies highlighted the need for a greater integration of transport and health policy. As a result, in 2003, the publication of an influential report from the Social Exclusion Unit entitled ‘Transport and Social Exclusion: Making the Connections’ addressed the problems associated with accessibility to a range of local services including health care (Hamer, 2004; Preston, 2009; Social Exclusion Unit, 2003). The report
highlighted that those transport disadvantaged groups such as people on low incomes, those without access to a car, older people, and those living in rural areas have faced difficulty in making journeys from their homes to health services. This is largely due to the fact that most of the NHS services and facilities are largely inaccessible by public transport (Social
Exclusion Unit, 2003). As a result, it is required now to conduct accessibility planning
analysis to key services for the preparation of local transport plans (Cass et al., 2005; Currie and Stanley, 2008; Farrington and Farrington, 2005). In addition, positive outcomes were evident on a number of key policy objectives including the improvement of health by
Moreover, the Department of Health (2003b) emphasised the importance of improving the accessibility of health services in its cross-government programme ‘Tackling Health
Inequalities: A Programme for Action’. Emphasis in this was placed on giving greater priority to accessibility when making decisions on the location of new hospitals and primary
healthcare facilities, and also on the review of eligibility criteria for patient transport services1 and the hospital travel cost scheme2. As yet the Department of Health has not made any improvement in these schemes and they have strongly been criticised (Citizens Advice, 2004; Farrington-Douglas and Allen, 2005). Patient access is also being prioritised in the modernisation of the NHS. The NHS Plan sets out the 10 year programme to transform the health service so that it is redesigned around the needs of patients (Department of Health, 2000). While recognising the need to maintain specialist treatment centres, the focus is on improving accessibility through the development of primary care services, particularly in disadvantaged areas, and the provision of local treatment services and the use of information technology. The development of high quality, sustainable solutions for local services, including provision of smaller hospitals at the heart of local communities, was set out in the Keeping the NHS Local: A New Direction of Travel (Department of Health, 2003a). Since the formation of the new Coalition Government, two white papers concerned with geographic access to health services were published in 2010. These included: Equity and excellence: Liberating the NHS (Department of Health, 2010a), and Healthy Lives, Healthy People: Our Strategy for Public Health in England (Department of Health, 2010b). The first white paper aims to increase expenditure to enhance accessibility to health services by providing better choices to any service provider including a consultant-led team, GP practice, treatment, and maternity services. The second white paper aims to reduce service need by promoting healthy lifestyles (e.g. increasing the number of health visitors for counselling, offering Olympic and Para-Olympic style sports competition at schools, launching physical
1
An ambulance service is provided by hospitals to bring patients classified as having medical need for transport
from home to hospital.
2
activity initiatives for active ageing). Therefore, the focus of the latter white paper is similar to that the smarter choice strategies and both stress more on preventative measures to
maintain health than curative health measures.
3. Methodology
National Travel Survey (NTS) data, available from the UK Data Archive, for the periods of 1972-73, 1975-76, 1985-86, 1988-95, 1995-01, and 2002-06 were downloaded and used in this research (Department for Transport, 2006; UKDA, 2010). The NTS collects self-reported travel diary data for seven days and is the main source of data on personal travel in GB. The NTS has long been used for decision making in a number of policy arenas such as transport, education, revenue and customs, environment, and food and rural affairs (Anderson et al., 2010). This data has also been extensively used by researchers since its inception
(Landrock, 1981; Stead, 1999; Whelan, 2007). Variables from four different record types (datasets) within the databases of each period were found to be important for this research including the primary sampling unit (PSU), households, individuals, and journeys. These different datasets within each period were merged using their associated unique identifiers. However, variables that were consistently used in these surveys over this time period were only used in this research. These include: planning region, and type of area from the PSU
dataset; household yearly income, car-ownership status, and home-ownership status from
the households dataset; individuals’ age, marital status, gender, travel difficulties,
occupation, and driving licence from the individuals dataset; and journey purpose, mode of travel, overall travel time, overall journey time, and overall journey distance from the
journeys dataset. Travel time is measured as the time spent travelling only excluding waiting
the remaining four periods, health related trips have been coded as ‘personal business medical’. These personal business medical trips include a visit to a doctor, dentist, optician, chiropodist, chemist and hospital (not just to visit). A total of 51725 individual trips were found to relate to the personal business medical category of trips reported in these four time periods (4638, 5320, 13388, and 28379 individual trips for the period of 1985-86, 1988-95, 1995-2001, and 2002-06 respectively) and were analysed in this research.
Variables extracted from the different datasets were reclassified and recoded in order to maintain consistency between different time periods if needed. For instance, a quintile classification of the household income variable was made to maintain the relativity of income thresholds over the different time periods. Variables from the PSU, households, and
individuals datasets were used as explanatory variables. Whereas, variables extracted from
the journeys dataset were used as dependent variables to identify patterns of utilisation i.e.
the proportion/percentage of journeys made by different groups to access health facilities in a particular journey distance or journey time band or by using a certain mode of transport (Goddard and Smith, 2001); modal split, and geographic access to health services. A binary logistic regression analysis was conducted to identify the utilisation rate over the different time periods between different groups. This analysis shows the Odds Ratios (ORs) for different groups making a trip to utilise health services compared to their respective
counterparts. Linear multiple regression analyses were conducted to then identify patterns of change in the accessibility and mobility levels of these groups.
A correlation analysis was conducted using the overall travel time (min) and overall journey time (min) associated with the 51725 individual trips. Figure 1a shows that these two dependent variables are highly inter-correlated. As a result, only the overall journey time variable is reported in this paper. This is due to the fact that journey time captures more complexity in the travel behaviour of different groups when making a health journey. A
are significantly correlated; only 45% of the observed variation in journey time can be explained by journey distance. As a result, the journey distance variable was also analysed in this research, in addition to journey time, to explore patterns of travel. This is because journey time varies according to the mode choice even though journey distance remains the same (Martin et al., 2002). In this study journey time and journey distance variables were not found to be normally distributed, a natural logarithmic transformation of these variables was made which produced a better fit , this is a widely used method in the travel behaviour research (Frank et al., 2000; Morency et al., 2011).
The part and partial correlations and the multicollinearity analysis results, using all the explanatory variables entered in the regression model show that a number of explanatory variables such as marital status, driving licence, occupation, home-ownership status, and travel difficulties had a lower level of tolerance value and a higher level of variance inflation factor (VIF). The collinearity diagnostics also confirmed that there were serious problems with multicollinearity. Several eigenvalues were found to be too close to 0, indicating that the predictors were highly inter-correlated and that small changes in the data values might lead to large changes in the estimates of the coefficients. As a result, these explanatory variables were excluded from the models and the models were tested again. The resulting analysis showed that none of the remaining explanatory variables had a multicollinearity problem. In addition, Table 1 shows that the representation of samples from Wales and Scotland within the planning region variable is much lower when compared to sample sizes from England. As a result, the planning region variable was also excluded from analysis in order to avoid a representativeness bias.
4. Results
4.1 Descriptive analysis
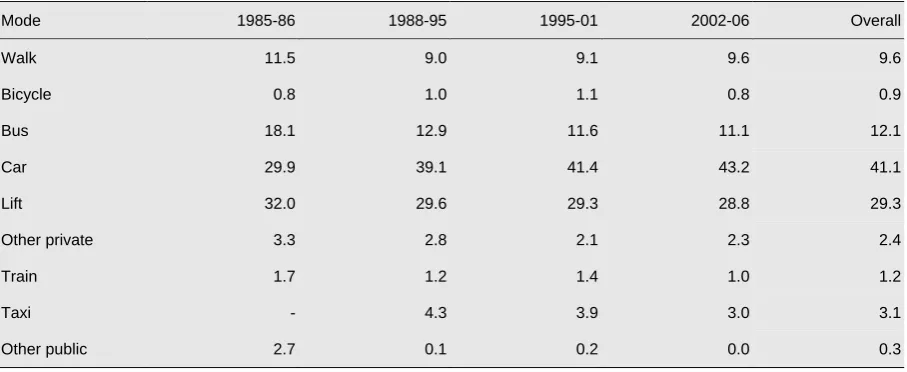
2, is the increase in the proportion of car trips to health facilities whereas the number of trips using the bus, taxi, train, taking lifts, and trips undertaken by other private and public
transport decreased over these time periods. Although the proportion of walk trips decreased by 2.5% over the period 1985-86 to 1988-95, this trend, however, reversed in the following time periods. Bicycle use, however, gradually increased until the 1995-01 period, when it returned back to the same level (0.8%) as was found in the initial period (1985-86).
Figure 2 shows the distance and time decay patterns associated with the utilisation of health services in GB based on travel mode. A similar distance decay pattern can be found
between the first two time periods (1985-86 and 1988-95) and between the last two time periods (1995-01 and 2002-06). A double peak in the distance decay curves associated with the utilisation of health services was evident in all periods when the car or bus was used as a transport mode. However, the location of these peaks decreased over the time period under investigation. A single peak located close to the respondents’ home location is a dominant pattern in the utilisation of health services when people walked. The location of this peak has however decreased as walking has become a less important mode of transport. The utilisation rates also drop sharply when walking distance is increased to 2.5 miles. The time decay curves remain stable during the periods in which the utilisation rate decreased exponentially with travel time for the car, and in which the utilisation peak was found to be located around 23 minutes away when individuals walked or used the bus.
Table 3 and Figure 2 show that individuals walked to health services that were located less than 1.5 miles away. Due to the existence of two peaks in the data, one located at around 1-1.5 miles away and the other at around 4-5 miles away (Figure 2), Table 3 shows that the average bus journey distances to access health facilities were at a distance range of
periods which was reduced to at around 4 miles away from home during the last two survey periods (Figure 2). There are two implications associated with this finding. Firstly, that individuals frequently used the car to access health facilities even though it was located within waking distance. Secondly, that due to the existence of the second peak in utilisation, the average journey distance associated with car use increased to around 5 miles (Table 3). Despite bus journey distances being shorter than those associated with the car, the average journey times associated with using the bus were found to be double that of the car (at around 30 minutes compared to about 15 minutes) (Table 3 and Figure 2). Average journey distances for those taking lifts were found to be longer than car trip lengths in all time periods which suggests that individuals took lifts only when their required health services were located at more distant locations. Consequently, journey times associated with taking lifts were found to be higher when compared to car journey times in these periods. By
comparison the train was only used for accessing destinations located more than 15 miles away. The average journey time associated with using the train was found to be more than an hour in all survey time periods.
4.2 Regression analysis
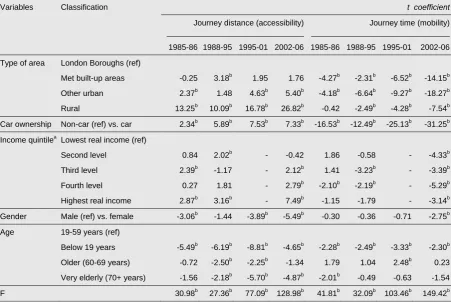
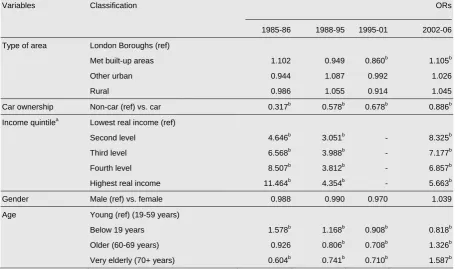
Table 4 shows the t coefficients from the linear regression analysis results using journey distances and journey times as dependent variables over the different time periods. These, therefore, represent the patterns of change in geographic access (accessibility and mobility) to health services between the different socio-spatial groups considered in this research whereas Table 5 shows the patterns of change in the utilisation of health services between these groups over the different survey time periods. The following subsections discuss these changing patterns for different user groups. An effort has also been made to examine the impacts of changing patterns of geographic access on the utilisation of health services by these groups.
4.2.1 Area type
Table 4 shows that journey distances were significantly higher in metropolitan built up areas, other urban areas, and rural areas in all four survey time periods when compared to journey distances in the London boroughs. This difference was also found to have grown over the time periods under investigation. Despite journey distances gradually increasing in these areas, journey times were, however, found to be significantly lower in all areas except the London boroughs. In addition, journey times were found to be decreased gradually in all these areas over the period 1985 - 2006. Despite these changing levels of accessibility and mobility, little difference was, however, found to exist between different types of areas in the utilisation of health services (Table 5).
found to be significantly higher. A similar pattern also existed in the period 1988-95 for both areas. No utilisation of health services was found to be evident within a distance of 1 mile from home in the first two survey time periods, although the later two periods witnessed some utilisation. The rate of utilisation was found to be much higher in the London boroughs (17-21%) compared to that of rural areas (12%). Another peak was also evident at a
distance of 4 miles away from home for these areas in these periods. Consequently, the average journey distance remained higher in rural areas.
Despite utilisation rates being higher at longer distances from home for rural dwellers in all periods, 45% visits were found to take only 10 minutes for rural dwellers compared to 30% of visits in London boroughs in all time periods. With this exception the time decay curves remained almost identical in both areas and consequently the average journey times remained significantly lower in rural areas.
4.2.2 Car-ownership
yet their journey times were found to be higher over the same period of time. Despite these differences, car-owing individuals were found to be less likely to visit health services in all time periods although the differences in the utilisation rate between car owners and non-car owners were found to have reduced (Table 5).
4.2.3 Household income
No specific pattern was found to exist in terms of the effect of household income level on accessibility and mobility levels for the first two periods (1985-86 and 1988-95). In these periods, Table 4 shows that although higher income groups travelled a significantly longer distance, their travel times were found to be significantly lower in some instances. A more specific pattern was found to exist in the latest NTS survey period (2002-06). Table 4 shows during this period journey distances increased with income level, in other words higher income households travelled a significantly larger distance to access health facilities in this period. As in previous periods (1985-86 and 1988-95), these higher income individuals also spent a significantly shorter time travelling to health facilities when compared to those in the lowest income quintile group in this period (2002-06). Higher income groups, although travelling longer distances were found to have a higher rate of utilisation of health services due to their higher levels of mobility (Table 5). Figure 5 shows the distance/time decay behaviour of the highest and lowest income quintile group which was found to be similar to that of the car-owning and non-car owning groups. These findings suggest that a level of correlation therefore exists between car-ownership and household income in GB.
4.2.4 Gender
(White, 2009). Despite these differences in travel behaviour, no gender difference was evident in this research in terms of the utilisation of health care facilities in any of the time periods covered by the NTS (Table 5).
4.2.5 Age
Table 4 and 5 show a significant difference by age in the levels of accessibility, mobility, and utilisation of health services. Individuals aged below 19 years travelled a significantly shorter distance in all time periods, and consequently their travel times were also found to be
significantly lower compared to individuals aged between 19 and 59 years (Table 4).
Individuals aged over 60 although travelling shorter distances compared to individuals aged between 19 and 59 years, were found to have journey times similar to other age groups. Table 5 shows that individuals aged under 19 years, compared to those aged 19-59, visited health facilities at a significantly higher rate in the first two time periods (1985-86 and 1988-95) although their rates of utilisation were found to be significantly lower in the later two periods (1995-01 and 2002-06). Despite having shorter travel distances, older and very elderly individuals were found to be less likely to visit health services in the first three time periods (Table 5). However, their utilisation rate was significantly higher in the period 2002-2006 compared to individuals aged between 19 and 59 years.
5. Discussion and conclusion
distance to health services across different areas (e.g. metropolitan built up areas, rural areas) over different time periods (1985-2006), journey time also decreased in these areas over the same time period. This finding signifies a shift of health services towards larger facilities due to economies of scale which has necessitated the rise of larger travel distances outside of London whilst at the same time an improvement in mobility levels in these areas primarily due to rise of car-ownership levels. The reductions in overall journey time could also be due to a restructuring of bus routes after deregulation and a reduced level of congestion outside of London (Schafer and Victor, 2000; White and Farrington, 1998). Schafer and Victor (2000) noted that Londoners spent 30% more time travelling than people in other parts of GB.
Despite the reduction of journey distance to health facilities in the London boroughs over the period 1985-2006, journey time, however, increased. This suggests an increased level of congestion over this period. An increase in car ownership levels, which is also a faster mode of transport (as was found in Section 4) has failed to improve mobility levels in London. Another possibility could be due to the choice effects associated with health policy in London where the number of health care services providers have traditionally presented a wider range of choices (Whynes and Baines, 1998). Individuals also prefer to attend the closest health service to their place of residence and as a result, there is an expectation that journey time would have reduced due to a reduction in journey distance, however, data indicates an increase in journey time. This suggests the existence of a mismatch between the location of health facilities and the provision of transport services over the time period in question. This has been highlighted in the literature (Social Exclusion Unit, 2003); and as a result, the accessibility gain has therefore brought no benefit to individuals in terms of mobility for those living in the London borough areas (Murawski and Church, 2009).
found that the utilisation rate is inversely related to distance (Higgs, 1999; Lovett et al., 2002; Sherwood and Lewis, 2000). However, the distance decay curves presented in this research have not only partially captured this relationship but have also revealed that a ‘double’ peak is a common phenomenon in the distance decay function. Whereas the time decay curves have proved to be exponentially related to the utilisation rate in this research. The inverse relationship associated with the distance decay curve was found to hold where the increased distance increases journey time to health facilities. A number of groups such as males, individuals living in metropolitan areas, other urban and rural areas were found to travel a significantly longer distance to access health services than other groups. However, despite this their rates of utilisation of health services were found to be the same as their
counterparts because most of these individuals had an improved level of mobility (and as a consequence a lower journey time). An increased level of accessibility, however, failed to enhance utilisation of health services because this improvement in accessibility did not make a positive change in the mobility levels for certain groups (e.g. older individuals, very elderly individuals). In contrast, improved mobility has enhanced utilisation despite there being a poorer level of accessibility for higher income groups.
volume of car trips was due to a lack of alternative transport or due to an increase in the level of car-ownership.
6. Acknowledgement
The authors would like to thank the Editor (Prof Graham Moon) of this journal and the two anonymous reviewers for their insightful comments and suggestions.
7. Reference
Akin, J.S., Dow, W.H., Lance, P.M., Loh, C.-P.A., 2005. Changes in access to health care in China, 1989-1997. Health Policy and Planning 20, 80-89.
Anderson, T., Rofique, J., Pickering, K., Tipping, S., 2010. National Travel Survey 2009 Technical Report. Department for Transport, London.
Arcury, T.A., Gesler, W.M., Preisser, J.S., Sherman, J., Spencer, J., Perin, J., 2005. The Effects of Geography and Spatial Behavior on Health Care Utilization among the Residents of a Rural Region. Health Services Research 40, 135-155.
Battellino, H., Newman, J., Sayers, P., 2005. City of Sydney: analysis of transport
disadvantage. MSW Ministry of Transport and The City of Sydney Council, Consultant report.
Bond, J., 1997. Health Care Reform in the UK: Unrealistic or Broken Promises to Older Citizens? Journal of Aging Studies 11, 195-210.
Brereton, L., Vasoodaven, V., 2010. The impact of the NHS market: An overview of the literature. CIVITAS: Institute for the Study of Civil Society, London.
Buchmueller, T.C., Jacobson, M., Wold, C., 2006. How far to the hospital? The effect of hospital closures on access to care. Journal of Health Economics 25, 740-761.
Buliung, R.N., Kanaroglou, P.S., 2006. Urban Form and Household Activity-Travel Behavior. Growth and Change 37, 172-199.
Chan, L., Hart, L.G., Goodman, D.c., 2006. Geographic Access to Health Care for Rural Medicare Beneficiaries. The Journal of Rural Health 22, 140-146.
Church, A., Frost, M., Sullivan, K., 2000. Transport and social exclusion in London. Transport Policy 7, 195-205.
Citizens Advice, 2004. ‘Choosing health’: Citizens Advice’s response to the Department of Health, London.
Coyle, E., Huws, D., Monaghan, S., Roddy, G., Seery, B., Staats, P., Thunhurst, C., Walker, P., Fleming, P., 2009. Transport and health - a five-country perspective. Public Health 123, e21-e23.
Currie, G., Stanley, J., 2008. Investigating Links between Social Capital and Public Transport. Transport Reviews 28, 529-547.
De Kervenoael, R., Hallsworth, A., Clarke, I., 2006. Macro-level change and micro level effects: A twenty-year perspective on changing grocery shopping behaviour in Britain. Journal of Retailing and Consumer Services 13, 381-392.
Department for Transport, 2004. Smarter Choices – Changing the Way We Travel, London. Department for Transport, 2005. Making smarter choices work, London.
Department for Transport, 2006. National Travel Survey (NTS) data, 2002-2006: User guidance. UK Data Archive, London.
Department for Transport, 2010. The Effects of Smarter Choice Programmesin the Sustainable Travel Towns: Summary Report, London.
Department of Health, 2000. The NHS Plan: A Plan for Investment, a Plan for Reform. The Stationery Office, London.
Department of Health, 2003a. Keeping the NHS Local – A New Direction of Travel. The Stationery Office, London.
Department of Health, 2003b. Tackling health inequalities: A programme for action, London. Department of Health, 2010a. Equity and excellence: Liberating the NHS. The Stationery
Department of Health, 2010b. Healthy Lives, Healthy People: Our strategy for public health in England. The Stationery Office, London.
Department of the Environment, Transport and the Region, 2000. Social exclusion and the provision and availability of public transport. London.
Farrington-Douglas, J., Allen, J., 2005. Equitable choices for health. IPPR, London. Farrington, J., Farrington, C., 2005. Rural accessibility, social inclusion and social justice:
towards conceptualisation. Journal of Transport Geography 13, 1-12. Field, K., 2000. Measuring the need for primary health care: an index of relative
disadvantage. Applied Geography 20, 305-332.
Frank, L.D., Brian, S.J., Bachman, W., 2000. Linking land use with household vehicle emissions in the central puget sound: methodological framework and findings. Transportation Research Part D 5, 173-196.
Glaister, S., Burnham, J., Stevens, H., Travers, T., 1998. Transport Policy in Britain. Macmillan, Hampshire.
Goddard, M., Smith, P., 2001. Equity of access to health care services: Theory and evidence from the UK. Social Science & Medicine 53, 1149-1162.
Greer, S., 2009. Devolution and divergence in UK health policies. BMJ 338.
Ham, C., 1996. Managed markets in health care: the UK experiment. Health Policy 35, 279-292.
Hamer, L., 2004. Improving patient access to health services: a national review and case studies of current approaches. Health Development Agency, London.
Higgs, G., 1999. Investigating trends in rural health outcomes: a research agenda. Geoforum 30, 203-221.
Hine, J., Mitchell, F., 2001. The Role of Transport in Social Exclusion in Urban Scotland. Scottish Executive Central Research Unit, Edinburgh.
Kamruzzaman, M., Hine, J., Gunay, B., Blair, N., 2011. Using GIS to visualise and evaluate student travel behaviour. Journal of Transport Geography 19, 13-32.
Knowles, R.D., 1998. Passenger rail privatization in Great Britain and its implications, especially for urban areas. Journal of Transport Geography 6, 117-133.
Kumar, N., 2004. Changing geographic access to and locational efficiency of health services in two Indian districts between 1981 and 1996. Social Science & Medicine 58, 2045-2067.
Landrock, J.N., 1981. Spatial Stability of Average Daily Travel Times and Trip Rates within Great Britain. Transportation Research Part A 15, 55-62.
Lovett, A., Haynes, R., Sunnenberg, G., Gale, S., 2002. Car travel time and accessibility by bus to general practioner services: a study using patient registers and GIS. Social Science & Medicine 55, 97-111.
Luo, W., Wang, F., Douglass, C., 2004. Temporal Changes of Access to Primary Health Care in Illinois (1990-2000) and Policy Implications. Journal of Medical Systems 28, 287-299.
Målqvist, M., Sohel, N., Do, T.T., Eriksson, L., Persson, L.-Å., 2010. Distance decay in delivery care utilisation associated with neonatal mortality. A case referent study in northern Vietnam. BMC Public Health 10, 762-.
Martin, D., Wrigley, H., Barnett, S., Roderick, P., 2002. Increasing the sophistication of access measurement in a rural healthcare study. Health & Place 8, 3-13.
Maynard, A., Bloor, K., 1995. Primary care and health care reform: the need to reflect before reforming. Health Policy 31, 171-181.
Morency, C., Paez, A., Roorda, M.J., Mercado, R., Farber, S., 2011. Distance traveled in three Canadian cities: Spatial analysis from the perspective of vulnerable population segments. Journal of Transport Geography 19, 39-50.
Nemeta, G.F., Bailey, A.J., 2000. Distance and health care utilization among the rural elderly. Social Science & Medicine 50, 1197-1208.
Niggebrugge, A., Haynes, R., Jones, A., Lovett, A., Harvey, I., 2005. The index of multiple deprivation 2000 access domain: a useful indicator for public health? Social Science & Medicine 60, 2743-2753.
Panelli, R., Gallagher, L., Kearns, R., 2006. Access to rural health services: Research as community action and policy critique. Social Science & Medicine 62, 1103-1114. Pooley, C.G., Turnbull, J., 2000. Modal choice and modal change: the journey to work in
Britain since 1890. Journal of Transport Geography 8, 11-24.
Preston, J., 2009. Epilogue: Transport policy and social exclusion--Some reflections. Transport Policy 16, 140-142.
Rosero-Bixby, L., 2004. Spatial access to health care in Costa Rica and its equity: a GIS-based study. Social Science & Medicine 58, 1271-1284.
Schafer, A., Victor, D.G., 2000. The future mobility of the world population. Transportation Research Part A 34, 171-205.
Schönfelder, S., Axhausen, K.W., 2003. Activity spaces: measures of social exclusion? Transport Policy 10, 273-286.
Shaw, J., MacKinnon, D., Docherty, I., 2009. Divergence or convergence? Devolution and transport policy in the United Kingdom. Environment and Planning C: Government and Policy 27, 546-567.
Sherwood, K.B., Lewis, G.J., 2000. Accessing health care in a rural area: an evaluation of a voluntary medical transport scheme in the English Midlands. Health & Place 6, 337-350.
Social Exclusion Unit, 2003. Making the Connections: Transport and Social Exclusion. Social Exclusion Unit, The Stationery Office, London.
Stead, D., 1999. Relationships between transport emissions and travel patterns in Britain. Transport Policy 6, 247–258.
Tanser, F., Gijsbertsen, B., Herbst, K., 2006. Modelling and understanding primary health care accessibility and utilization in rural South Africa: An exploration using a
geographical information system. Social Science & Medicine 63, 691–705. Titheridge, H., Hall, P., 2006. Changing travel to work patterns in South East England.
Journal of Transport Geography 14, 60-75.
UKDA, 2010. National Travel Survey. https://www.data-archive.ac.uk/Introduction.asp. February 25, 2010
Wellstood, K., Wilson, K., Eyles, J., 2006. 'Reasonable access' to primary care: assessing the role of individual and system characteristics. Health & Place 12, 121-130.
Whelan, G., 2007. Modelling car ownership in Great Britain. Transportation Research Part A 41, 205-219.
White, P., 2009. Public Transport: Its planning, management and operation, Fifth Edition ed. UCL Press Limited, London.
White, P., Farrington, J., 1998. Bus and coach deregulation and privatization in Great Britain, with particular reference to Scotland. Journal of Transport Geography 6, 135-141. Whynes, D.K., Baines, D.L., 1998. Income-based incentives in UK general practice. Health
Policy 43, 15-31.
8. Tables
Table 1: Distribution of sample sizes (number of trips) by socio-spatial categories over the survey periods
Variables Classification 1985-86 1988-95 1995-01 2002-06
N % N % N % N %
Planning region England 4021 86.70 4555 85.62 11555 86.31 24413 86.02
Wales 219 4.72 339 6.37 728 5.44 1556 5.48
Scotland 398 8.58 426 8.01 1105 8.25 2410 8.49
Type of area London Boroughs 591 12.74 580 10.90 1458 10.89 2967 10.45
Met built-up areas 716 15.44 673 12.65 1813 13.54 3980 14.02
Other urban 2763 59.57 3397 63.85 8411 62.82 17685 62.32
Rural 568 12.25 670 12.59 1706 12.74 3747 13.20
HH car ownership Non-car 1297 27.96 1219 22.91 2897 21.64 5565 19.61
Car-owning 3341 72.04 4101 77.09 10491 78.36 22814 80.39
HH income quintile Lowest real income 557 12.01 965 18.14 - - 6023 21.22
Second level 869 18.74 1052 19.77 - - 6738 23.74
Third level 1021 22.01 1256 23.61 - - 6220 21.92
Fourth level 1046 22.55 1027 19.30 - - 5112 18.01
Highest real income 1145 24.69 1020 19.17 - - 4286 15.10
Gender Male 1944 41.91 2241 42.12 5684 42.46 12111 42.68
Female 2694 58.09 3079 57.88 7704 57.54 16268 57.32
Age Below 19 years 992 21.39 954 17.93 2098 15.67 3756 13.24
19-59 years (young) 2282 49.20 2658 49.96 6359 47.50 12698 44.74
60-69 years (older) 708 15.27 781 14.68 2159 16.13 5195 18.31
70 years and above (very elderly)
656 14.14 927 17.42 2772 20.71 6730 23.71
Total trips (51725) 4638 5320 13388 28379
Table 2: Share of transport modes to access health facilities in different periods (%)
Mode 1985-86 1988-95 1995-01 2002-06 Overall
Walk 11.5 9.0 9.1 9.6 9.6
Bicycle 0.8 1.0 1.1 0.8 0.9
Bus 18.1 12.9 11.6 11.1 12.1
Car 29.9 39.1 41.4 43.2 41.1
Lift 32.0 29.6 29.3 28.8 29.3
Other private 3.3 2.8 2.1 2.3 2.4
Train 1.7 1.2 1.4 1.0 1.2
Taxi - 4.3 3.9 3.0 3.1
Table 3: Mean journey distances and times by mode of transport to access health facilities in different time periods
Mode Journey distance (mile) Journey time (min)
1985-86 1988-95 1995-01 2002-06 1985-86 1988-95 1995-01 2002-06
Walk 1.43 1.42 1.12 1.07 23.30 22.84 23.23 23.20
Bicycle 1.62 1.42 1.51 1.49 15.41 12.56 14.71 14.60
Bus 3.72 4.20 3.51 3.73 27.98 29.45 30.59 31.45
Car 4.99 5.37 5.02 4.86 14.36 14.82 15.32 16.00
Lift 5.32 5.41 5.55 5.61 16.36 15.56 17.40 18.50
Train 16.05 17.95 19.09 20.23 67.27 61.63 62.07 65.97
Table 4: Linear regression analysis results showing the temporal variations in accessibility and mobility levels to health services
Variables Classification t coefficient
Journey distance (accessibility) Journey time (mobility)
1985-86 1988-95 1995-01 2002-06 1985-86 1988-95 1995-01 2002-06
Type of area London Boroughs (ref)
Met built-up areas -0.25 3.18b 1.95 1.76 -4.27b -2.31b -6.52b -14.15b
Other urban 2.37b 1.48 4.63b 5.40b -4.18b -6.64b -9.27b -18.27b
Rural 13.25b 10.09b 16.78b 26.82b -0.42 -2.49b -4.28b -7.54b
Car ownership Non-car (ref) vs. car 2.34b 5.89b 7.53b 7.33b -16.53b -12.49b -25.13b -31.25b
Income quintilea Lowest real income (ref)
Second level 0.84 2.02b - -0.42 1.86 -0.58 - -4.33b
Third level 2.39b -1.17 - 2.12b 1.41 -3.23b - -3.39b
Fourth level 0.27 1.81 - 2.79b -2.10b -2.19b - -5.29b
Highest real income 2.87b 3.16b - 7.49b -1.15 -1.79 - -3.14b
Gender Male (ref) vs. female -3.06b -1.44 -3.89b -5.49b -0.30 -0.36 -0.71 -2.75b
Age 19-59 years (ref)
Below 19 years -5.49b -6.19b -8.81b -4.65b -2.28b -2.49b -3.33b -2.30b
Older (60-69 years) -0.72 -2.50b -2.25b -1.34 1.79 1.04 2.48b 0.23
Very elderly (70+ years) -1.56 -2.18b -5.70b -4.87b -2.01b -0.49 -0.63 -1.54
F 30.98b 27.36b 77.09b 128.98b 41.81b 32.09b 103.46b 149.42b
a
Income data has been reported as bands for the period of 1995-01, and as a result, it was not possible to derive income quintile to conduct regression analysis.
b
Table 5: Binary logistic regression analysis results showing the temporal variations in the utilisation of health services
Variables Classification ORs
1985-86 1988-95 1995-01 2002-06
Type of area London Boroughs (ref)
Met built-up areas 1.102 0.949 0.860b 1.105b
Other urban 0.944 1.087 0.992 1.026
Rural 0.986 1.055 0.914 1.045
Car ownership Non-car (ref) vs. car 0.317b 0.578b 0.678b 0.886b
Income quintilea Lowest real income (ref)
Second level 4.646b 3.051b - 8.325b
Third level 6.568b 3.988b - 7.177b
Fourth level 8.507b 3.812b - 6.857b
Highest real income 11.464b 4.354b - 5.663b
Gender Male (ref) vs. female 0.988 0.990 0.970 1.039
Age Young (ref) (19-59 years)
Below 19 years 1.578b 1.168b 0.908b 0.818b
Older (60-69 years) 0.926 0.806b 0.708b 1.326b
Very elderly (70+ years) 0.604b 0.741b 0.710b 1.587b
a
Income data has been reported as bands for the period of 1995-01, and as a result, it was not possible to derive income quintile to conduct regression analysis.
9. Figure captions
Fig. 1 Correlations between a) journey time and travel time, and b) journey distance and journey time
Fig. 2 Transport mode and distance/time decay behaviour in the utilisation of health services in GB over 1985-2006
Fig. 3 Contextual differences and distance/time decay behaviour in the utilisation of health services in GB over 1985-2006
Fig. 4 Car-ownership status and distance/time decay behaviour in the utilisation of health services in GB over 1985-2006