MATERIALS AND METHODS
1
Lingulodinium polyedra
2
The dinoflagellate Lingulodinium polyedra (MCCV 130) was originally collected 3
from the “Baie de Vilaine” and cultured at the Mediterranean Culture Collection of 4
Villefranche (MCCV). Cultures were maintained in 75 mL of L1 medium [1] prepared with 5
sterile and aged sea water adjusted to a salinity of 34. Cultures were maintained at 22°C, 6
under a 14/10 light/dark cycle with a light intensity of 250 µmol.m-2.s-1. Cells of L. polyedra 7
used for the experiments were collected from the cultures after 14 days. They were counted in 8
12 mL aliquots (triplicates) fixed with acidic lugol (4% v/v) using a liquid particle counter 9
(HIAC/Royco 9703, Pacific Scientific Instruments) with a size range of 2-80 µm2. 10
Copepods
11
The harpacticoid copepod Sarsamphiascus cf. propinquus (Sars, 1906) was collected 12
from the Marinières site (Bay of Villefranche-sur-Mer, N-W Mediterranean, 43°42'21.51"N-13
7°19'07.44"E) using a WP2 net towed over the macroalgal cover. Copepods were maintained 14
in 10 L tanks in 0.2-µm filtered aged seawater (salinity 38) at 22°C in the dark. They were fed 15
three times a week with a mixture of the microalgae Dunaliella salina (MCCV 020) and 16
Tisochrysis lutea (CCAP 927/14). 17
cDNA sequencing and expression studies
18
For RNA extraction, L. polyedra were flash-frozen and ground using the TissueLyser 19
LT (Qiagen Inc.) for 2 min at 50Hz. Samples were centrifuged at 13000 g, for 20 min, at 4°C 20
to remove debris. Total RNA was extracted with the PureLink™ RNA Mini Kit (Ambion-21
Life Technologies/Thermo Fisher Scientific) following the manufacturer's instructions and 22
42 °C. The reverse transcriptase was inactivated for 5 min at 85 °C. The cDNAs were 25
amplified by Phusion DNA Polymerase (New England Biolabs, Ipswich,UK) with the 5X 26
Phusion GC Buffer (New England Biolabs, Ipswich,UK) and specific primers designed 27
according to the GenBank sequence JO713726.1. Amplified cDNA was sequenced by 28
Eurofins and deposited as LpMIF under the GenBank accession number MN911288. 29
For RT-qPCR, transcripts were amplified by Takyon™ qPCR SYBR® MasterMix 30
(Eurogentec, Seraing, Belgium, #UF-NSMT-B0701) following the manufacturer’s 31
instructions. Primers for RT-qPCR were designed with Primer3Plus at www.bioinformatics.nl 32
[2]. Expression levels of LpMIF were normalized to expression levels of internal reference 33
genes encoding, L. polyedra actin (Lpactin, GenBank accession number AY423582.1), and 34
glyderaldehyde-3-phosphate dehydrogenase (LpGAPDH, GenBank accession number 35
AY028562.1). Amplification efficiencies were assessed for each amplicon and the relative 36
expression ratios were calculated using the relative quantification method [3]. 37
Sequence analysis
38
The physico-chemical parameters of molecular weight and theoretical isoelectric point 39
(pI) of the deduced protein were computed using the ProtParam tool 40
(http://web.expasy.org/protparam/) [4]. The functional domains and important sites of the 41
protein were predicted by InterPro [5] and PFAM [6] softwares. The transmembrane regions 42
and their topology were predicted using a set of 5 transmembrane prediction algorithms: 43
TMHMM Server [7], HMMTOP [8], TMpred [9], ∆G Prediction server [10]and Phobius [11]. 44
Plasmid design for Agrobacterium-mediated transformation-subcellular localization in an
45
heterologous system
46
LpMIF with and without the transmembrane domain, were amplified from L. polyedra 47
(Invitrogen) and transferred into the destination GFP fusion vector pK7WGF2 (Plant Systems 49
Biology, VIB, Gant,Belgium, [12]) using the BP and LR reaction protocols (Invitrogen™/ 50
Thermo Fisher Scientific, #11789020 and #11791100). All the constructs were validated by 51
sequencing (Eurofins GATC, Konstanz, Germany) and transformed into Agrobacterium 52
tumefaciens strain GV3301. Transformants were selected using gentamycin (25µg/mL 53
(Sigma-Aldrich, #G1264)), rifampicin (50µg/mL (Sigma-Aldrich, #R7382)) and 54
spectinomycin (100µg/mL (Duchefa Biochemies, #S0188)). Recombinant strains were grown 55
in YEB medium with the above-mentioned antibiotics at 28°C to an OD600 of 1.5. After 56
centrifugation, the pellet was recovered in infiltration buffer (150µM MES hydrate pH5.7 57
(Sigma-Aldrich, #M2933), 100mM MgCl2, 100µM acetosyringone (Sigma-Aldrich # 58
D134406)[13]. 59
Agrobacterium-mediated transient expression was carried in N. benthamiana. 60
Epidermal leaf cells were syringe-infiltrated with A. tumefaciens at a final OD600 = 0.1, 61
according to a classical procedure described classically such in Evangelisti at al.[14]. Two 62
days after infiltration, leaf discs were observed by a laser confocal microscope (Carl Zeiss 63
MicroImaging GmbH, Jena, Germany, #LSM880) using an excitation at 488 nm. 64
Western blots
65
L. polyedra cells were transferred to 300µl of protein extraction buffer (100 mM Tris 66
pH7.4, 10µM KCl, 10µM EDTA, 0.1% Tergitol (Sigma-Aldrich, Saint-Louis, USA #NP40S) 67
and Plant Protease Inhibitor Mix (Sigma-Aldrich #P9599). Samples were ground using the 68
TissueLyser LT (Qiagen Inc., Valencia, CA, USA) during 2 min at 50Hz. After 20 min under 69
gentle rotation on ice, tubes were centrifuged at 13000g, during 20min, at 4°C, to remove cell 70
debris. The supernatant was transferred to an ultracentrifugation tube and centrifuged at 71
membranes, were washed with 1mL of extraction buffer and resuspended in 100 µl of 10% 73
SDS and 250µl of extraction buffer. For the immunodetection of proteins excreted in the sea 74
water, 5000 cells of L. polyedra were separated from sea water after a centrifugation 75
(4,500xg, 2 mins). 50 mL sea water, were desalted and concentrated by successive 76
centrifugations on Centricon tubes (Vivaspin-6, 5,000 MWCO, Sartorius, Göttingen, 77
Germany, #VS0611), to a final volume of 200µl. Protein concentrations were measured using 78
the Pierce™ 660nm Protein Assay (#22662) according to manufacturer’s instructions. Ten 79
micrograms of proteins were loaded on 12% Mini-PROTEAN® TGX™ precast gels (Bio-80
Rad Laboratories, Munich, Germany, #4561045) using Laemmli buffer 2X without reducing 81
agent (Bio-Rad Laboratories, #1610737), and separated under non-denaturing conditions, to 82
allow potential visualization of MIF oligomers. Proteins were then transferred to a 2µm 83
PVDF membrane (Bio-Rad Laboratories, #1704157EDU) using a semi-dry blotting system. 84
Blots were blocked 1h at room temperature (RT) with 5% milk/ PBS-T and then incubated in 85
5% milk/ PBS-T, over-night at 4°C with a custom-made polyclonal antibody raised against 86
two LpMIF peptides at 1:5000 or 1:1000. The design and synthesis of antigenic peptides as 87
well as polyclonal antibody production and purification were performed by Proteogenix 88
(http://www.proteogenix.fr/). After 3 washes with PBS-T, blots were incubated in 5% 89
milk/PBS-T, 45 min at RT with a secondary antibody at 1:10 000 (goat anti-rabbit IgG-HRP, 90
#AS09 602 Agrisera, Vännäs, Sweeden). Proteins were visualized using a chemiluminescence 91
detection kit, Luminata™ Forte Western HRP substrate (Merck Millipore, Watford, UK, 92
#WBLUF0100) following the manufacturer’s instructions. 93
Mass spectrometry
94
Mass spectrometry was performed by the Protein Science Facility (SFR Biosciences, 95
Lyon, France). Briefly, following protein precipitation step (using trichlororoacetic acid 20% 96
urea. Samples were reduced (Tris(2-CarboxyEthyl)Phosphine (Sigma-Aldrich, #C4706), 5 98
mM, 57°C, 1h), alkylated (iodoacetamide (Sigma-Aldrich, #I1149) 10 mM, RT, 45 min), and 99
digested overnight at 37°C with trypsin (1/100 ratio). Peptides digest was next desalted using 100
C18 spin column (Thermo Fisher Scientific). Peptides were dried in a speed-vac and 101
suspended in 50 µL 0.1% HCOOH before nanoLC-MS/MS analysis. Samples were analyzed 102
using an Ultimate 3000 nano-RSLC (Thermo Fisher Scientific) coupled on line with a Q 103
Exactive HF mass spectrometer via a nano-electrospray ionization source (Thermo Fisher 104
Scientific). 1 µL of peptide mixtures was loaded on a C18 PepMap100 trap-column (300 µm 105
ID x 5 mm, 5 µm, 100Å, Thermo Fisher Scientific) for 3.0 minutes at 20 µL/min with 2% 106
ACN, 0.05% TFA in H2O and then separated on a C18 Acclaim PepMap100 nano-column, 50 107
cm x 75 µm i.d, 2 µm, 100 Å (Thermo Fisher Scientific) with a 60 minutes linear gradient 108
from 3.2% to 40% buffer B (A: 0.1% FA in H2O, B: 0.1% FA in ACN) and then from 40 to 109
90% of B in 2 min, hold for 10 min and returned to the initial conditions in 1 min for 15 min. 110
The total duration was set to 90 minutes at a flow rate of 300 nL/min. The oven temperature 111
was kept constant at 40°C. Sample were analysed with TOP20 HCD method: MS data were 112
acquired in a data dependent strategy selecting the fragmentation events based on the 20 most 113
abundant precursor ions in the survey scan (350-1600 Th). The resolution of the survey scan 114
was 60,000 at m/z 200 Th. The Ion Target Value for the survey scans in the Orbitrap and the 115
MS2 mode were set to 3E6 and 1E5 respectively and the maximum injection time was set to 116
60 ms for both scan modes. Parameters for acquiring HCD MS/MS spectra were as follows; 117
collision energy = 27 and an isolation width of 2 m/z. The precursors with unknown charge 118
state or a charge state of 1 were excluded. Peptides selected for MS/MS acquisition were then 119
placed on an exclusion list for 20 s using the dynamic exclusion mode to limit duplicate 120
Proteins were identified by database searching using Sequest HT with Proteome 122
Discoverer 2.2 software (Thermo Fisher Scientific) against the uniprot Lingulodinium 123
polyedra database (50 entries, June 2019) and LpMIF sequence. Precursor mass tolerance was 124
set at 10 ppm and fragment mass tolerance was set at 0.02 Da, and up to 2 missed cleavages 125
were allowed. Oxidation (M), acetylation (Protein N-terminus) were set as variable 126
modification, and Carbamidomethylation (C) as fixed modification. Proteins were filtered 127
with a fixed value PSM validator. 128
Stress bio-assays
129
To investigate L. polyedra stress responses, three experimental samples were 130
compared: (i) L. polyedra cells; (ii) L. polyedra exposed to the copepods for 24 hours; and 131
(iii) L. polyedra exposed to the copepods for 24 hours and then maintained under normal 132
conditions (without copepods) for a week. Each treatment was replicated 3 times. All samples 133
were maintained in 75 mL flasks containing 50 mL of autoclaved, aged and 0.2-µm filtered 134
seawater (salinity 34), at 22°C. Prior to the experiments, copepods (adults and late 135
copepodites) were collected from the culture tanks, rinsed twice in seawater and transferred to 136
each flask (50 individuals per flask). They were left for 2 days without food to allow gut 137
clearance and salinity acclimation before the experiments. Lingulodinium polyedra cells were 138
added in each flask at a final concentration of 100 cells.mL-1. All samples were maintained in 139
75 mL flasks containing 50 mL of autoclaved, aged and 0.2-µm filtered seawater (salinity 140
3.4%), at 22°C. After 24 hours of exposure, 2 mL of L. polyedra were sampled for each 141
replicate to study the photosystem II (PSII) function using a Multi-Color Pulse-Amplitude-142
Modulated analyser (MC-PAM, Heinz Walz Gmbh, Effeltrich, Germany) by measuring the 143
maximum quantum yield of PSII (Fv/Fm ratio) [15,16]. Prior to fluorescence measurement, 144
samples were dark-acclimated at 24 °C for 15 min to re-open PSII reaction centres and relax 145
Immunolocalization
147
L. polyedra cells were centrifuged to remove sea water at 1000g for 5min. They were 148
fixed in a 4% formaldehyde/PBS solution (Sigma-Aldrich, #252549) at RT for 45min. 149
Following fixation, cells were washed twice in PBS (Corning-Mediatech, Inc., Manassas, 150
USA #21-040-CM) with 0.1% Triton and permeabilized during 10min with 0.25% 151
Triton/PBS (Sigma-Aldrich #T9284). After 3 washes with 0.1% Triton/PBS (5 min, 1mL 152
each), the samples were blocked with 1% BSA (Sigma Aldrich, #A2153)/PBS at least 1h at 153
RT, with gentle rotation. They were incubated with MIF antibody (1:1000) over night at 4°C 154
in1% BSA/PBS under agitation. L. polyedra were washed three times in PBS and incubated 155
with 1:1000 goat anti-rabbit secondary antibody conjugated to Alexa-Fluor 488 (Invitrogen-156
Life Technologies/Thermo Fisher Scientific, Waltham, USA, #A11008). After washing three 157
times with PBS, the samples were mounted in chambered cover glass Lab-Tek II (Life 158
Technologies/Thermo Fisher Scientific #A155411) and observed by confocal microscopy 159
(Carl Zeiss MicroImaging GmbH, Jena, Germany, #LSM880). To control for potential non-160
specific labelling, two additional samples were systematically prepared: samples where the 161
primary antibody was either omitted, or replaced by pre-immune serum. 162
Images of fluorescent cells were converted by the LSM Image Browser software, ZEN 163
2011, Blue edition (Carl Zeiss) into JPEG files (8 bit black and white quality). Fluorescence 164
was measured with ImageJ (cut off > 10 pixels) [17]. Results are shown as the ratio of 165
fluorescent vs total area. Nine images were analysed per condition, corresponding to the 166
examination of approximately 20 independent dinoflagellates. All images, including those 167
converted for ImageJ analyses, have been deposited in Mendeley Data 168
(http://dx.doi.org/10.17632/5j4k6r79ys.1). 169
Immunogold labelling and Transmission Electron Microscopy (TEM)
For ultrastructural immunocytochemistry, cells were fixed with 4% paraformaldehyde (PAF) 171
or 4% PAF and 0.2% glutaraldehyde (PG) in phosphate buffer 0.1 M (pH 7.4) (Sigma 172
Aldrich). They were then dehydrated in ethanol series and embedded in acrylic resin (LR-173
WHITE (Electron Microscopy Sciences- EMS) before sectioning. For immunogold labelling, 174
grids were deposited face down on the top of small drops of the following solutions: PBS 175
containing 50 mM NH4Cl for 10 min, PBS containing 1% BSA and twin 20 for 10 min, PBS 176
containing the relevant mAbs in 1% BSA and tween 20 for 1 h, PBS containing 0.1% BSA 177
for 10 min, PBS 10 min, PBS containing 1% BSA and tween 20 with 15 nm protein-A gold 178
conjugated (PAG-15nm Cell Microscopy Core, Utrecht, Netherland) for 30 min, PBS 179
containing 0.1% BSA for 5 min, PBS for 5 min twice, PBS containing 1% glutaraldehyde for 180
5 min and distilled water for 5 min. For controls, only the primary antibody was omitted. The 181
sections were then contrasted with uranyl acetate (4% in water) and visualized using a JEM 182
1400 Electron Microscope (JEOL, Tokyo, Japan) operating at 100kV equipped with a 183
MORADA SIS camera (Olympus, Tokyo, Japan). 184
Scanning Electron microscopy (SEM)
185
Cell pellets were fixed with a 1.6% glutaraldehyde solution in 1:1 mixture of 0.2 M 186
sodium cacodylate buffer (pH 7.4) and artificial sea water at room temperature and then 187
stored at 4°C. After three washes in distilled water, cells were filtered on a 0.2 µm isopore 188
filter (Merck Millipore, Carrigtwohill, Ireland). Samples on filters were subsequently 189
dehydrated in a series of ethanol baths (70%, 96 %, 100% three times, 15 min each). After a 190
final bath in hexamethyldisilazane (Carl Roth GmbH, Karlruhe, Germany) (HMDS, 5 191
minutes), samples were left to dry overnight. Samples on filters were mounted on SEM stubs 192
with silver paint and coated with platinum (3 nm) prior to observation. SEM observations 193
were performed with a JSM-6700F SEM (JEOL) at an accelerating voltage of 3 kV. 194
Quantification and statistical analysis
196
All experiments were repeated three times independently. Kruskal-Wallis tests were 197
used to compare the photosystem II activity between the different experimental conditions 198
(control, stress, post-stress). Fluorescence signal intensities between the three different 199
conditions (control, stress, unstressed) were compared using the Kruskal-Wallis statistical test 200
(* = p ≤ 0,05, ** = p ≤ 0,01, *** = p ≤ 0,001). Data are presented as bars of relative 201
fluorescence. Differences in gene expression levels were tested for statistical significance by 202
one-way ANOVA and Tukey-Kramer tests (Software Prism v.5.0, GraphPad). Expression 203
levels of the target genes are presented as a relative expression normalized to internal 204
reference genes and to expression in the control sample. 205
206
REFERENCES
207
[1] R.R.L. Guillard, P.E. Hargraves, Stichochrysis immobilis is a diatom, not a chrysophyte, Phycologia. 32
208
(1993) 234–236. https://doi.org/10.2216/i0031-8884-32-3-234.1.
209
[2] A. Untergasser, H. Nijveen, X. Rao, T. Bisseling, R. Geurts, J.A.M. Leunissen, Primer3Plus, an enhanced
210
web interface to Primer3, Nucleic Acids Res. 35 (2007) W71–W74. https://doi.org/10.1093/nar/gkm306.
211
[3] M.W. Pfaffl, A new mathematical model for relative quantification in real-time RT-PCR, Nucleic Acids
212
Res. 29 (2001) e45–e45. https://doi.org/10.1093/nar/29.9.e45.
213
[4] E. Gasteiger, A. Gattiker, C. Hoogland, I. Ivanyi, R.D. Appel, A. Bairoch, ExPASy: The proteomics server
214
for in-depth protein knowledge and analysis, Nucleic Acids Res. 31 (2003) 3784–3788.
215
[5] P. Jones, D. Binns, H.-Y. Chang, M. Fraser, W. Li, C. McAnulla, H. McWilliam, J. Maslen, A. Mitchell, G.
216
Nuka, S. Pesseat, A.F. Quinn, A. Sangrador-Vegas, M. Scheremetjew, S.-Y. Yong, R. Lopez, S. Hunter,
217
InterProScan 5: genome-scale protein function classification, Bioinformatics. 30 (2014) 1236–1240.
218
https://doi.org/10.1093/bioinformatics/btu031.
219
[6] S. El-Gebali, J. Mistry, A. Bateman, S.R. Eddy, A. Luciani, S.C. Potter, M. Qureshi, L.J. Richardson, G.A.
220
Salazar, A. Smart, E.L.L. Sonnhammer, L. Hirsh, L. Paladin, D. Piovesan, S.C.E. Tosatto, R.D. Finn, The
221
Pfam protein families database in 2019, Nucleic Acids Res. 47 (2019) D427–D432.
[7] A. Krogh, B. Larsson, G. von Heijne, E.L.L. Sonnhammer, Predicting transmembrane protein topology with
224
a hidden markov model: application to complete genomes, J. Mol. Biol. 305 (2001) 567–580.
225
https://doi.org/https://doi.org/10.1006/jmbi.2000.4315.
226
[8] G.E. Tusnády, I. Simon, The HMMTOP transmembrane topology prediction server , Bioinformatics. 17
227
(2001) 849–850. https://doi.org/10.1093/bioinformatics/17.9.849.
228
[9] K.H.& W. Stoffel, TMbase - A database of membrane spanning proteins segments., Biol. Chem. 374 (1993)
229
166.
230
[10] T. Hessa, N.M. Meindl-Beinker, A. Bernsel, H. Kim, Y. Sato, M. Lerch-Bader, I. Nilsson, S.H. White, G.
231
von Heijne, Molecular code for transmembrane-helix recognition by the Sec61 translocon, Nature. 450
232
(2007) 1026–1030. https://doi.org/10.1038/nature06387.
233
[11] L. Käll, A. Krogh, E.L.L. Sonnhammer, Advantages of combined transmembrane topology and signal
234
peptide prediction-the Phobius web server, Nucleic Acids Res. 35 (2007) W429–W432.
235
https://doi.org/10.1093/nar/gkm256.
236
[12] M. Karimi, D. Inzé, A. Depicker, GATEWAYTM vectors for Agrobacterium-mediated plant transformation, 237
Trends Plant Sci. 7 (2002) 193–195. https://doi.org/https://doi.org/10.1016/S1360-1385(02)02251-3.
238
[13] J. Kapila, R. De Rycke, M. Van Montagu, G. Angenon, An Agrobacterium-mediated transient gene
239
expression system for intact leaves, Plant Sci. 122 (1997) 101–108.
240
https://doi.org/https://doi.org/10.1016/S0168-9452(96)04541-4.
241
[14] E. Evangelisti, B. Govetto, N. Minet-Kebdani, M.-L. Kuhn, A. Attard, M. Ponchet, F. Panabières, M.
242
Gourgues, The Phytophthora parasitica RXLR effector Penetration-Specific Effector 1 favours Arabidopsis
243
thaliana infection by interfering with auxin physiology, New Phytol. 199 (2013) 476–489.
244
https://doi.org/10.1111/nph.12270.
245
[15] Z.S. Kolber, O. Prášil, P.G. Falkowski, Measurements of variable chlorophyll fluorescence using fast
246
repetition rate techniques: defining methodology and experimental protocols, Biochim. Biophys. Acta -
247
Bioenerg. 1367 (1998) 88–106. https://doi.org/https://doi.org/10.1016/S0005-2728(98)00135-2.
248
[16] E. Ternon, A.-S. Pavaux, S. Marro, O.P. Thomas, R. Lemée, Allelopathic interactions between the benthic
249
toxic dinoflagellate Ostreopsis cf. ovata and a co-occurring diatom, Harmful Algae. 75 (2018) 35–44.
250
https://doi.org/https://doi.org/10.1016/j.hal.2018.04.003.
251
[17] S.J. Abramoff, M.D., Magalhaes, P.J., Ram, Image processing with ImageJ, Biophotonics Int. 11 (2004) 36–
252
42.
254
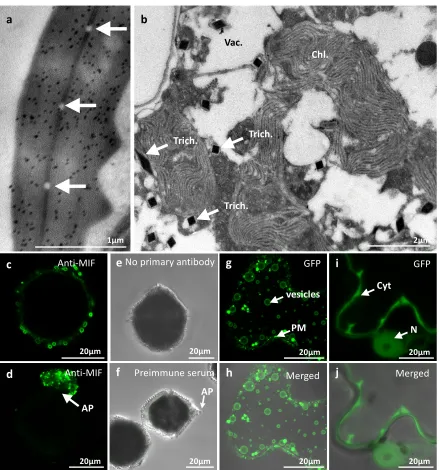
Figure S1. (a,b) Immunogold-labelled electron micrographs of L. polyedra. (a) Representative section of the
255
apical pore showing an important accumulation of gold particles (black dots). The secretory pores are indicated
256
by white arrows. (b) Representative image of L. polyedra cell content showing a vacuole (vac.), chloroplast (chl.)
257
and the typical sections of the trichocysts (Trich.). Note that no labelled LpMIF (black dots) are observed. (c,d)
258
Images corresponding to Figure 2g and h but only with LpMIF labelled in green (Alexa 488®). (e,f) Negative
259
control samples directly exposed to the secondary antibody (but no primary antibody) or exposed to pre-immune
260
serum prior to secondary antibody. No labelling was detected in either case. The white arrow indicates the apical
261
pore. (g-j) Subcellular localization of LpMIF fused at the N-terminus to GFP, and expressed with (g,h) or without
262
the transmembrane domain (i,j) in Nicotiana benthamiana. (g,h) GFP:LpMIF with its endogenous transmembrane
263
domain localizes to vesicle membranes and accumulates in the plasma membrane (PM). (i,j) The MIF domain of
264
LpMIF (GFP:LpMIF_TM) without the transmembrane domain localizes to the cytoplasm (Cyt) and diffuses
265
passively into the nucleus (N).
266 267
a
2µm Chl.
Vac.
Trich. Trich.
Trich.
b
1µm
GFP
20µm 20µm
Merged GFP
N
vesicles Cyt
PM
20µm
20µm AP Anti-MIF
20µm
Anti-MIF
20µm
c No primary antibody
Preimmune serum f
e
d
i g
j
20µm Merged h
20µm 20µm
AP
269
270
271
Figure S2. Negative control samples of unstressed (Control) and stressed L. polyedra (in the presence of
272
copepods), and after recovery (Post-Stress). Samples were directly exposed to the secondary antibody without the
273
primary antibody.
274
275
20µm 20µm 20µm
20µm
STRESS POST-STRESS
CONTROL
No primary antibody No primary antibody No primary antibody