Volume 2, issue 2 (2013),32-46
International Journal of Pharmaceutical Research &
Allied Sciences
32
Formulation Development, Optimization and Characterization of
Floating Beads of Captopril
Kiran Thadkala1*, N.P Prema kumari2, R.Prathyusha3, Anju Raju4
Department of Pharmaceutics, Mother Teresa College of Pharmacy, Hyderabad, AP, India *
Email: [email protected].
Subject: Pharmaceutics
Abstract
The main objective of the present work was to develop and standardize floating alginate microspheres formulation for the drug captopril to increase the gastric retension time. The drug is freely water soluble and has elimination half life after an oral dose of 1.7 to 2 hr. It is stable at pH 1.2 and as the pH increases, the drug becomes unstable and undergoes a degradation reaction. Compared to conventional tablets, release of captopril from these floating beads was apparently prolonged; as a result, an 8hr controlled-release dosage form for captopril was achieved. Drug release best fit both the Higuchi model and the Korsmeyer and Peppas model, followed by zero order kinetics. Fitting of the release data to the Korsmeyer and Peppas equation was found that, the drug release rate at 8hr (%) ranges from 39.49 ± 3.58 to 67.34 ± 1.842, the diffusion coefficient (n) ranges from 0.24 ± 0.037 to 0.62 ± 0.069. These results indicated that, the release mechanism is by diffusion. Higuchi release model also indicated that the mechanism of drug release is by diffusion. A numerical optimization technique was adapted, which are designed based on 32 full factorial design containing two factors evaluated at three levels and the experimental trials were, performed at all possible combinations. Optimization by desirability function was performed. Optimum formulations were obtained using constraints on drug release at 6hr (%), and diffusion coefficient (n). The optimized formulations were evaluated for the responses. The actual response values were in accordance with the predicted values. Further from the data it is concluded that the mechanism of drug release is by diffusion and follows fickian transport.
Keywords: Captopril, floating microspheres, carbopol 934p, sodium alginate, optimization, release
kinetics, diffusion and control release.Introduction
Since the last three decades many drug molecules formulated as Gastroretentive Drug Delivery System have been patented keeping in view its commercial success. Oral controlled release dosage forms have been extensively used to improve therapy of many important medications. The bioavailability of drugs with an absorption window in the upper small intestine is generally limited with conventional pharmaceutical dosage forms. The residence time of such systems and, thus, of their drug release into the stomach and upper intestine is often short. To overcome this restriction and to increase the bioavailability of these drugs, controlled drug delivery systems, with a prolonged residence time in the stomach, can be used1. Incorporation of the drug into a controlled
33
gastroretentive dosage forms began near about 20 years ago, following the discovery of Helicobacter pylori by Warren and Marshall. Many attempts have been made to devise an extended release Gastroretentive Drug Delivery System, where the dosage form is small enough to ingest and then retained in the gastrointestinal tract area for a long enough time for the active agent to be dissolved and eventually absorbed. For example, many swelling and expanding systems have been attempted. There are dosage forms that swell and change their size thereby floating to the surface. It is also reported that oral treatment of gastric disorders with an H2
-receptor antagonist like ranitidine or famotidine, used in combination with antacids, promotes local delivery of these drugs to the receptor of the parietal cell wall. Local delivery also increases the stomach wall receptor site bioavailability and increases the efficacy of drugs to reduce acid secretion2.
Gastric emptying occurs during fasting as well as fed states. The pattern of motility is however distinct in the 2 states. During the fasting state an interdigestive series of electrical events take place, which cycle both through stomach and intestine every 2 to 3 hours. This is called the interdigestive myloelectric cycle or migrating myloelectric cycle, which is further divided into following 4 phases as described by Wilson and Washington.
1. Phase I (Basal phase) lasts from 40 to 60 minutes with rare contractions. 2. Phase II (Preburst phase) lasts for 40 to
60 minutes with intermittent action potential and contractions. As the phase progresses the intensity and frequency also increases gradually.
3. Phase III (Burst phase) lasts for 4 to 6 minutes. It includes intense and regular contractions for short period. It is due to this wave that all the undigested material is swept out of the stomach down to the small intestine. It is also known as the housekeeper wave. 4. Phase IV lasts for 0 to 5 minutes and
occurs between phases III and I of 2 consecutive cycles3.
After the ingestion of a mixed meal, the pattern of contractions changes from fasted to that of fed state. This is also known as digestive motility pattern and comprises continuous contractions as in phase II of fasted state. These contractions result in reducing the size of food particles (to less than 1 mm), which are propelled toward the pylorus in a suspension form. During the fed
state onset of migrating myloelectric cycle is delayed resulting in slowdown of gastric emptying rate4.
The rate of gastric emptying depends mainly on viscosity, volume, and caloric content of meals. Nutritive density of meals helps determine gastric emptying time. It does not make any difference whether the meal has high protein, fat, or carbohydrate content as long as the caloric content is the same. However, increase in acidity and caloric value slows down gastric emptying time. Biological factors such as age, body mass index, gender, posture, and diseased states (diabetes, Chron’s disease) influence gastric emptying. In the case of elderly persons, gastric emptying is slowed down. Generally females have slower gastric emptying rates than males. Stress increases gastric emptying rates while depression slows it down5.
The resting volume of the stomach is 25 to 50 mL. Volume of liquids administered affects the gastric emptying time. When volume is large, the emptying is faster. Fluids taken at body temperature leave the stomach faster than colder or warmer fluids. Studies have revealed that gastric emptying of a dosage form in the fed state can also be influenced by its size. Small-size tablets leave the stomach during the digestive phase while the large-size tablets are emptied during the housekeeping waves.
Size and shape of dosage unit also affect the gastric emptying. Garg and Sharma reported that tetrahedron and ring shaped devices have a better gastric residence time as compared with other shapes. The diameter of the dosage unit is also equally important as a formulation parameter. Dosage forms having a diameter of more than 7.5 mm show a better gastric residence time compared with one having 9.9 mm6.
Figure: 1 Intragastric residence positions of floating and nonfloating units.
34
A. Expandable systems B. Bio/Mucoadhesive systems C. Floating drug delivery systems
D. Combination of floating, mucoadhesion and swellable sytems
Classification of Floating Drug Delivery Systems (FDDS)7
Floating drug delivery systems are classified depending on the use of 2 formulation variables: effervescent and non-effervescent systems. (a) Non-effervescent systems
This system can be further divided into four sub types:
(i) Colloidal gel barrier system (ii) Microporous compartment system (iii) Alginate microspheres
(iv) Hollow microspheres / Microballons (b) Effervescent systems (Gas-generating): These buoyant systems utilize matrices prepared with swellable polymers such as methocel, polysaccharides e.g., chitosan, effervescent components e.g., sodium bicarbonate, citric acid or tartaric acid. The system is so prepared that upon arrival in the stomach; carbon dioxide is released, causing the formulation to float in the stomach. Other approaches and materials that have been reported are a mixture of sodium alginate and sodium bicarbonate, multiple unit floating pills that generate carbon dioxide when ingested, floating minibeads with a core of sodium bicarbonate, lactose and polyvinylpyrrolidone coated with hydroxypropyl methylcellulose, and floating systems based on ion exchange resin technology etc8.
Figure: 2 Pictorial presentation of working of effervescent floating drug delivery system based on ion exchange resin.
Applications of Floating Drug Delivery Systems:
Floating drug delivery offers several applications for drugs having poor bioavailability because of the narrow absorption window in the upper part of the gastrointestinal tract. It retains the dosage form at the site of absorption and thus enhances the bioavailability9. These are summarized as follows:
Sustained Drug Delivery
HBS systems can remain in the stomach for long periods and hence can release the drug over a prolonged period of time. The problem of short gastric residence time encountered with an oral controlled release formulation hence can be overcome with these systems. These systems have a bulk density of <1 as a result of which they can float on the gastric contents. These systems are relatively large in size and passing from the pyloric opening is prohibited9, 10. Site-Specific Drug Delivery
These systems are particularly advantageous for drugs that are specifically absorbed from stomach or the proximal part of the small intestine, eg, riboflavin and furosemide11. Absorption Enhancement
Drugs that have poor bioavailability because of site-specific absorption from the upper part of the gastrointestinal tract are potential candidates to be formulated as floating drug delivery systems, thereby maximizing their absorption12. MATERIALS AND METHODS
MATERIALS
Captopril was gift sample from Hetero Drugs limited, Hyderabad, India. Sodium Alginate, Carbopol 934P and Arachis Oil were gift samples from MSN laboratories, Hyderabad, India. All other chemicals used were of analytical grade.
METHODOLOGY
PROCEDURE FOR CONSTRUCTION OF CALIBRATION CURVE:
1) Standard Stock - 1mg/mL in pH 1.2 acid buffer
2) Working Stock - 100 µg/mL in pH 1.2 acid buffer
Determination of absorption maxima:
A spectrum of the working standards was obtained by scanning from 200-400nm against the reagent blank to fix absorption maxima. The
λmax was found to be 205nm. Hence all further
35
Determination of Beer’s law range and plotting of calibration curve
From the working stock solution, different aliquots of 0.2mL, 0.4mL, 0.6mL, 0.8mL, 1mL, 1.2mL, 1.4mL, 1.6mL, 1.8mL and 2mL were taken in series of 10mL volumetric flasks and volume was made up with pH 1.2 acid buffer solution to get a series of working standard solutions of concentrations 2, 4, 6, 8, 10, 12, 14, 16, 18 and 20µg/mL respectively. The absorbance of samples was obtained spectrophotometrically against the reagent blank at 205nm and a calibration curve was constructed. The procedure was repeated for three times13.
Formulation development of captopril
floating microspheres:
I. Ionotropic gelation method:
Captopril formulation was prepared by conventional ionotropic gelation method, which was previously described without using arachis oil. In brief sodium alginate was dissolved in distilled demineralized water with alginate to produce 2%w/v of solution. To this add drug captopril and polymer carbopol 934p. The resultant solution was extruded using 21G needle into 5%w/v calcium chloride. The resultant microspheres were washed twice with distilled water and kept for drying at room temperature up to 12 hr14.
II. Emulsion gelation method:
Captopril floating microspheres were prepared using emulsion-gelation method. Sodium alginate and carbopol934p were dissolved in water with stirring. Arachis oil was added to polymer solution followed by captopril. The homogenized mixture was extruded into calcium chloride solution with gentle agitation at room temperature. The formed microspheres were allowed to stand for 30 min in the solution for curing, then separated by filtration and dried at room temperature and used for further studies15. Evaluation studies captopril floating microspheres:
Study of effect of formulation aspects on drug-polymer compatibility by spectral analysis randomly selected quantities of microspheres from each batch of the formulations were crushed together. After pulverization and powder sieving, the mixture was analysed by FT-IR16. Characterization of Microspheres:
The developed floating microspheres were studied for various characterizations like size and
shape analysis, drug entrapment efficiency, buoyancy, percentage yield and in vitro drug release study17.
Particle size measurement
The particle size of all the batches of the formulated microspheres in a sample was measured with an optical micrometer fitted with a calibrated eye piece. Calibration of the microscope was done prior to particle size measurement of the microspheres. The mean of 10 microspheres was noted as particle size. All readings are average of three trials ± SD18. Percentage yield
Each batch of the formulated microspheres were weighed after drying. The weight of the collected microspheres was divided by the total weight of all the non volatile components used for the preparation of the microspheres 5.
Percentage yield was calculated using the formul Actual wt of product X 100 Percentage yield =
Total wt of drug and excipients Drug entrapment efficiency
Estimation of drug content in floating microspheres can be carried out by dissolving the weighed amount of crushed microspheres in required quantity of 0.1 N Hcl and analysed spectrophotometrically at a particular wave length using the calibration curve. Each batch should be examined for drug content in a triplicate manner. The entrapment efficiency of floating microspheres is calculated by dividing the actual drug content by the theoretical drug content of microspheres19.
Drug entrapment efficiency:
Experimental drug content X 100 =
Theoretical drug content
36
The time between the introduction of the floating alginate microspheres into the medium and the time taken to rise in the surface was measured as floating lag time20.
Surface Morphology
Examining the surface of a polymeric drug delivery system can provide vital information on the porosity and microstructure of these systems. The distribution and morphology of the surface and the encapsulated matrix can also be directly observed.
The most common technique used for characterizing the surface morphology of drug delivery systems is Scanning Electron Microscopy (SEM). This method offers several advantages, by its versatility of the method, simplicity of sample preparation and ease of operation. The sample sizes, which can be analyzed using this method, range from nanometers to micrometers to centimeters21. Sample prepared for this method should be sufficiently dehydrated since, a vacuum field is necessary for image generation in SEM. Prior to loading the samples for taking the photomicrograph, samples are coated (20-30nm in thickness) with electron-dense coating materials like gold, palladium or combination of both, to enhance the signal emitted by the sample by providing heavy metal atoms with incident beam of electron and, to conduct the accumulated sample charge and heat to the sample holder. The coating process is either carried through sputter-coating or thermal vacuum evaporation.
The surface morphology of the formulated floated microspheres before and after dissolution studies was observed by SEM. The microspheres were placed on steel surface and coated with gold using an ion sputter and were observed at 10.0 KV22.
In vitro drug release studies
In vitro release rate studies were carried out using USP dissolution apparatus Type II. Simulated gastric fluid (900 ml) of pH 1.2 maintained at 37±0.5 oC was used as dissolution medium. An amount of the microspheres equivalent to 50mg of drug was filled in a hard gelatin capsule and was placed in the dissolution medium. The paddle speed was controlled at 50 rpm. Aliquots of 5 ml were withdrawn at different time intervals for up to 10 hr. Each time, a 5ml of fresh medium was added to replace the sample that was withdrawn. Drug content of the microspheres was determined in
triplicates using a UV/Visible spectrophotometer at 205nm, after suitable dilution of the samples23.
Drug Release Kinetics
In order to describe the kinetics of drug release from controlled release preparations, various mathematical equations have been proposed. The Zero order model describes the system, where the drug release is independent of its concentration. According to Higuchi model, the drug release from matrix is directly proportional to square root of time and is based on the Fickian diffusion. The Hixson-Crowell cube root law describes the release from the systems, where it depends on the change in surface area and diameter of the particles with time and mainly applies in case of systems, which dissolute or erode over time. A more comprehensive, but still very simple, semi-empirical equation to describe drug release mechanism from polymeric systems more precisely is the so-called Korsmeyer-Peppas power law24.
To study the mechanism of drug release from the formulated microspheres, the release data was fitted to the following equations:
Zero order equation Qt = k0.t
[1] Where Qt is the percentage of drug released at
time t and k0 is the release rate constant;
Higuchi’s equation
Qt = kH.t1/2 [2]
Where kH is the Higuchi release rate constant;
Hixson-Crowell
(100-Qt) 1/3 = 1001/3 – kHC.t [3]
Where, kHC is the Hixson-Crowell rate constant.
Furthermore, in order to better characterize the drug release mechanisms for the polymeric systems studied, the Korsemeyer-Peppas semi-empirical model was applied:
Qt/Q∞= kKP. tn [4]
Where Qt/Q∞is the fraction of drug released at
time t, kKP a constant comprising the structural
and geometric characteristics of the device, and n, the release exponent, which is indicative of the mechanism of drug release25.
Drug- Polymer Interaction Study
37
FTIR spectra of pure drug, polymers, physical mixture and optimized drug loaded floating capsule were obtained. About 5mg of sample was mixed thoroughly with 100 mg potassium bromide IR powder and compacted under vacuum at a pressure of about 12 psi for 3 minutes. The resultant disc was mounted in a suitable holder in Perkin Elmer IR spectrophotometer and the IR spectrum was recorded from 4000 cm-1 to 625 cm-1 in a scan time of 12 minutes. The resultant spectra were compared for any
spectral changes.
Differential scanning calorimeter: To study the possible interaction between captopril and polymers, DSC study was carried out on pure captopril, polymers and optimized drug loaded floating beads. Differential thermal analysis thermograms were obtained using DSC (Perkin-Elmer, Shelton, U.S). The analyses were
performed under nitrogen (nitrogen flow rate 50 ml/min) in order to eliminate oxidative and pyrrolytic effects at a standard heating rate of 15ºC/minute over a temperature range of 50ºC - 350ºC.
Results And Disscussion
Analytical Method Development for Drug Estimation
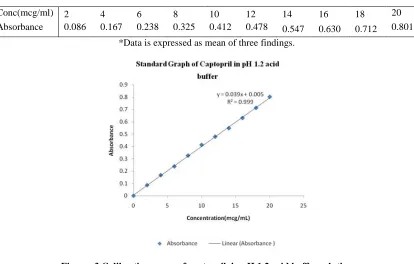
After conducting a number of trials, the concentration range which obeyed Beer’s law was found to be between 0 - 20µg/mL at an absorption maximum of 205nm and their observations was found as indicated in Table 2. A calibration curve was constructed, which had a regression coefficient of 0.9993, as shown in Figure 3.
Table 1: Observations for calibration curve of captopril in pH 1.2 acid buffer Solution
Conc(mcg/ml) 2 4 6 8 10 12 14 16 18 20
Absorbance 0.086 0.167 0.238 0.325 0.412 0.478 0.547 0.630 0.712 0.801 *Data is expressed as mean of three findings.
38
Formulation development of captopril
floating microspheres:
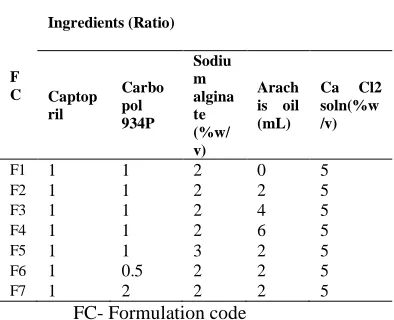
Various batches of floating microspheres formulations F1 to F7 for the drug captopril were developed, as indicated in Table 3. Microspheres were formulated by emulsion gelation method by using polymers sodium alginate and carbopol934P.
Table 2: Composition of captopril floating microspheres: F C Ingredients (Ratio) Captop ril Carbo pol 934P Sodiu m algina te (%w/ v) Arach is oil (mL)
Ca Cl2 soln(%w /v)
F1 1 1 2 0 5
F2 1 1 2 2 5
F3 1 1 2 4 5
F4 1 1 2 6 5
F5 1 1 3 2 5
F6 1 0.5 2 2 5
F7 1 2 2 2 5
FC- Formulation code
Formulations F1 to F4 were prepared by increasing the volume of arachis oil from 0mL to 6mL, keeping drug-polymer ratio at 1:1 and alginate concentration at 2%w/v. Formulation F5 prepared by increasing alginate concentration to 3%w/v, keeping volume of oil at 2mL. Formulations F6 and F7 were prepared by changing the drug-carbopol ratio from 1:0.5 to 1:2, keeping volume of oil at 2mL and concentration of alginate at 2%w/v. In all the formulations calcium chloride concentration was fixed at 5%w/v.
Evaluation studies captopril floating microspheres:
Physicochemical characterization of formulated floating microspheres:
All the batches of the formulated microspheres from F1 to F7 were characterized for various physicochemical parameters like mean particle size, percentage yield, drug entrapment efficiency and percentage buoyancy.
Mean Particle Size:
The mean diameter of conventional alginate microspheres was 1.22 ±0.05mm. The mean diameter of oil-entrapped alginate-carbopol
microspheres containing different amounts of oil is shown in Table 3.
The size of the gel microspheres increased as the amount of oil used was increased. For example, when the amount of arachis oil was increased from 2mL to 6mL, the size of the alginate microspheres significantly increased from 1.27 ±0.07 to 1.38 ±0.08mm. In addition, the size of alginate microspheres also increased with increase in concentration of sodium alginate. This is probably due to increase in viscosity of the dispersion. There is no significant effect of carbopol concentration on particle size.
Table 3: Characterization of the formulated captopril floating microspheres
FC Mean Particle size mm ± SD Percentag e yield (%) ± SD Drug Entrapmen t efficiency (%) ± SD
Bu oya ncy (% ) F- 1 1.22
±0.05 98.5 ±1.58 26.18 ±1.45 0 F- 2 1.27 ±0.07 80.04
±1.03 72.13 ±1.63 95 F- 3 1.31 ±0.03 59.75
±1.72 85.41±1.08 100 F-
4
1.38
±0.08 31.6 ±1.13 48.71±1.06 65 F- 5 1.37 ±0.06 60.56
±1.50 87.32 ±1.89 30 F- 6 1.26 ±0.05 97.2
±1.52 61.81 ±0.72 98 F- 7 1.29 ±0.13 45.68
±1.53 53.45 ±0.98 50 FC- Formulation code
Percentage Yield:
The percentage yield of the formulations F1 to F7 was found to be in the range of 31.6% ±1.13 to 98.5% ±1.58 and it was found that the %yield was decreasing as increasing the amount of oil and carbopol concentration shown in Table 3. Drug Entrapment Efficiency
39
and further decreased beyond 4mL oil. This could be due to the limited emulsifying property of oil and began to leak at higher concentrations. In formulation F5 entrapment was increased, which could be due to increased viscosity shown in Table 3.
Buoyancy of Gel Microspheres
Buoyancy is an important characteristic in sustained drug delivery. Conventional alginate microspheres showed 0% buoyancy without oil is indicative of the important of oil in the formulations, whereas, the oil-entrapped alginate microspheres containing different amounts of oil floated immediately having the lag time less than 1min and remained floating for 24 hours if a sufficient amount of oil was used.
In formulations F2 and F3 the %buoyancy was found to be 95% and 100% respectively, whereas in formulation F4 the %buoyancy was decreased
to 65% as the amt of oil increased, which could be due to leakage of oil at higher concentration. In formulation F5 %buoyancy was decreased as the increase in alginate concentration, which might be due to insufficient amount of oil to impart buoyancy. In formulations F6 and F7 the %buoyancy was decreased while increasing the concentration of carbopol, which could be due to sufficient amount of oil to impart buoyancy at low concentration of carbopol shown in Table 3. In vitro drug release
The dissolution profiles obtained for captopril floating alginate microspheres made with different amounts of oil, showed that the use of different amounts of oil permit efficient control of the release of the drug.
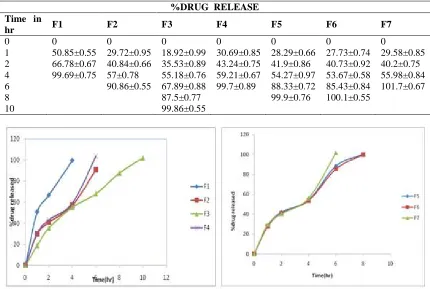
Table 4: In vitro drug release profiles of formulated captopril floating microspheres of formulations F1 to F7
%DRUG RELEASE Time in
hr F1 F2 F3 F4 F5 F6 F7
0 0 0 0 0 0 0 0
1 50.85±0.55 29.72±0.95 18.92±0.99 30.69±0.85 28.29±0.66 27.73±0.74 29.58±0.85 2 66.78±0.67 40.84±0.66 35.53±0.89 43.24±0.75 41.9±0.86 40.73±0.92 40.2±0.75 4 99.69±0.75 57±0.78 55.18±0.76 59.21±0.67 54.27±0.97 53.67±0.58 55.98±0.84 6 90.86±0.55 67.89±0.88 99.7±0.89 88.33±0.72 85.43±0.84 101.7±0.67
8 87.5±0.77 99.9±0.76 100.1±0.55
10 99.86±0.55
In formulation F1 the total drug was released within 4hr, which might be due to absence of oil. In formulations F2 and F3 as the amount of oil increases the drug release was decreased and 90% release in 6hr, 99.9% release in 10hr,
40
The drug release was 100% in 8hr in formulation F5, which clearly indicates that the rate of drug release decreased with the increase of coating thickness, because drug cannot diffuse through the pore of alginate gel matrix.
In formulations F6 and F7 100% of drug was released in 8hr and 6hr respectively. The faster drug release at high concentration of carbopol could be due to insufficient amount of oil to impart control drug release.
Drug Release Kinetics
To study the release kinetics of captopril from the microspheres, the goodness-of-fit method was applied and different kinetic equations were applied to interpret the release rate. The linear nature of curves obtained for zero-order and first order, or Higuchi model, Korsmeyer-Peppas model and Hixson-Crowel model as demonstrated by very close and higher R2 values suggests that the release from the formulations may follow any one of these models.
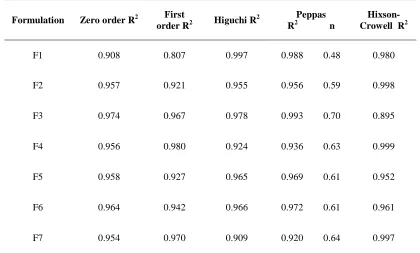
Table 5: Release kinetics of the formulations (R2 values) F1 to F7
Formulation Zero order R2 First
order R2 Higuchi R
2 Peppas
R2 n
Hixson-Crowell R2
F1 0.908 0.807 0.997 0.988 0.48 0.980
F2 0.957 0.921 0.955 0.956 0.59 0.998
F3 0.974 0.967 0.978 0.993 0.70 0.895
F4 0.956 0.980 0.924 0.936 0.63 0.999
F5 0.958 0.927 0.965 0.969 0.61 0.952
F6 0.964 0.942 0.966 0.972 0.61 0.961
F7 0.954 0.970 0.909 0.920 0.64 0.997
42
When the higher R2 values for Higuchi model, Korsemeyer-Peppas model and Hixson-Crowell model are considered, the release data of formulations F1 seem to fit better with the Higuchi model i.e. the release mechanism is Fickian diffusion; the release data of formulations F3, F5 and F6 seem to fit better with Peppas model i.e. drug release mechanism depends on value of release exponent (n); the release data of formulations F2, F4 and F7 seem to fit better with Hixson-Crowell model i.e. the release mechanism is erosion. As the ‘n’ values of formulations F3, F5 and F6 are in between 0.5 to 1, the drug release mechanism from these formulations is anomalous or non-Fickian diffusion.
43
Drug - Polymer Interaction Study
44
Figure: 20 & 21 IR spectrum of pure polymer sample carbopol 934P & physical mixture of drug captopril and polymers sodium alginate and carbopol934P
Table 6: Observed IR values for physical mixture of drug and polymer
S.NO Functional group
Theoretical value (Cm-1)
Observed value (Cm-1)
1 S-H 2800-2400 2566.10
2 C=O
1747.39-1590.63 1746.06
3 C-N
1192.24-1228.06 1385.00
4 O-H 3200-2800 2980.61
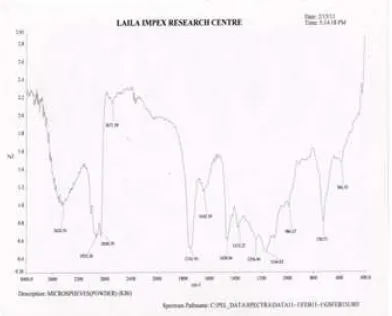
As illustrated in Figure 21, the FT-IR spectra of physical mixture of drug and polymer, related to Table 6, shows a sharp absorption bands at 1385.00cm-1 representing C-N group, 1746.06cm-1 representing C=O group and 2566.10cm-1 representing S-H group. These absorption peak values were matching with the peak values obtained for pure drug sample captopril and polymer sodium alginate and carbopol as illustrated in Figures 18, 19 and 20 respectively, which were corresponding to the theoretical values as indicated in Table 6. Drug Polymer Compatibility
Study of effect of formulation aspects on drug polymer compatibility by spectral analysis
Figure: 22 IR spectrum of drug loaded floating microspheres
Table 7: Observed IR values for formulated drug loaded microspheres
S.NO Functional group
Theoretical value (Cm-1)
Observed value (Cm-1)
1 S-H 2800-2400 2671.58
2 C=O
1747.39-1590.63 1741.93
3 C-N
1192.24-1228.06 1373.27
45
As illustrated in Figure 22, the FT-IR spectra of the formulated microspheres, related to Table 7, shows broad absorption bands at 2671.58cm-1 representing S-H group, 1373.27cm-1 representing C-N group and 1741.93cm-1 representing C=O group. These absorption peak values were matching with the peak values obtained for pure drug sample captopril and polymers carbopol and sodium alginate as illustrated in Figures 18, 19 and 20 respectively, which were corresponding to the theoretical values as indicated in Table 7.
Conclusion
A new floating system of oil-entrapped alginate microspheres was designed and prepared by an emulsion-gelation method and its morphology, buoyancy and its release were investigated in this study. The mean diameter of microspheres increased with the increased amount of oil phase. The oil-entrapped alginate microspheres showed excellent, immediate, and lasting buoyancy in the acidic environment (pH 1.2) of the gastric fluid, if they contained a sufficient amount of oil, depending on the relative density of the oil. From the results formulation F3 was chosen as the most optimized formulation as it possessed all the required physicochemical characters and sustained drug release. The in vitro release data fitted with higher values in Korsemeyer-Peppas model and the release was found to be Non-Fickian diffusion (anomalous transport) as the n value is in between 0.5 to 1.
The enhanced buoyancy property of oil-entrapped alginate microspheres makes them an excellent candidate for an intragastric floating drug delivery system. This property will be applicable to the gastro-retention of drug delivery systems by slowing down the gastric emptying of systems. The lasting intragastric buoyancy of a controlled release dosage form may also provide a suitable manner to deliver drugs that are locally active to the gastric mucosa in the stomach and, hence, achieve a sustained site-specific therapeutic action.
Thus, oil entrapment technique is a novel approach towards the development of multiparticulate system for sustained drug delivery.
Acknowledgements
The authors acknowledge Hetero Drugs limited, Hyderabad, India for gift sample of Captopril & MSN laboratories, Hyderabad, India for gift
samples of sodium alginate and carbopol 934P. The authors also thank the Principal of Mother Teresa College of pharmacy for providing facilities and Principal & Professor of University college of Technology Osmania Unversity, Hyderabad for providing facilities.
“Cite this article”
K. Thadkala, N.P P. kumari, R.Prathyusha, Anju Raju, “Formulation Development, Optimization and Characterization of Floating Beads of Captopril” Int. J. of Pharm. Res. & All. Sci.2013; Volume 2, Issue 2,32-46
References
1. Mohamed HG Dehghan Furquan N Khan. Gastroretentive Drug Delivery Systems: A Patent Perspective.International Journal of Health Research, March 2009; 2(1): 23-44 (215 pg 33-54).
2. Shweta Arora, Javed Ali, Alka Ahuja, Roop K. Khar, and Sanjula Baboota. Floating drug delivery systems: A Review. Oct 19, 2005. 3. Rama Rao K, Prakash Senapati and Das MK.
Formulation and in vitro evaluation of ethyl cellulose microspheres containing zidovudine. J Microencapsul. December 2005; 22 (8): 863-876.
4. Ravindra A Fursule , Ch Niranjan Patre , Satish B Kosalge, Dipak D Patil , Prashant K Deshmukh, Sustained delivery of propranolol by using multiparticulate gastroretentive drug delivery system. IJHS, December 2008;1(4):241-247(146 pg: 60-67).
5. Peeyush Bhardwaji, Himanshu Chaurasia, Deepti Chaurasia, Sunil K. Prajapati and Shobna singh, Formulation and in-vitro evaluation of floating microballoons of indomathacin. Acta Poloniae Pharmaceutica and Drug Research, Vol. 67 No. 3 pp. 291-298, 2010.
6. Rakesh Pahwa, Neeta, Shiv Bhagwan, Vipin Kumar and Kanchan Kohli. Floating microspheres: An innovative approach for gastric retension. Scholars Research Library 2010; 2(4): 461-475.
7. Pradeep Kisan Nimase, Vidyasagar Gali, Prashant Jalindar Ghule. Preparation and evaluation of multiple-unit floating drug delivery system of clarithromycin. IJPRD/2010/PUB/ARTI/VOV-2/ISSUE-9/NOV/021.
46
microspheres containing gentamycin sulphate for nasal administration: Preparation and in vitro characterization. Farmaco 2003; 58: 11-16.
9. Raymond C Rowe, Paul J Sheskey and Sian C Owen: Hand book of pharmaceutical excipients, Fifth edition, Pg No: 111-115, 656-658 and 505-506.
10.Punitha K, Khadhir.s, Ravichandiran.V, Umadevi .S.K, Vaijayanthi .V, Padmapriya. S, Suresh Kumar .S. Intragastric floating drug delivery system of ranitidine hydrochloride formulation and evaluation .International journal of pharmacy and pharmaceutical sciences vol2, issue 4, 2010. 11.C. Nithya Shanthi, Rakesh Gupta Arun
Kumar Mahato. A review on captoril oral sustained/controlled release formulation. International journal of drug development & research. April-june 2010; vol.2: issue 2. 12.Basavaraj B.V, Deveswaran R. Bharath, S.
Sindhu, Abraham Sharon Furtado and Madhavan V. Hollow microspheres of diclofenac sodium-a gastroretentive controlled delivery system. Pak. J. Pharm. Sci., Vol.21, No.4, October 2008, pp.451-454.
13.Mohammed G Ahmed, Satish K, B.P Kiran Formulation and evaluation of gastric-mucoadhesive drug delivery system of captopril Journal of Current Pharmaceutical Research 2010; 2(1): 26-32.
14.Amal HE Kame, Doaea H Al-shora, Yusrym Elayed. Formulation and pharmacodynamic evaluation of caporil sustained release microparticles. Journal of Microencapsulation, June 2006; 23(4): 389– 404.
15.D.A.Bhagwat, A.R.watharkar, S.B.Thorat, S.N.Bhosale. Floatable microsphere of captopril using HPMC and ethyl cellulose by non-aqueous emulsification solvent evaporation technique.
16. Anand Kumar Srivastava, Devendra Narayanarao, Ridhurkar Surabh Wadhwa. Floating microspheres of cimetidine: formulation,characterization and in vitro evaluation. Acta pharm, 55(2005) 277-285. 17.Mohammad Habibur Rahman, Telny
Thomas Chungath and Kumara swamy, Kuppusamy. Comparative evaluation of HPMC K100 and poloxamer 188 influence on release kinetics of curcumin in foalting microspheres. research journal of pharmaceutical, biological and chemical sciences.april-june 2010 RJPBCS Vol 1 issue
2.
18.Maryam Kouchak, Ali Badrian. Preparation and In Vitro Evaluation of a Microballoon Delivery System for Theophylline. Iranian Journal of Pharmaceutical Research 2007; 6(1): 35-42.
19.M.Najmuddin, Sachin shelar, Asgar ali, V.Patel, T.Khan. Formulation and in vitro evaluation of floating microspheres of ketoprofen prepared by emulsion solvent diffusion method. International journal of applied pharmaceutics,vol 2 issue 1,2010. 20.Anil Kumar.S.N, Chitagunta Pavanveena,
Kavitha.K, Vinay kumar.K.V, Arjun N.C., Puneeth.K.P, Shivaraj.A. Development of chronopharmaceutical drug delivery system of trimetazidine hydrochloride for angina pectoris. Int J of Drug Dev and Res, April-June 2010; 2(2).
21.Yuveraj Singh Tanwar, Pushpendra Singh Naruka, Garima Rani Ojha Development and evaluation of floating microspheres ofverapamil hydrochloride Revista Brasileira de Ciências Farmacêuticas Brazilian Journal of Pharmaceutical Sciences vol. 43, n. 04, 2007.
22.Mohanraj Palanisami, Jasmine Khanam, N.Arun Kumar, C Rani, Chitosan microspheres encapsulated with metoprolol succinate: formulation and in – vitro evaluation. J.pharm. and tech.2(2): april-june.2009.
23.Pornsak Sriamornsak, Nartaya Thirawong, and Satit Puttipipatkhachorn. Morphology and Buoyancy of Oil-entrapped Calcium Pectinate Gel Microspheres. AAPS Journal 2004; 6 (3).
24.Akash Yadav, Dr.D.K.Jain. Formulation and evaluation of gastroretentive drug delivery system of ofloxacin. sudarshan publication the pharama research year:2009, vol:01.