CODEN (USA)-IJPRUR,e-ISSN: 2348-6465
Original Article
UPLC Method Development and Validation for Butoconazole
in Active Ingredient
Pritosh pattanaik1, *, K V Subrahmanyam2 1
Jawaharlal Nehru Technological University Hyderabad Kukatpally, Hyderabad- 500 085, Telangana, India.
2
Samskruti college of pharmacy, Ghatkesar, Hyderabad, Telangana, India.
A R T I C L E I N F O A B S T R A C T
_______________________________________________________________________________
1. INTRODUCTION
High performance liquid chromatography (HPLC) has
proven to be the predominant technology used in
laboratories worldwide during the past 30 plus years.
Waters Corporation has taken the principles of HPLC
and further adapted them to create Ultra Performance
Liquid Chromatography (UPLC™), a new separation
technique with increased speed, sensitivity and
resolution. The performance of a column can be
measured in terms of the height equivalent to the
International Journal of Pharma Research and Health Sciences
Available online atwww.pharmahealthsciences.net
Received: 12 Apr 2015 Accepted: 20 May 2015
The objective of the study was to develop UPLC method for the determination of purity of Butoconazole in API and its validation. Ultra performance liquid chromatoghaphy is a better technique than HPLC in terms of performance and speed, so it was selected. The method was developed using Acetonitrile and Sodium dihydrogen ortho phosphate and Acquity BEH C18 (50×2.1mm, 1.7μ) as a stationary phase at a flow rate of 0.25ml/min. Validation was done by linearity, precision, and robustness studies. The precision was found to be within the limits. The linearity studies indicated the drug obeys Beer’s law and revealed the specified range of linearity for drug was between 80μg/ml and 120μg/ml. The robustness was observed from the insignificant variation in the analysis by changes in flow rate, mobile phase ratio, wavelength, column oven temperature and pH. Forced Degradation study revealed the drug degraded initially by the fluence of acid, alkali, and peroxide. Solution stability study showed the drug was not stable for more than 2 h at 25˚C but stable at 5˚C. Key words:Butoconazole , Antifungal activity, Acquity BEH C 18, method development and validation
Corresponding author * Pritosh Pattanaik
External Ph.D , Research Scholar, JNTUH , Hyderabad , Telengana , India, E-mail- [email protected]:
theoretical plates (HETP) which is calculated from the
column length (L) and the column efficiency, or
number of theoretical plates (N). N is calculated from
an analyte retention time (tR) and the standard
deviation of the peak (s). H = L/N. UPLC
instrumentation involves a Binary solvent manager,
sample manager, detector. The types of UPLC
techniques include Normal phase chromatography
(NP-UPLC), Reverse phase chromatography
(RP-UPLC), Size exclusion chromatography, Ion exchange
chromatography and Bio-affinity chromatography .
Chromatographic methods are commonly used for the
quantitative and qualitative analysis of raw materials,
drug substances, drug products and compounds in
biological fluids. The objective of a test method is to
generate reliable and accurate data regardless of
whether it is for acceptance, release, stability or
pharmacokinetics study. The various steps to be
performed for UPLC method development involve
solubility studies to establish the solubility of the API
in a number of aqueous and organic solvents, selection
of the mobile phase, selection of the detector and
detector wavelength, and selection of isocratic or
gradient mode of elution. For UPLC method
development optimization of some critical parameters
is required. They include selection of the buffer, pH of
the buffer and the mobile phase, column, column
temperature, test concentration and injection volume.
Validation of a method is the process by which a
method is tested by the developer or user for reliability,
accuracy and preciseness of its intended purpose.
Methods validation should not be a one-time situation
to fulfill agency filing requirements, but the methods
should be validated and also designed by the developer
or user to ensure ruggedness or robustness. There is no
single validation approach that must always be
employed for a new method. Validation approaches
include zero-blind method, single-blind method,
doubleblind method and inter-laboratory collaborative
study. The parameters involved for validation of UPLC
methods include precision, accuracy, Linit of Detection
(LOD), Limit of Quantitation (LOQ), specificity,
inearity, ruggedness, robustness, solution stability, and
system suitability(capacity factor, resolution, tailing
factor, theoretical plate number. The acceptance
criteria for the different characteristics of validation are
mentioned in ICH Q2A guidelines. The drug used in
the present study is Cefditoren Pivoxil which is a
cephalosporin category antibiotic. It is used to treat
uncomplicated skin and skin structure infections,
community-acquired pneumonia, acute bacterial
exacerbation of chronic bronchitis, pharyngitis, and
tonsillitis. Thus the objective of the present study is to
develop UPLC method for the determination of purity
of Cefditoren Pivoxil in API and validation of the
same. There are very few works that has been done on
this drug by HPLC but no method has been mentioned
by UPLC technique.1
2. MATERIALS & METHODS
2.1 Method Development of Butoconazole
Materials and Instruments:
The fast liquid chromatography was performed using
waters UPLC system with uv detector. Chromatogram
and data were recorded by means of Empower 2
software .The chromatographic system was performed
using an Acquity BEH C18 (50 × 2.1 mm) id., 1.7 m
column. Separation was achieved using a mobile phase
consisted of Sodium dihydrogen ortho phosphate :
acetonitrile in the ratio of 50: 50 , adjusted to pH 2.5
adjust with orthophosphoric acid , at a flow rate of 0.4
mL/min in only 4 minute runtime , injection volume of
1 L . The column temperature was maintained at
40∘C, injection volume was 2 L, and detection
wavelength was set at 294 nm for determination of
Butoconazole.2
Table 1: Solubility study
Reagents Solubility
Ethanol Soluble 1 (M) HCl Soluble 1(M) NaOH Insoluble
Methanol Very slightly Soluble
UPLC Instrumental Condition:
The UPLC system enrolled was Waters Acquity with
Empower -2 Software with Isocratic which is
associated with UV-Visible detector (L-2400).
2.2 Standard & sample preparation for UV-spectrophotometer analysis:
50 mg of Butoconazole standard was transferred into
250 ml volumetric flask, dissolved in mobile phase &
make up to volume with mobile phase. Further dilution
was done by transferring 0.1 ml of the above solution
into a 10ml volumetric flask and make up to volume
with mobile phase.
The standard & sample stock solution:
The standard & sample stock solutions were prepared
separately by dissolving standard & sample in a solvent
in mobile phase diluting with the same solvent.(After
optimization of all conditions) for UV analysis. It
scanned in the UV spectrum in the range of 200 to
400nm. This has been performed to know the maxima
of Butoconazole, so that the same wave number can be
utilized in UPLC UV detector for estimating the
Butoconazole. While scanning the Butoconazole
solution we observed two absorption peaks at 280.[3]
The absorption maxima were at 266 nm. The UV
spectrum has been recorded on UPLC make UV–Vis
spectophotometer model UV-2450. The scanned UV
spectrum is attached in the following page
Fig 1: UV-Spectrum for Butoconazole
Mobile phase preparation:
The mobile phase used in this analysis consists of a
mixture of Buffer (0.05 M Sodium dihydrogen ortho
phosphate, pH adjusted to 3.1) & Acetonitrile in ratio
50: 50.
Preparation of solutions:
Preparation of Standard solution:
Working concentration should be around 10 µg/ml.
Accurately weighed around 25mg of Butoconazole
working standard, taken into a 25 ml volumetric flask,
then dissolved in mobile phase and diluted to volume
with the mobile phase to obtain a solution having a
known concentration of about 1000 mcg/ml. Further
dilutions have been made to get the final concentration
of 10 µg/ml4.
Preparation of Test solution:
Diluted quantitatively an accurately measured volume
of label claim solution with diluents to obtain a
solution containing about a linear range.5-7
Optimized Chromatographic Conditions:
Column : Acquity BEH C-18, 50: 2.1mm,
1.7μm
Mobile Phase : ACN: phosphate buffer (pH
2.5) = 60:40
Flow Rate : 0.25 ml/minute
Wave length : 280 nm
Injection volume : 5L
Run time : 5 minutes
Column temperature : Ambient
Sampler cooler : Ambient
Different Trials for Chromatographic Conditions
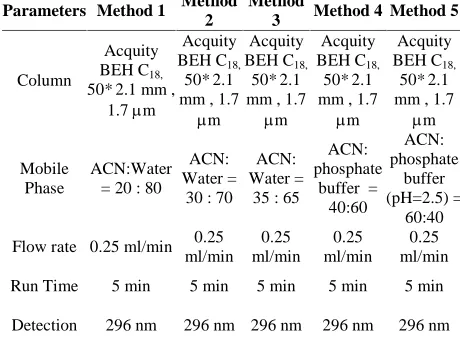
Table 2: The various parameter for method development.
Parameters Method 1 Method 2
Method
3 Method 4 Method 5
Column
Acquity BEH C18,
50* 2.1 mm , 1.7m
Acquity BEH C18,
50* 2.1 mm , 1.7
m
Acquity BEH C18,
50* 2.1 mm , 1.7
m
Acquity BEH C18,
50* 2.1 mm , 1.7
m
Acquity BEH C18,
50* 2.1 mm , 1.7
m
Mobile Phase
ACN:Water = 20 : 80
ACN: Water =
30 : 70 ACN: Water =
35 : 65
ACN: phosphate
buffer = 40:60
ACN: phosphate
buffer (pH=2.5) =
60:40 Flow rate 0.25 ml/min 0.25
ml/min 0.25 ml/min
0.25 ml/min
0.25 ml/min Run Time 5 min 5 min 5 min 5 min 5 min
Column Temp. 40
0C 400C 400C 400C 400C
Injection
volume 5L 5L 5L 5L 5L
Observation Peak broken Very
low response
Tailing peak
Broad
Peak Nice peak
Result Method Rejected
Method Rejected
Method Rejected
Method Rejected
Method Accepted
1.58
1.93
3.75
0.0 0.5 1.0 1.5 2.0 2.5 3.0 3.5 4.0 4.5 5.0 Retention Time (min)
0.0 0.2 0.4 0.6 0.8 1.0 1.2
Intensity
(
mV
)
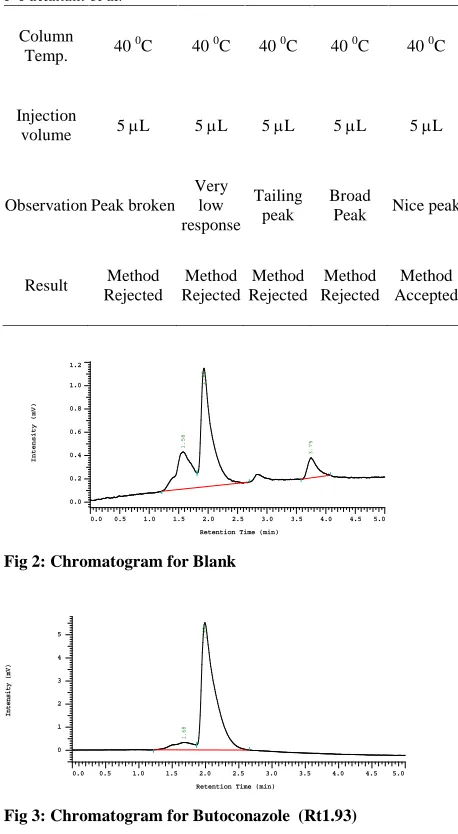
Fig 2: Chromatogram for Blank
1.68
1.99
0.0 0.5 1.0 1.5 2.0 2.5 3.0 3.5 4.0 4.5 5.0 Retention Time (min)
0 1 2 3 4 5
Intensity
(
mV
)
Fig 3: Chromatogram for Butoconazole (Rt1.93)
2.3 Stability/Forced degradation studies:
Following protocol was strictly adhered to for forced
degradation of Butoconazole Active Pharmaceutical
Ingredient (API). The API (Butoconazole ) was
subjected to stress conditions in various ways to
observe the rate and extent of degradation that is likely
to occur in the course of storage and/or after
administration to body. This is one type of accelerated
stability studies that helps us determining the fate of
the drug that is likely to happen after along time
storage, within a very short time as compare to the real
time or long term stability testing. The various
degradation pathways studied are acid hydrolysis, basic
hydrolysis, thermal degradation.9
2.3.1 Acid Hydrolysis :
An accurately weighed 25 mg. of pure drug was
transferred to a clean & dry 25 ml volumetric flask. To
which 0.1 N Hydrochloric acid was added & make up
to the mark & kept for 24 hrs. from that 4 ml was taken
in to a 10 ml volumetric flask & make up to the mark
with mobile phase, then injected into the HPLC system
against a blank of HCl .8
1.53
2.68
0 1 2 3 4 5 6 7
Retention Time (min) 0
5 10 15
Intensity
(
mV
)
Fig 4: Chromatogram showing degradation of Butoconazole in
0.1 N HCl
2.3.2 Basic Hydrolysis
An accurately weighed 10 mg. of pure drug was
transferred to a clean & dry 10 ml volumetric flask. To
which 0.1 N Sodium hydroxide was added & make up
to the mark & kept for 24 hrs. from that 4s ml was
taken in to a 10 ml volumetric flask & make up to the
mark with mobile phase, then injected into the HPLC
system against a blank of . NaOH ( after all optimized
conditions )
1.53
2.69
0 1 2 3 4 5 6 7
Retention Time (min) 0
5 10 15 20 25
Intensity
(
mV
)
Fig 5: Chromatogram showing degradation peak of Butoconazole in 0.1 N NaOH
2.3.3 Thermal Degradation
An accurately weighed 10 mg. of pure drug was
transferred to a clean & dry 100 ml volumetric flask,
make up to the mark with mobile phase & was
maintained at 500C. for 24 hrs. then injected into the
HPLC system against a blank of mobile phase ( after
1.47 1.80
2.71
0 1 2 3 4 5 6 7
Retention Time (min) 0
20 40 60 80
Intensity
(
mV
)
Fig 6:Chromatogram showing thermal degradation related impurity
3. RESULT & DISCUSSION
3.1 Results of degradation studies:
The results of the stress studies indicated the
specificity of the method that has been developed.
Butoconazole was degraded in all conditions except
temperature stress conditions. The result of forced
degradation studies are given in the following table.
Table 3: Results of force degradation studies of Butoconazole API.
Stress condition Time
Assay of active substance
Assay of degraded
products
Mass Balance
(%)
Acid Hydrolysis
(0.1 M HCl) 24Hrs. 31.25 68.36 99.61 Basic Hydrolysis
(0.I M NaOH) 24Hrs. 30.41 68.32 98.73 Thermal
Degradation (50
0C)
24Hrs. 98.36 --- 98.29
3% H2O2 24Hrs. 33.94 65.79 99.73
3.2 Method Validation
3.2.1 Accuracy : Recovery study:
To determine the accuracy of the proposed method,
recovery studies were carried out by adding different
amounts (80%, 100%, and 120%) of pure drug of
BUTOCONAZOLE were taken and added to the
pre-analyzed formulation of concentration 10g/ml. From
that percentage recovery values were calculated. The
results were shown in table-4.
Table.4: Accuracy Readings
Level of Conc Conc. Injected AUC Conc. Found % Recovery
75 30 955630 30.662 102.2067 75 30 945214 30.31 101.0333 75 30 946534 30.35 101.1667 100 40 1248995 40.49 101.225 100 40 1249430 40.51 101.275 100 40 1248253 40.47 101.175
125 50 1562536 51.01 102.02 125 50 1562861 51.02 102.04 125 50 1553408 50.7 101.4
Avg 101.5046 SD 0.451657 % RSD 0.444961
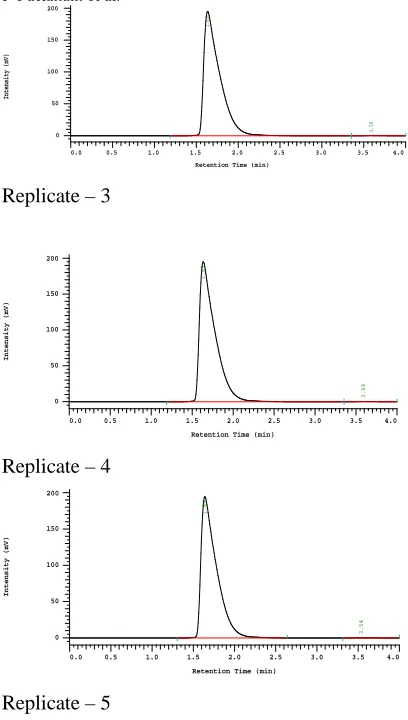
3.2.2 Precision: Repeatability
The precision of each method was ascertained
separately from the peak areas & retention times
obtained by actual determination of five replicates of a
fixed amount of drug. BUTOCONAZOLE (API). The
percent relative standard deviation were calculated for
BUTOCONAZOLE are presented in the table-5.10
Table 5: standard deviation were calculated for Butoconazole
HPLC Injection
Replicates of
Butoconazole
Area Retention Time
Replicate–1 1248623 2.71 Replicate–2 1267192 2.69 Replicate–3 1248613 2.69 Replicate–4 1258741 2.71 Replicate–5 1276495 2.71 Average 1259933 2.702 Standard Deviation 12087.93 0.010954
% RSD 0.959411 0.40542
1.64
3.54
0.0 0.5 1.0 1.5 2.0 2.5 3.0 3.5 4.0 Retention Time (min)
0 50 100 150 200
Intensity
(mV
)
Replicate–1
1.63
3.58
0.0 0.5 1.0 1.5 2.0 2.5 3.0 3.5 4.0 Retention Time (min)
0 50 100 150 200
Intensity
(
mV
)
1.63
3.59
0.0 0.5 1.0 1.5 2.0 2.5 3.0 3.5 4.0 Retention Time (min)
0 50 100 150 200
Intensity
(
mV
)
Replicate–3
1.63
3.59
0.0 0.5 1.0 1.5 2.0 2.5 3.0 3.5 4.0 Retention Time (min)
0 50 100 150 200
Intensity
(
mV
)
Replicate–4
1.64
3.54
0.0 0.5 1.0 1.5 2.0 2.5 3.0 3.5 4.0 Retention Time (min)
0 50 100 150 200
Intensity
(
mV
)
Replicate–5
3.2.3 Linearity & Range : The calibration curve
showed good linearity in the range of 0-80 µg/ml, for
Butoconazole (API) with correlation coefficient (r2) of
0.998 (Fig. 4). A typical calibration curve has the
regression equation of y = 29826x + 41097 for
Butoconazole .
Fig 7 : Calibration curve of .Butoconazole (API).
3.2.4. Method Robustness:
Influence of small changes in chromatographic
conditions such as change in flow rate (0.1ml/min),
Temperature (20C), Wavelength of detection (2nm)
& acetonitrile content in mobile phase (2%) studied to
determine the robustness of the method are also in
favour of (Table-4, % RSD < 2%) the developed
RP-HPLC method for the analysis of Butoconazole ( API).
Table 6: Result of method robustness test
Change in parameter % RSD
Flow (1.1 ml/min) 0.25
Flow (0.9 ml/min) 1.87 Temperature (270C) 1.42 Temperature (230C) 0.36
Wavelength of Detection (223 nm) 1.05 Wavelength of detection (229 nm) 1.04
3.2.5 LOD & LOQ:
The Minimum concentration level at which the analyte
can be reliable detected (LOD) & quantified (LOQ)
were found to be 0.01 & 0.03 µg/ml respectively.
1.53
1.84 2.71
3.31
0 1 2 3 4 5 6 7
Retention Time (min) 0.0
0.2 0.4 0.6 0.8 1.0 1.2
Intensity
(
mV
)
Fig 8: LOD
3.3 System Suitability Parameter
System suitability testing is an integral part of many
analytical procedures. The tests are based on the
concept that the equipment, electronics, analytical
operations and samples to be analyzed constitute an
integral system that can be evaluated as such.
Following system suitability test parameters were
established. The data are shown in Table 7.
Table 7: Data of System Suitability Parameter
S.No. Parameter Limit Result
1 Resolution Rs2 9.15 2 Asymmetry T2 Butoconazole=0.12 3 Theoretical plate N2000 Butoconazole=3246
4. REFERENCES
1. Kumar T, Chitra A, Amrithraj V, and Kumar N,
New RPHPLC method development and validation
for stimation of levofloxacin in tablet dosage form.
Journal of Global Trends in Pharmaceutical
2. Kothekar K, Balasundaram J, Khandhar A, and
Mishra R. Quantitative determination of
levofloxacin and ambroxol hydrochloride in
pharmaceutical dosage form by reversedphase high
performance liquid chromatography. Eurasian
Journal of Analytical Chemistry 2007; 2(1).
3. Santhoshi T, Kumar K, Rao V, Ravipati A.
Development and validation of RP-HPLC method
for multaneous estimation of levofloxacin and
ornidazole in pharmaceutical dosage form. Journal
of Pharmacy Research 2011; 4(11): 3864.
4. Lakka NS, Goswami N. A novel isocratic
RP-HPLC method development and validation for
estimation of 5HMF in Levofloxacin Hemihydrate
intravenous infusion. International Journal of
Research in Pharmaceutical Sciences 2011; 2(1):
45–51.
5. Neckel U, Joukhadar C, Frossard M, W. J¨ager, M.
M¨uller, and B. X. Mayer. Simultaneous
determination of levofloxacin and ciprofloxacin in
microdialysates and plasma by highperformance
liquid chromatography. Analytica Chimica Acta
2002; 463(2): 199–206.
6. Mehta J, Pancholi Y, Patel V, Kshatri N, and Vyas
N. Development and validation of a sensitive
stability indicating method for quantification of
levofloxacin related substancesand degradation
products in pharmaceutical dosage form.
International Journal of PharmTech Research 2010
; 2(3): 1932–1942.
7. Sheikh NW, Tripathi AS, Chitra V, Choudhury A,
Dewani AP. Development and validation of
RP-HPLC assay for levofloxacin in rat plasma and
saliva: application to pharmacokinetic studies.
African Journal of Pharmacy and Pharmacology
2011; 5(13): 1612–1618.
8. Rahar S, Dogra S, Panchru D, Singh P, and. Shah
G. Development and validation of UV-visible
spectroscopic method for the estimation of
levofloxacin hemihydrate in bulk and marketed
formulation. International Journal of Institutional
Pharmacy and Life Sciences 2011; 1(2).
9. Shirkhedkar A and. Surana S J. Quantitative
determination of levofloxacin hemihydrate in bulk
and tablets by UV-spectrophotometry and first
order derivative methods. Pakistan Journal of
Pharmaceutical Sciences 2009; 22(3): 301–302.
10. V N Desai, O E Afieroho, B O Dagunduro, T. J
Okonkwo, and C C Ndu. A simple UV
spectrophotometric method for the determination
of levofloxacin in dosage formulations. Tropical
Journal of Pharmaceutical Research 2011; 10(1):