Research Article
EVALUATION OF
TAB-LETTING MACHINE
CAPABILITY BY
STA-TISTICAL PROCESS
CONTROL METHOD –
A CASE STUDY
B.R.Kirupakar*1, Dr.B.A.Vishwanath1, M. Padma
Sree1, P.Vinoth Kumar2, R.Mathivannan2
1. Aditya Bangalore Institute Of Pharmaceutical Education And Research, Rajiv Gandhi
Uni-versity Of Health Sciences, Karnataka. 2. R&D, Malaysian Pharmaceuticals Industries
Sdn.Bhd.,Malaysia. 3.
Date Received: 16th June 2016; Date accepted: 30th
June 2016; Date Published: 7th July 2016
E-mail:[email protected]
Abstract
This case study discusses the use of statistical process control (SPC) for evaluating tablet com-pression machine capability and efficiency in pharmaceutical industry. The tablet compression process is found to be out of control in compres-sion machine A since the process capability indices for hardness parameter is Cp = 1.2 and Cpk = 0.9. Inthis case the process is not centered and has chance for producing tablet out of specification limit. The compression machine B and C is capable of producing the tablets with the hardness within pre-determined specification limit. In this case the tablet hardness is spread within the specification range and the process is centered and found to be in control with process capability indices more than 1. The study found that though the hardness of the tablet compressed in the compression ma-chine A, B and C are within specification limit, the tablet from compression machine A has chance to fall outside the specification limit and suggest to
closely monitor during the compression in Ma-chine A for this product.
Keywords: Statistical Process Control, Tablet Compression Machine, Process Capability, Control Chart.
INTRODUCTION
Statistical Process Control – An Overview:
Statistical process control is a powerful problem solving technique used for monitoring, controlling, analysing, managing and improving a process us-ing statistical methods. The philosophy of statistic-al process control concept is the output of a process can be brought into a state of statistical control by means of management and engineering interven-tion.
It is used in quality assurance program in total quality management (TQM).Total quality man-agement is a philosophy to bring continuous im-provement activities in an organisation during product manufacturing stage.
Advantages of Statistical Process Control:
SPC could improve process performance by reduc-ing product variability and improvreduc-ing production efficiency.SPC gives quality product thus by reduc-ing variability and defects and ultimately improv-ing business competitiveness. The success and fail-ure in SPC does not depend on company size or resources,but relies on appropriate actions taken to solve the problem.The advantages include (a) Maintaining desired degree of conformance to product specification (b) increases product quality and provide evidence of quality. (c) monitors the variation of a process and minimize the deviation from target value and plays a major role in process improvement.
Control chart and Process Capability:
Op-erator error or defective input materials. The in-formation gathered from control chart can be used to calculate process capability. Process capability can be employed to predict machine perfor-mance.Having done that the machine performance will then be used to determine whether the process has a low or high variability. It can be used during the process to detect incoming quality problems and eliminate the products that are out of specifi-cation limit.There are two types of capability indic-es Cp and Cpk.
Process capability compares the output of an in-control process to the specification limits by using capability indices. Process capability index uses both the process variability and the process specifi-cations to determine whether the process is "capa-ble" We are required to compare the output of a process with the process specifications and make a statement about how well the process meets speci-fication. A capable process is one where almost all the measurements fall inside the specification lim-its.Most capability indices estimates are valid only if the sample size used is 'large enough'. Large enough is generally thought to be about 60 inde-pendent data values.
Variability occurs in every production process. Quality can be measured by using process capabili-ty index. Cp measures the spread of specification relative to three sigma process and Cpk measures how well a given process is generating a specific characteristic with respect to specification limit. Thus it reveals process spread and location with respect to the nearest design specification.
Cp, Cpk Formula
STUDY METHOD:
Case study method was adopted since it involves an in-depth investigation and appropriate when trying to answer the “how” and “why” questions
of research. The aim of this case study was to use SPC technique to evaluate tablet compression ma-chinecapability and efficiency. Three compression machine in the production facility of a pharma-ceutical companywas involved in this study and designated as machine A, machine B and machine C. For this study the X-bar chart was selected for performing data analysis. The chart will provide information about the process variation. The case study was analysed manually by hand written formula. In tablet compression machine A,B and C, the quality characteristic selected for the study is tablet hardness parameter.Samples were collected from tablet compression machine during compres-sion process. 10 Tablets were collected for each sample and tested for hardness and recorded and then calculated for mean value. Following same procedure for 9 more samples mean values were calculated. The specification limit for hardness pa-rameter was 1 to 6 kg/cm2.
RESULT AND DISCUSSION:
The result of the case study conducted are summa-rised as follow:
Tablet hardness is a important quality parameter to fulfil the product specification requirement and also it has impact of bioavailability parameter of few drugs. Especially they have huge impact on BCS class II drug due to their low solubility nature. Apart from this other in process test parameter were performed as routine test during compres-sion of the tablets. Figure 1 shows the X-Bar chart from the tablet hardness of the tablet compressed incompression machine A.
Cpk value of tablet compression machine is 0.93 (Cpk<1) which mean the process is not centered. Since the process is not centered, it need to be closely monitored to see the up and down swing of the mean values are still within the specification limit. The same batch blend was compressed in machine B at higher speed of the compression
ma-chine. The hardness of 10 reading calculated dur-ing the compression process shown in X-bar chart figure 2.
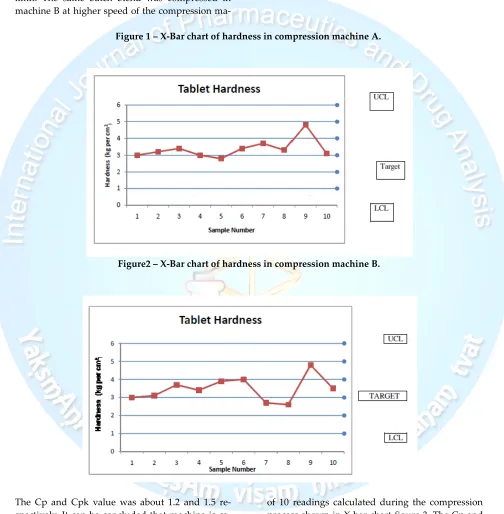
Figure 1 – X-Bar chart of hardness in compression machine A.
Figure2 – X-Bar chart of hardness in compression machine B.
The Cp and Cpk value was about 1.2 and 1.5 re-spectively. It can be concluded that machine is ca-pable of producing tablet within the specification limit and the process is centered. The same batch blend was compressed in machine B at higher speed of the compression machine. The hardness
CONCLUSION:
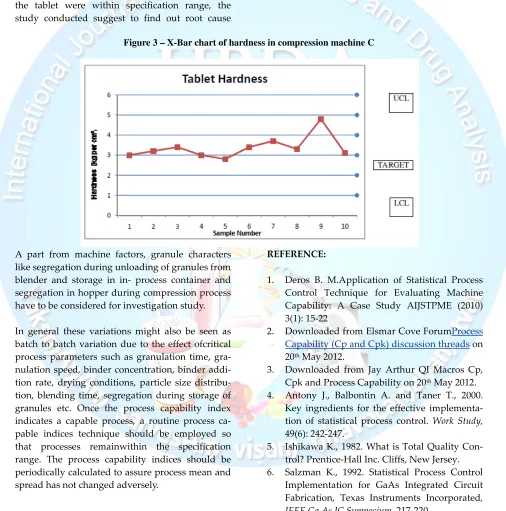
The case study conducted in the 3 compression machine had showed the importance of SPC for monitoring and ensuring the tablet compressed meet the pre-established specification limit. Statis-tical process controls were used to evaluate ma-chine capability and process centerness of the compression process during compression stage of the product.In machine A though the hardness of the tablet were within specification range, the study conducted suggest to find out root cause
since Cpk was less than 1 and take necessary ac-tion. In compression machine B and C, the tablet hardness was within statistic control limit. Cp and Cpk values were above 1 suggesting the consistent and centerness of the compression process. The observed difference in machine A might be due to machine factors such as design, machine specifica-tion,machine speed,machine condition,die and punches used ,hopper design etc.
Figure 3 – X-Bar chart of hardness in compression machine C
A part from machine factors, granule characters like segregation during unloading of granules from blender and storage in in- process container and segregation in hopper during compression process have to be considered for investigation study.
In general these variations might also be seen as batch to batch variation due to the effect ofcritical process parameters such as granulation time, gra-nulation speed, binder concentration, binder addi-tion rate, drying condiaddi-tions, particle size distribu-tion, blending time, segregation during storage of granules etc. Once the process capability index indicates a capable process, a routine process ca-pable indices technique should be employed so that processes remainwithin the specification range. The process capability indices should be periodically calculated to assure process mean and spread has not changed adversely.
REFERENCE:
1. Deros B. M.Application of Statistical Process Control Technique for Evaluating Machine Capability: A Case Study AIJSTPME (2010) 3(1): 15-22
2. Downloaded from Elsmar Cove ForumProcess
Capability (Cp and Cpk) discussion threads on
20th May 2012.
3. Downloaded from Jay Arthur QI Macros Cp, Cpk and Process Capability on 20th May 2012.
4. Antony J., Balbontin A. and Taner T., 2000. Key ingredients for the effective implementa-tion of statistical process control. Work Study,
49(6): 242-247.
5. Ishikawa K., 1982. What is Total Quality Con-trol? Prentice-Hall Inc. Cliffs, New Jersey. 6. Salzman K., 1992. Statistical Process Control
Implementation for GaAs Integrated Circuit Fabrication, Texas Instruments Incorporated,
7. Deleryd M., 1998. On the gap between theory and practice of process capability studies, In-ternational Journal of Quality & Reliability Man-agement, 15(2): 178-191.
8. Jagadeesh R. and Babu A S., 1994. Process Ca-pability Assessment with Tool Wear: An In-vestigative Study, International Journal of Quali-ty & ReliabiliQuali-ty Management, 11(2): 51-62. 9. Mason B. and Antony J., 2000. Statistical
process control: an essential ingredient for im-proving service and manufacturing quality,
Managing Service Quality, 10(4): 233-238. 10. Montgomery D.C., 2005. Introduction to
Statis-tical Quality Control-Fifth edition, John Wiley.
11. Yang S.F. and Yang C., 2004. Economic statis-tical process control for over-adjusted process mean, International Journal of Quality & Reliabil-ity Management, 21(4): 412-424.
12. Benton W.C., 1991. Statistical process control and Taguchi method, International Journal of Production Research, 29(9): 1761-1770.
13. Talbot N., 2003. The use of automated optical testing (AOT) in statistical process control (SPC) for printed circuit board (PCB) produc-tion, Circuit World, 29(4): 19–22.