Brain Computer Interface-Controlling Devices
Utilizing The Alpha Brain Waves
Rohan Hundia
Abstract: This paper describes the development and testing of an interface system whereby one can control external devices by voluntarily controlling alpha waves, that is through eye movement. Such a system may be used for the control of prosthetics, robotic arms and external devices like wheelchairs using the alpha brain waves and the Mu rhythm. The response generated through the movement of the eye (detecting and controlling the amplitude of the alpha brain waves) is interfaced and processed to control Robotic systems and smart home control. In order to measure the response of alpha waves over different lobes of the brain, initially I measured these signals over 32 regions using silver chloride plated electrodes. By the opening and the closure of the eyes and the movement in the up-down, left-right directions and processing these movements, measuring them over the occipital region I was able to differentiate the amplitude of the alpha waves generated due to these several movements. In the First session (testing period), subjects were asked to close and open their eyes and they were able to control limited movements of a Robot and a prosthetic arm. In the Second 2session the movement of the eyes was also considered (left-right, up-down) along with the opening and closure, during this time span they were able to control more dimensions of the robot, several devices at the same time using different eye movements.
Key words: alpha waves, Mu rhythm, occipital and eye movements
————————————————————
Over the past few areas the research in the field of brain interfaces, human-machine interfaces has taken a new rise but all these brain interfaces are designed on a few basic mechanisms. This paper tends to explain the conceptual time and frequency analysis chiefly of the alpha brain signals measured over the regions O1 and O2 (regions of the occipital lobe).Note that this system doesn’t chiefly work on the basis of measuring the FFT (Fast Fourier Transform). It doesn’t measure the amplitude and the frequency response curve of the brain signals at every point or tangent. It analyses the data (amplitude, frequency elicit response) over the peak of the sinusoidal alpha wave captured. Such a system can be used by the differently abled people to gain thought processed control over various prosthetics, wheel chairs and functioning robotics systems. Donchin and Farewell in their paper ―Talking off the Top of Your Head‖ elegantly describe of utilizing the P300 elicit response for control of prosthesis, this paper puts down the mechanism of brain interfaces in a much standardized and basic way working on a different basis that is the alpha waves unlike the P300 Event Related Potential.
Brain anatomy- In order to acquire the brain signals a basic understanding of these signals and the anatomy of the brain is highly essential. This paper would explain and encompass you with a systematic understanding of the brain. In my project I used the alpha brain signals which have a frequency between 8-12 Hz. These alpha brain waves are mainly generated by the closure of the eyes and one can vary the amplitude of these waves by eye movements. This is measured over the region of the visual cortex, that is, the occipital lobe. Now, a major reason why the alpha waves are used instead of the Delta, Beta, Theta waves is simply because these waves can voluntarily and easily be controlled by paralytic people to gain motor control. But like all the other brain signals, the alpha waves haveextremely low amplitude ranging from around 40-180 microvolts. The investigation of brain processes was done on humans with high and low levels of individual α-frequency determined in a quiescent state during the perception of sensory signals.
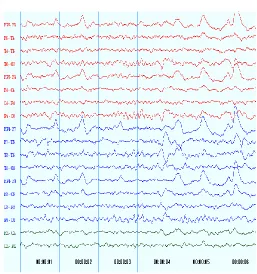
Fig 1.1 (Represents the brain signals measured using an EEG system over 32 regions using the Neuromax Software)
282 Fig 1.2 (Depicts the brain waves over regions and also
shows the frequency spectrum maps over these regions)
As shown in the figure the maximum amplitude of the alpha waves are seen the region 01 and 02. This data was recorded over a subject who was asked to blink every 1.5 seconds. Therefor as we see the data between time span 3:16 seconds and 3:17 seconds we see a higher crest in the wave depicting an increase in the amplitude of the alpha signals over the occipital (02) region. The brain map recorded during that time also depict an increase in the alpha amplitude over the occipital and motor cortex region which is clearly depicted by a change in color over the occipital region. Therefor we further carried out recordings over only the three regions: Fp2, O2 and A1.
Fig 1.3 Shows the data recorded over the regions Fp2, O2 and A1
Thus we came up with the conclusion that since maximum response of the alpha waves is seen in the regions of 02. We chose the three regions for the placement for the electrodes. For the convenience of the user we chose the region Fp1 since there is no hair interference in this region and the signal quality acquired would be much reliable and better.
Fig1.4 (Represents the regions where the electrodes have been placed. Fp1 (Frontal Lobe –left forehead region), O1 (left region of the occipital lobe) and A1 (region near the
mastoid bone of the left ear)
The figure shown above shows the three regions where the electrodes are placed. Note that we use the electrode near the mastoid region (A1) because this electrode is used as a reference electrode with absolutely zero potential so as to act as differentiating electrode for the other two electrodes places. The electrodes used are plated with silver chloride for better conductivity and have a diameter of 15mm to 20 mm for lesser attenuation. The use of a conductive gel for example Ten20 Paste was also considered for more efficient and accurate data and results.
Mechanism and Construction of The Brain Interface system(The electronics behind the interface system) After the acquisition of the brain waves using the electrodes have been done signal processing and filtration is required to obtain the required brain wave component. A major issue and the problems that one comes across is the low amplitude of these brain signals. The brain waves have extremely low amplitude ranging from 10-200 microvolts; there for a high amount of amplification is required. Now, I would explain the various stages of the setup. Coming up to the first stage-
1. Amplification- The brain signals have low amplitude of 10-200 microvolts and hence need to be amplified to a desirable voltage which can be detected by other components and microcontrollers. To amplify the voltage AD620 instrumentation amplifier is used to obtain a gain of 22455. The AD 620 is a differential amplifier which calculates the difference between the Input pins 2 and 3 and amplifies the difference which can be varied by setting up the resistor value between pin 1 and 8. The formula for gain for this chip is 1+49400/R, where R is the value of the resistor set according to the gain required. So in order to amplify the voltage from around 100 microvolts to around 2.2 volts a gain of 22455 is required and hence 2.2 ohms resistor is required.
Fp2 (Region of the frontal Lobe)
Fig 1.5 (Represents the Pin configuration of the Ad620 Instrumentation amplifier.)
The diagram shown above (Fig 1.5) represents how the pins have to be connected in the circuit. The output of the differential voltage is obtained as output in Pin 6. So therefore an output of 2.2 volts would be obtained at pin 6. It is important to consider the fact that AD620 is a dual supply Integrated Circuit and thus two batteries each on 9v volts will be connected to Pin 4, Pin 7 and Pin 5 (GND). The signals that have been captured using the electrodes and amplified using this Chip contains all the components of the brain signals and some kind of external noise which is eliminated in the later shown steps.
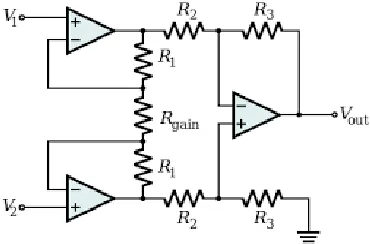
Fig 1.6 (The schematic shown above represents that AD 620 is made up of three operational amplifiers.
Fig1.6 shows the integrated circuit present in the Ad620 chip. The Ad620 comprises three operational amplifiers. At first each amplifier 1 and 2 amplifies the voltage input individually and the net amplified voltage is further amplified by amplifier three and thus the final voltage output is obtained. Now after using this chip we have obtained a substantial measurable voltage of the brain waves having a voltage of 2.2 volts.
2. Filtration- Furthermore, this paper would now put in details of the filtration part required further. The acquired signals that were captured using electrodes not only consisted of the brain waves component but it also consisted of the external noise ranging from around 45-65 Hz. Also for the functioning of the external devices all that we required was the alpha component so the rest of the brain waves need to be filtered out. In order to do so , I developed a 9-12 Hz Band Pass Filter which consists of a 9hz high pass filter and a 12hz low pass filter.
Butterworth low pass filter was designed. A simple low pass filter has a very simple design comprising a resistor and a capacitor but due to high amount of attenuation a simple low pass filter cannot be used. Also in order to increase the efficiency of the filter we need to increase the order of the filter. But again a similar problem is seen with an increase in the orders of the filters the filter becomes more efficient but at the same time the rate of attenuation also increases. So in order to decrease the rate of attenuation one needs to add an operational amplifier after each stage of the filtration.
Fig 1.7 (Graphical representation of the amplitude drop with an increase in frequency above the cutoff frequency in low
pass filters)
284 Fig 1.8 (Circuit diagram of 2Hz active Butterworth second
order low pass filter)
In the circuit shown above there are 2 resistors and 2 capacitors this is done so as to increase the order of the filter for greater efficiency and to obtain a steeper slope on the graph (closer slope to ideal filters).
Fig 1.9 (Frequency response of various orders of the low pass Butterworth filter)
High pass filter- The usage of a high pass filter is also essential so as to eliminate all the frequencies below 9 Hz that is the Theta and Delta wave component. In order to do so I designed a 9 Hz third order Butterworth high pass filter comprising three RC circuits with one amplifier so as to decrease rate of attenuation. The only difference between the Low pass filter and High pass filter is the reverse arrangement of the Resistor and capacitor.
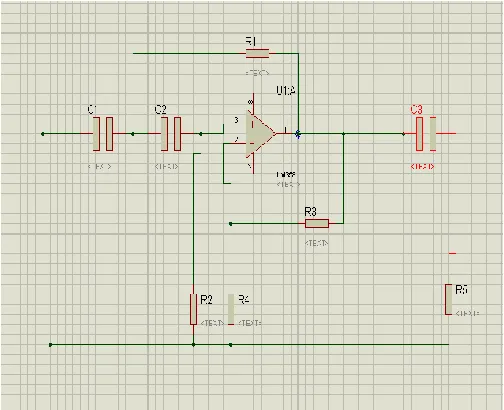
Fig 2 (Circuit of a 9 Hz third order Butterworth high pass filter)
Now after placing the values for a 9 Hz high pass filter into the formula we get the reverse values of the resistor and capacitors to 80 ohms and 220 microfarads respectively. The usage of a third order filter is essential so as to obtain a steeper slope and hence a real 9Hz filter will actually now essentially work as an ideal 9Hz filter. These filtration procedures completely explained how the unwanted frequencies were removed and noise interference and power supply AC interference frequency component was also removed in the setup. Further, this paper will now put in details of the Peak to Peak detection of the wave so as to obtain the voltages at every peak of the filtered alpha brain wave obtained.
3. Peak to Peak Detection- It is extremely difficult to obtain the data of the wave at every point because the brain waves change rapidly and hence are extremely dynamic over a period of time which requires complex algorithm calculations and procedure of FFT. So, therefore we calculated the data of the waves at the peak which we measured by devising a Peak to Peak detection circuit. The diagram shown below represents the circuit diagram, now we can also control for how much time we want the peak to remain constant:
T= 5*R*C (Where T is the time desired, R is the Resistance and C is the value of the capacitance) Now with the calculations we wanted the peak to remain constant for 11 seconds so as there is a substantial amount of time for the microcontroller (explained later in the paper) to differentiate between amplitude of the brain waves on eye closure and movement. So, therefore we came up with values 10 microfarads and 220 K Ohms for capacitor and resistor respectively.
Fig 2.1 (Circuit of the peak to peak detector with 11 Seconds of peak consistency)
Mechanism on which the peak to peak detector works A capacitor has 2 plates which are made such that they only allow current to pass thorough the capacitor when it is in the process of charging itself by the current flowing through it. When the plates become fully charged, they don’t allow any more current to flow up till the time the plates get fully discharged. Therefore, the smaller charges are used up to charge the plates and when the plates become charged they don’t allow the peak voltage to pass and thus send them as output while the unwanted voltages are sent to the ground. For 11 seconds the peak voltage remains constant and in that time the plates discharge further repeating the mechanism. The Figure shown (Fig 2.2) below depicts the mechanism of the Peak detector.
Fig 2.2 (This diagram shown above depicts the concept of peak detection and tangents of the wave)
With this hardware basis we were successfully able to capture the peak voltages of the amplified and filtered alpha brain waves when they were generated. Now, in order to differentiate between the amplitude of the alpha waves generated over the occipital region we used the Arduino Uno microcontroller and programmed it in such a way that on varied input of amplitude of alpha waves different devices could be controlled.
it is quite possible to use the alpha brain waves like a switch or a trigger to gain control over electronic devices. By recording the data over a few seconds the subject can gain control over devices like robots and other smaller devices. This setup was interfaced with a prosthetic arm as well and the subject could gain control over his prosthetic arm just by mere eye movements. Although this prototype has been tested for a variety of applications, it has a certain drawback; the control over any device is restricted to a scope. It cannot be used to attain various degrees of freedom of control, since we have used only three electrodes therefore the data recorded is restricted and therefore the control over many devices is also restricted. Furthermore, the communication speed between the interface and the user has also not given very promising results. After the eye movement has been done, the response over any device is 2.89 seconds later. This time gap is because we have not measured the tangent of every point of the wave, we have solely measured the peak amplitude of each wave. Despite of such drawbacks it can be used for smart home control, trans-cranial magnetic simulation for brain to brain interfacing, controlling robots, wheelchairs and bionics. What this paper describes is just a drop in the vast field of brain interfacing. ―When the Doors of Perception Are Open Wide Everything Seems Like Infinity‖-Laplace
References
[1] ―Talking of the Top of your head: toward a mental prosthesis utilizing event related brain potential‖ by Donchin and Farwell : 510-515
[2] ―Surprise...Surprise?‖ by Donchin : 498-507
[3] ―Brain processes during the perception of sensory signals in men with high and low output α-frequencies.‖ Morenko A.
[4] ―Stimulus-driven brain oscillations in the alpha range: entrainment of intrinsic rhythms or frequency-following response?‖ Keitel C, Quigley C, Ruhnau P.
[5] ―What limits the performance of current invasive brain machine interfaces?‖ Baranauskas G.
[6] ―Brain-computer interface (BCI) evaluation in people with amyotrophic lateral sclerosis.‖ McCane LM, Sellers EW, McFarland DJ, Mak JN, Carmack CS, Zeitlin D, Wolpaw JR, Vaughan TM
[7] ―Chapter 1 Brain-Computer Interfaces and Human-Computer Interaction‖ by Desney Tan and Anton Nijholt.
[8] ―Wireless EEG with individualized channel layout enables efficient motor imagery training.‖ Zich C, De Vos M, Kranczioch C, Debener S.
[9] ―Brain–Computer Interfaces: A Gentle Introduction‖ Bernhard Graimann, Brendan Allison, and Gert Pfurtscheller
The peak voltages are given the output and the output voltage remains constant for 11 seconds and thus changes respectively with the wave.
The unwanted tangents of the wave are earthed, passing through the capacitor