doi:10.5194/nhess-13-659-2013
© Author(s) 2013. CC Attribution 3.0 License.
and Earth System
Sciences
Atmospheric
Chemistry
and Physics
Open AccessAtmospheric
Chemistry
and Physics
Open Access DiscussionsAtmospheric
Measurement
Techniques
Open AccessAtmospheric
Measurement
Techniques
Open Access DiscussionsBiogeosciences
Open Access Open Access
Biogeosciences
DiscussionsClimate
of the Past
Open Access Open Access
Climate
of the Past
Discussions
Earth System
Dynamics
Open Access Open Access
Earth System
Dynamics
DiscussionsGeoscientific
Instrumentation
Methods and
Data Systems
Open Access
Geoscientific
Instrumentation
Methods and
Data Systems
Open Access DiscussionsGeoscientific
Model Development
Open Access Open Access
Geoscientific
Model Development
DiscussionsHydrology and
Earth System
Sciences
Open AccessHydrology and
Earth System
Sciences
Open Access DiscussionsOcean Science
Open Access Open Access
Ocean Science
DiscussionsSolid Earth
Open Access Open Access
Solid Earth
DiscussionsOpen Access Open Access
The Cryosphere
and Earth System
Sciences
Discussions
Multi-temporal SAR interferometry reveals acceleration of bridge
sinking before collapse
J. J. Sousa1,2and L. Bastos2,3
1Department of Engineering, School of Science and Technology, University of Tr´as-os-Montes e Alto Douro,
Vila Real, Portugal
2Center of Geology, University of Porto, Porto, Portugal
3Department of Geosciences, Environment and Spatial Planning, Faculty of Science, University of Porto, Porto, Portugal
Correspondence to: J. J. Sousa ([email protected])
Received: 1 June 2012 – Published in Nat. Hazards Earth Syst. Sci. Discuss.: – Revised: 3 December 2012 – Accepted: 23 January 2013 – Published: 18 March 2013
Abstract. On the night of 4 March 2001, at Entre-os-Rios (Northern Portugal), the Hintze Ribeiro centennial bridge collapsed killing 59 people traveling in a bus and three cars that were crossing the Douro River. According to the na-tional authorities, the collapse was due to two decades of uncontrolled sand extraction which compromised the stabil-ity of the bridge’s pillars, together with underestimating the warnings from divers and technicians. In this work we do not intend to corroborate or contradict the official version of the accident’s causes, but only demonstrate the potential of Multi-Temporal Interferometric techniques for detection and monitoring of deformations in structures such as bridges, and consequently the usefulness of the derived information in some type of early warning system to help prevent new catastrophic events. Based on the analysis of 52 ERS-1/2 covering the period from May 1995 to the fatal occurrence, we were able to detect significant movements, reaching rates of 20 mm yr−1, in the section of the bridge that fell into the Douro River, which are obvious signs of the bridge’s insta-bility. These promising results demonstrate that with the new high-resolution synthetic aperture radar satellite scenes it is possible to develop interferometric based methodologies for structural health monitoring.
1 Introduction
Currently, most bridges are inspected at regular intervals through visual inspections of the deck, superstructure and substructure. In Portugal, as well as in other countries,
several bridges are obsolete or structurally deficient. Moni-toring of these important structures of the road network is vi-tal for the safety of the citizens. To safely extend the lifetime of these bridges, rigorous inspection and proper maintenance would be necessary; these interventions are both costly and time consuming making it usually impossible to survey every bridge, including older bridges which many times represent higher risks.
Modern space-borne SAR sensors provide spatial resolu-tions of the order of a meter. In high-resolution SAR data (TerraSAR-X, COSMO-SkyMed, etc.) even small bridges are covered by a large number of pixels. These data are being tested for structural health monitoring (SHM) applications with very satisfactory results (Ghuman and McCardle, 2012; Zhang et al., 2010).
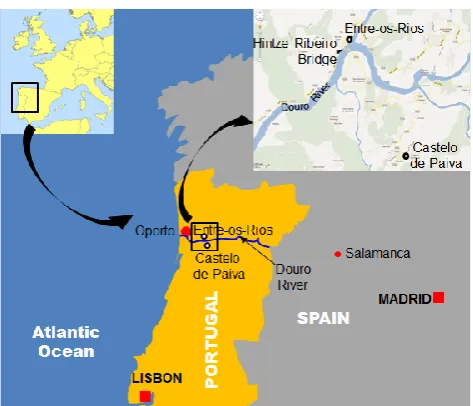
The Hintze Ribeiro, concrete and metal, bridge cross-ing the Douro River at Entre-os-Rios, some 30 km east of Oporto (Fig. 1), opened in 1887 and collapsed on 4 March 2001, sending a bus full with day-trippers and three cars into the swollen river. With no survivals, this crash killed 59 people and still remains the most serious road accident in the Portuguese history. This tragic event became known as the Entre-os-Rios tragedy.
The Hintze Ribeiro bridge had a total length of 336 m, di-vided in different segments (Fig. 2a). The intermediate com-ponents of the deck still hold on six granite pillars, with height varying between 15 m and 30 m. The collapse in-volved the pillar P4 (we use designations P1 to P6 for the pillars of the bridge starting from the right bank). Figure 2 shows a scheme of the collapsed bridge.
660 J. J. Sousa and L. Basto: MTI reveals Bridge sinking before collapse
Fig. 1. Location map of the study area.
The steady deterioration and consequent collapse of the Hintze Ribeiro bridge highlighted the importance of develop-ing effective bridge inspection and monitordevelop-ing approaches to ensure their safety and extend their lifetime. In this paper we present the results of the analysis of 5.5 yr of SAR data, ob-tained from moderate resolution satellite sensors (ERS-1/2) and Multi-Temporal Interferometry (MTI) techniques, over the Hintze Ribeiro bridge. Data show a significant deforma-tion during the period of this analysis, a few years prior to the bridge collapse. The results clearly reveal the potential of in-terferometric techniques to monitor the stability of these type of structures. SAR interferometry, with its potential to detect mm yr−1 displacements, can thus be a very helpful tool to support the development of reliable deformation models to-wards the assessment of rupture risks and the establishment of alarm thresholds to be used in early warning systems, as many stable structures have, in general, movements that are below that level.
2 Data used
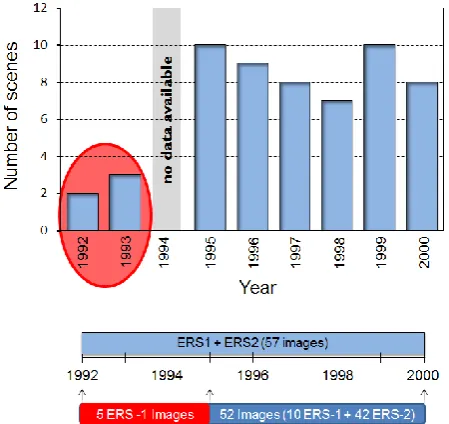
Entre-os-Rios and its surroundings are covered by a total of 57 ERS-1/2 scenes from descending satellite track 452, cov-ering the time period until the bridge collapse (from June 1992 to December 2000). However, all the SAR scenes ac-quired before 1995 (five scenes) were discarded from the dataset to ensure continuity and suitability of the interfero-metric stack. The reason for this procedure relates to the fact that ERS had been moved out its 35 days orbit during the years 1993–1994. Figure 3 shows the SAR scenes distribu-tion over the acquisidistribu-tion year and highlights the five scenes excluded from the MTI processing. Finally, in order to avoid high Doppler values due to the ERS-2 gyroscopes failures all the scenes acquired after the end of 2000 have been also discarded from the processing.
Fig. 2. The Hintze Ribeiro bridge. (A) Schematic representation of the bridge with the collapsed components highlighted in red; (B) schematic representation of the bridge pillars; (C) picture of the bridge after the accident.
In order to remove the topographic phase from the differ-ential interferograms, data from the C-band Shuttle Radar Topography Mission (SRTM) was used to obtain a Digital Elevation Model (DEM) of the area of interest with resolu-tion of 3 arc-second (90 m) and 10 m height accuracy. Pre-cise orbit data for ERS-1/2, provided by Delft Institute for Earth Observation and Space Systems (DEOS) (Scharroo and Visser, 1998), were used for removal of flat-earth phase contribution from the differential interferograms.
3 Applied processing methodology
SAR images are complex as they contain two components per pixel, from which the amplitude and phase signal can be derived. Interferometric techniques for ground deformation detection and monitoring, exploit the information contained in the radar phase of at least two complex SAR images ac-quired in different epochs over the same area, by forming an interferogram. This is the basic concept of Differential In-terferometry (DInSAR). The repeated acquisition of images over a given area is usually performed by using the same sensor (or identical sensors, e.g. ERS-1 and ERS-2). For a summary of DInSAR principle, let us consider the scheme of SAR image acquisition shown in Fig. 4, considering a single pixel footprint P.
InSAR techniques exploit the phase difference ofφS and φM, named interferometric phase1φint. Assuming that the terrain is stable between acquisitions (i.e.D (t )=0⇒P1≡ P), this phase is related to the distance difference SP–MP. When the point moves from P to P1 between two im-age acquisitions, besides the topographic phase component φtopo,1φintalso includes the terrain movement contribu-tion (φdefo). In the general case 1φint is given by Eq. (1):
1φint=φS−φM=SP−MPλ 4π
+SP1−SPλ 4π
+φatmo+φN
=φtopo+φdefo+φatmo+φN,
(1)
Fig. 3. Distribution over time of the images used in this study. The scenes acquired before 1995 have been discarded from the dataset to ensure continuity and feasibility of the interferometric analysis.
radar wavelength. For a general review of SAR interferome-try, see Hanssen (2001), Rosen et al. (2000) and Bamler and Hartl (1998).
Different factors may reduce (or even compromise) the quality of DInSAR results. The most important one is related to temporal decorrelation phenomena caused by the variation of the electromagnetic properties of the radar targets. If the phase reflectivity value of a certain image pixel changes with time, the generation of an interferogram, i.e. the computation of the difference between the phase values of two SAR im-ages, cannot highlight the displacement values. The impact of temporal decorrelation phenomena increases as the tempo-ral baseline of the interferogram (i.e. the time lag between the two SAR acquisitions) increases. Apart from phase decor-relation, propagation effects in both troposphere and iono-sphere can differ significantly during the first and the second acquisition, thus creating phase disturbances hindering the interpretation of SAR interferograms.
The development of multi-interferogram techniques al-lowed overcoming the limits of conventional DInSAR ana-lyzes by identifying a small subset of radar targets, called Persistent Scatterers (PS), only slightly affected by phase decorrelation phenomena and where the signal-to-noise ra-tio is extremely favorable. PSs correspond to radar targets already present in the area of interest, such as man-made objects or natural elements having a stable radar signature in time and where the signal level is much higher than the background noise of the sensor. As basic techniques that are used in multi-temporal processing, the Persistent Scatterers Interferometry (PSI) methods and Small Baselines (SB) tech-niques should be mentioned.
Fig. 4. DInSAR basic concept.
Stanford Method for Persistent Scatterers-Multi-Temporal InSAR (StaMPS-MTI) combines both PSI and SB meth-ods allowing the identification of scatterers that dominate the scattering from the resolution cell (PS) and slowly-decorrelating filtered phase (SDFP) pixels. We based our work mainly on this method, in which assumptions are made about the statistical behavior of the several phase contribu-tions (shown in Eq. 1) superimposing the deformation term. One of the basic ideas of this method is to assess the tem-poral stability of the radar targets directly from the interfer-ometric phase. However, since the term representing phase noise is masked by several other terms like atmosphere or phase due to orbital inaccuracies, StaMPS uses an elaborate filtering procedure to remove all these undesired phase con-tributions.
The different steps involved in the StaMPS-MTI process-ing chain are described in detail in Hooper (2008), Hooper et al. (2004, 2007), and Sousa et al. (2010, 2011).
4 MTI results
662 J. J. Sousa and L. Basto: MTI reveals Bridge sinking before collapse
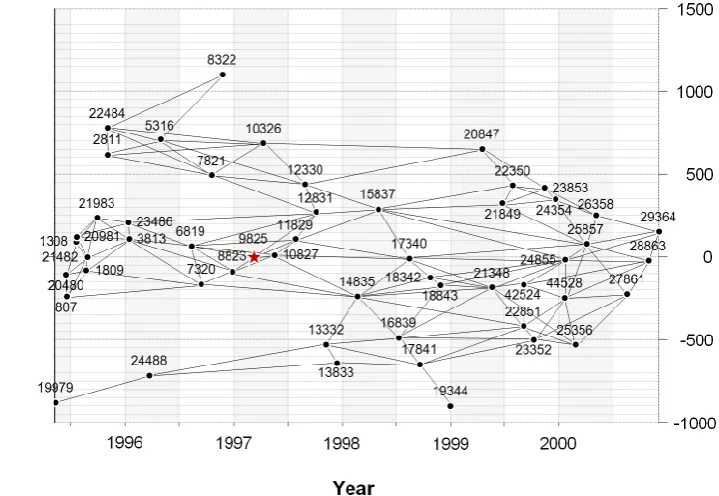
Fig. 5. Temporal vs. spatial baseline distributions for the interferometric stack used in this study (black circles). The reference scene used in the PS processing is indicated by the star. The small baseline interferograms represented by the continuous black lines and used in the SB processing were computed with minimum coherence of 0.6, maximal spatial baseline of 350 m and maximal temporal baseline of 700 days. Figure generated by viStaMPS (Sousa et al., 2013).
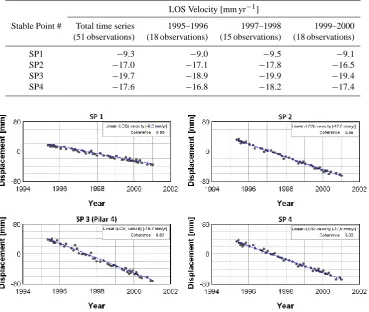
SB processing, only interferograms with maximal temporal baseline of 700 days and maximal spatial baseline of 350 m were computed. Hundreds of stable points (SP) were identi-fied in the region and their motion history was determined. We access the point quality evaluating the coherence (mea-sure of the phase noise level) which is an indicator of whether the point is a SP pixel as in Hooper et al. (2007). This mea-sure is similar to a meamea-sure of coherence (Bamler and Just, 1993), although in time rather than in space, as is gener-ally implied by the term in reference to SAR interferograms. In other words, coherence can be interpreted as the average closeness of the SP phase to a given model. In StaMPS, the model is the phase interpolated from surrounding pixels. All the SP displayed in Fig. 6b have coherence (a measure of the goodness of fit of the model to the observations, ranging from 0 to 1) above 0.80. For each SP, the (mean) LOS velocity and the displacement temporal series were computed relative to a circular reference area that is centered in the village of Castelo de Paiva, radius 2 km (∼4 km away from the bridge). These linear deformation rates and the quality of the informa-tion were accessed from the wrapped phases using a bi-linear regression on the phases relative to the temporal and perpen-dicular baselines. Based on the standard deviation from the regression we estimated the quality of the measures. The dis-persion of the four points on the bridge were also calculated. In each image, a function that fits the deforming points was defined and subtracted from the phase. The remaining signal
can be considered as the error. At the end, taking the disper-sion per image, we calculated the disperdisper-sion (variance) over all images which allows for accessing the points quality in-dependently of any model.
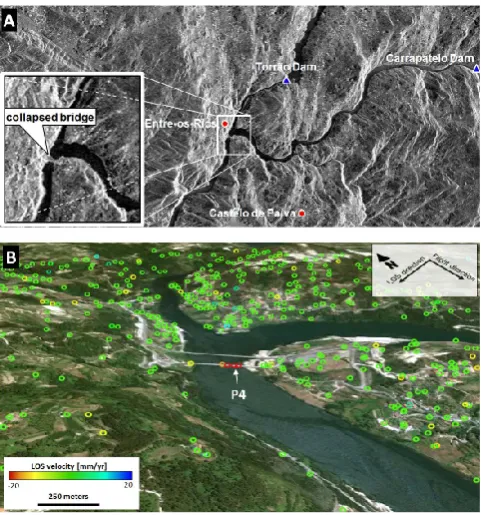
Figure 6a shows the mean SAR amplitude image of the analyzed area, computed by averaging all the available SAR images, and Fig. 6b shows the geocoded deformation veloc-ity map, which is superimposed over a Google Earth im-age. Note that, the two images have different geometries: Fig. 6a is in the original radar image space, while Fig. 6b is a geocoded image. It is evident, from this image, that Hintze Ribeiro bridge suffered significant deformations dur-ing the years that preceded the collapse, with deformation rates reaching almost 20 mm yr−1in the line-of-sight (LOS) direction.
In Fig. 6b we can see two bridges while in Fig. 6a only one bridge appears. This is due to the fact that after the accident a new bridge, which had been promised for a longtime, was finally constructed, while at the same time the Hintze Ribeiro bridge was rebuilt. Figure 7 shows the present situation with the two side-by-side bridges.
5 Discussion
Fig. 6. (A) Mean SAR amplitude image of the study area with the region of the bridge extended and the location of the dams whose water volumes discharged were used to infer the flow in the area of the bridge; (B) geocoded color coded average linear deformation rate superimposed over a Google Earth image with the collapsed pil-lar highlighted (P4). Observation geometry is indicated in the upper right corner. Figure generated by viStaMPS (Sousa et al., 2013).
is 0.6 mm yr−1which shows a good agreement of the defor-mation with the linear model (see Table 1). Doing the anal-ysis without resorting to any deformation model, the stan-dard deviation is 0.9 mm. Figure 6b illustrates the velocity map of the region derived from the time series of 52 ERS-1/2 scenes spanning 5.5 yr. The general patterns of the de-formation indicate a high stability of the surrounding area of the bridge. Significant deformations are only detected in the bridge structure, precisely in the collapsed section repre-sented by four stable points. Figure 8 shows the deformation history of those four stable points. Note that, due to the mod-erate resolution of the SAR scenes used in this work, it is not possible to identify exactly the bridge component (pillar or deck) that suffered from the most significant deformation. The new generation of SAR sensors (X-band), which have been operational since 2008, yielded a much denser mea-surement point distribution, being more adequate for local deformation phenomena analysis than the C-band. Monells et al. (2010) compared X-band and extensometer measure-ments and concluded that X-band has the capability to detect small variations in structures.
The explanation of the event is a complex issue requir-ing joint analysis of different datasets. It has been reported (Correia et al., 2001) that, according to the bathymetric
sur-Fig. 7. Actual situation of the study area with two “new” and mod-ern bridges.
vey conducted in February 2000 by the Douro Navigability Institute (IND), the riverbed in the vicinity of the pillar P4 had about 6 m above the foundation base. As explained be-low, this situation posed a significant risk to the stability of the pillar (and to the bridge itself). When, like it is the case of the collapsed pillar, the foundation rest on the incoherent alluvial material, riverbed lowering can bring two types of threats: (1) if the reduction is so intense that reaches the base level, an erosion process of the material under the foundation can be initiated resulting in uncontrollable settlements and rotations leading to the collapse; (2) the progressive reduc-tion of the layer above the base may reduce the load resis-tance of the ground foundation, through the reduction of the overall level of effective stresses, to a degree where that stress equals the applied load causing the breakage of the foun-dation. The situation found in the 1986 underwater inspec-tion already revealed meager security condiinspec-tions; in other words, the vulnerability of the pillar P4 foundations was al-ready considered too high. The information collected after the bridge collapse confirms the precarious state of the pillar. In fact, it was estimated that the riverbed near the pillar stood, on 14 March 2001, about only 1 m above the foundation base. Between February 2000 and March 2001 the riverbed suf-fered a large drawdown (which was probably even higher at the peak of the period of high flows) (Correia et al., 2001).
664 J. J. Sousa and L. Basto: MTI reveals Bridge sinking before collapse
Table 1. Linear deformation rates (LOS) for the four stable points detected on the bridge structure. Three periods of time (1995–1996, 1997–1998, 1999–2000) were defined and compared with the overall period considered in this study. The three partial periods compare well with the overall linear fitting.
LOS Velocity [mm yr−1]
Stable Point # Total time series 1995–1996 1997–1998 1999–2000 (51 observations) (18 observations) (15 observations) (18 observations)
SP1 −9.3 −9.0 −9.5 −9.1
SP2 −17.0 −17.1 −17.8 −16.5
SP3 −19.7 −18.9 −19.9 −19.4
SP4 −17.6 −16.8 −18.2 −17.4
Fig. 8. Displacement time series from the four stable points (SP) resolved by ERS descending observation in the bridge structure (see Fig. 6b for location). The numbering was attributed from left to right. The deformation history is in the LOS direction. Fitted linear regression is also represented. Figure generated by viStaMPS (Sousa et al., 2013).
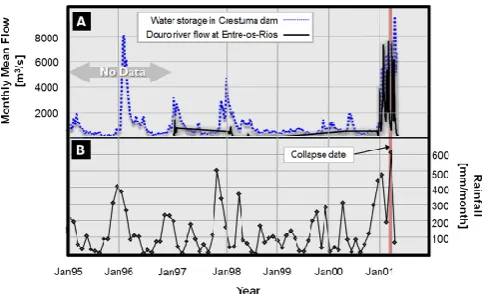
Based on the information provided by the Water National Institute (INAG) related to the flows discharged from Car-rapatelo and Torr˜ao dams (see location in Fig. 6a), between 1 November 2000 and 7 March 2001, it was possible to an-alyze the evolution of the flow at the bridge section in the days immediately prior to the accident. Starting on 2 March 2001, the Carrapatelo, Torr˜ao and Crestuma dams recorded intense flows resulting in an equivalent increase in the dams discharges. Indeed, on 1 March 2001, flows effluents to the Carrapatelo and Torr˜ao dams were only 1100 m3s−1 and 112 m3s−1, respectively. These values were quickly over-taken having been recorded, at the end of 3 March 2001 (11:00 p.m.), flows of 3960 m3s−1 and 760 m3s−1, at the Carrapatelo and Torr˜ao dams, respectively. According to the available information, virtually all the flow that reached the dams were discharged downstream, yielding, at Crestuma dam, a flow of 5050 m3s−1at the same day and time (Correia et al., 2001). On 4 March 2001, the flow rise remained at the Carrapatelo dam and there was a very rapid rise of flow, and associated discharges, at the Torr˜ao dam. Indeed, in a
short period of 8 hr (between 6:00 a.m. and 2:00 p.m.), the flow, at this dam, more than doubled from 820 m3s−1 to 1991 m3s−1(maximum value in days). At the collapse time (around 9:10 p.m.), the flow at the Carrapatelo and Torr˜ao dams were 6222 m3s−1and 1452 m3s−1, respectively. At the time of the accident it is estimated that the river flow rate at the bridge section was 8000 m3s−1.
1978/79
2 26–27 March 1979
1984/85 3 11–13 February 1985
3 16–18 February 1985
1989/90
3 17–19 December 1989 4 21–24 December 1989 1 26 December 1989
1995/96
2 31 December 1995–1 January 1996 8 5–12 January 1996
1 16 January 1996 6 21–26 January 1996 2 29–30 January 1996
1997/98 1 18 December 1997
2 22–23 December 1997
2 7–8 December 2000
2000/01 2 10–11 December 2000
(until 1 29 December 2000
4 March 14 2–15 January 2001
2001) 8 25 January–1 February 2001 6 7–12 February 2001 2 3–4 March 2001
respectively, since the dams initial operation date. These val-ues represent 35 % and 45 % of the total days with such high flow, respectively, for Carrapatelo and Torr˜ao dams which al-lows us to conclude on the severity of the high fal-lows perma-nence at the bridge section in the period before the accident. Figure 10 presents the river flow and the monthly rainfall over the same time span of the SAR images. The monthly mean flow shown in Fig. 10a was estimated based on the wa-ter discharges of the two nearest upstream dams (Torr˜ao and Carrapatelo dams).
According to the official report of the experts group that investigated the accident, loss of sediment support of the ground under the pillar foundation was identified as the di-rect cause of the collapse. The severe conditions of persistent high flows that occurred in the Douro River from the begin-ning of the 2001 hydrological year (the year of the accident), only accelerated the inevitable.
The above explanation would imply both vertical and hor-izontal differential motions on the pillar. The geometry of the present ERS MTI analysis is also sensitive to the east– west horizontal motion of the bridge. Therefore, the pre-sented deformation rates comprise both components of the movement. Having only the projection of three-dimensional
1993/94 1 6 January 1994
4 9–12 January 1994
4 25–28 December 1995
1995/96 4 30 December 1995–2 January 1996 10 6 January–15 January 1996
1997/98 1 20 December 1997
2 22–23 December 1997
1999/00 1 24 October 1999
1 19 April 2000
5 7–11 December 2000
2000/01 3 28–30 December 2000
(until 7 1–7 January 2001
4 March 6 24–29 January 2001
2001 5 6–10 February 2001
2 3–4 March 2001
1
Figure 9. Number of days with daily average flow discharged by the Carrapatelo and Torrão 2
dams greater or equal to 3000 m3/s and 500 m3/s, respectively. All hydrological years since 3
the entry into operation of the dam were considered. 4
Fig. 9. Number of days with daily average flow discharged by the Carrapatelo and Torr˜ao dams greater or equal to 3000 m3s−1and 500 m3s−1, respectively. All hydrological years since the entry into operation of the dam were considered.
displacement in the radar LOS, it is not possible to retrieve the actual displacement vector. To properly decompose the displacement into horizontal and vertical components, the InSAR measurements taken from two directions (ascending and descending) should be combined. Unfortunately, within the period under study only data acquired from a single direc-tion (descending satellite pass) were available therefore all results give LOS velocities. However, more important than the factors leading to the disaster or the decomposition of the deformation vector, is the issue of prevention. The pri-mary goal of our ERS MTI analysis is to study if the event could have been prognosticated. The MTI results prove that
666 J. J. Sousa and L. Basto: MTI reveals Bridge sinking before collapse
Fig. 10. (A) Monthly mean flow at Hintze Ribeiro bridge estimated based on the nearest dams water discharge and water storage in the Crestuma dam (nearest downstream dam). No data (river flow and discharges for the dams) were available for the period 1995–1997, for that reason, data related to the water storage in the Crestuma dam (nearest downstream dam) were used to infer the flow during this time interval. (B) Monthly rainfall at Entre-os-Rios weather station; (Rainfall and Flow Data source: national hydric resources informa-tion system – http://snirh.pt) from January 1995 to March 2001.
the instability of the bridge was definitely present and ongo-ing, for at least the period under analysis, and it could have been detected several years before. According to this dataset, the bridge had been steadily deforming at rates above what could be expected for the type of bridge under consideration and, additionally, the observed deformation trend was occur-ring systematically in the same direction. This highlights the need of monitoring and also explicit monitoring regulation for all hazardous structures.
6 Conclusions
This research demonstrates the potential of SAR continuous series scenes to detect and monitor deformations in crucial structures such as bridges. Multi-temporal InSAR, a tech-nique combining both PSI and SB methods, that uses radar satellite images to monitor ground deformation from space, has been applied to a stack of 52 ERS SAR images cover-ing the Entre-os-Rios area (Northern Portugal), where the Hintze Ribeiro bridge collapsed in March 2001. Hundreds of stable points have been detected in the area of interest. Displacement rates have been monitored during the period from May 1995 to December 2000, with the maximum veloc-ity rate detected of about 20 mm yr−1, precisely in the struc-ture of the collapsed bridge. Data indicate significant, steady continuous movement of the bridge section supported by pil-lar 4 in the last 5.5 yr prior to the collapse (InSAR observes LOS direction, thus the observed motion is a combination of subsidence and outward/westward motion of the bridge). The observed rate of motion of the bridge appears very high
reaching at almost 20 mm yr−1LOS velocity, i.e. more than 10 cm if only subsidence and∼21 cm if only westward hor-izontal displacement (converted applying simple geometry to the incidence angle) as derived from the 5.5 yr of ERS observations. As demonstrated here, with the MTI satellite technique, it is possible to go back in time and investigate not only the actual but also the historical motions of differ-ent structures. The spatial and temporal resolution achievable with this technique makes it a unique and powerful tool.
These results offer an example of the deformation moni-toring capability achievable with MTI techniques even using the ERS coarse resolution. With the new generation of high spatial resolution radar satellites, as TerraSAR-X or COSMO Sky-Med, we can foresee a significant improvement of the potential of InSAR data for monitoring bridges, dams and other urban structures and, therefore, complement conven-tional structural monitoring techniques due to, among others, its capability to measure small and slow deformation phe-nomena and the high density of stable points that can be de-tected.
This also shows that continuous processing of InSAR ob-servation could be successfully integrated in regular struc-tural monitoring programs as a component of the implemen-tation of early warning systems.
Acknowledgements. The authors would like to thank Andy Hooper for valuable comments and advice that help improve this work and the reviewers for their helpful suggestions.
This research was supported by the European Space Agency (ESA) in the scope of 8111 CAT-1 project and Fundac¸˜ao para a Ciˆencia e a Tecnologia (Portugal). The SRTM data were provided by USGS/NASA.
Edited by: N. Kerle
Reviewed by: O. Monserrat, Z. Perski, and one anonymous referee
References
Bamler, R. and Hartl, P.: Synthetic aperture radar interferometry, Inverse Probl., 14, R1–R54, doi:10.1088/0266-5611/14/4/001, 1998.
Bamler, R. and Just, D.: Phase statistics and decorrelation in SAR interferograms, Proc. Int. Geosci. Remote Sens. Symp., 3, 980– 984, 1993.
Correia, R., Andrade, A., and Soares, F.: Relat´orio final sobre as causas do sinistro ocorrido na ponte de Entre-os-Rios em 4 de marc¸o de 2001, Official Report, 2001 (in Portuguese).
Ghuman, P. and McCardle, A.: Bridge Health Monitoring using PSI, Eur. Space Agency Spec. Publ., SP-697, ISBN 978-92-9092-261-2, 2012.
Hanssen, R. F.: Radar Interferometry: Data Interpretation and Er-ror Analysis, Kluwer Academic Publishers, Dordrecht, 328 pp., ISBN 0-7923-6945-9, 2001.
Dekker, P., Tom´as, R., Herrera, G., L´opez-S´anchez, J. M., Vi-cente, F., Navarro-Sanchez, V. D., and Mulas, J.: Applica-tion of Terrasar-X Data to the Monitoring of Urban Subsi-dence in the City of Murcia, Geoscience and Remote Sens-ing Symposium (IGARSS), IEEE International, 3506–3509, doi:10.1109/IGARSS.2010.5652623, 25–30 July 2010. Rosen, P. A., Hensley, S., Joughin, I. R., Li, F. K., Madsen, S. N.,
Rodr´ıgues, E., and Goldstein, R. M.: Synthetic aperture radar in-terferometry, Proc. IEEE, 88, 333–385, 2000.
A.: Persistent scatterer InSAR: a comparison of methodologies based on a model of temporal deformation vs. spatial correlation selection criteria, Remote Sens. Environ., 115, 2652–2663, 2011. Sousa, J. J., Magalh˜aes, L. G., Ruiz, A. M., Sousa, A. M. R ,and Cardoso, G.: The viStaMPS tool for visualization and manipulation of time series interferometric results, se-ries interferometric results, Comput. Geosci., 52, 409–421, doi:10.1016/j.cageo.2012.11.012, 2013.