Alternative Pathways To Engineering
Success
–
Using Academic And Social
Integration To Understand Two
-
Year
Engineering Student Success
Rose M. Marra, Ph.D., University of Missouri, USA Chia-Lin Tsai, Ph.D., University of Missouri, USA
Barbara Bogue, M.S., Penn State University, USA Jean Landa Pytel, Ph.D., Penn State University, USA
ABSTRACT
The need for educating engineers in the United States continues as the projected demand is rising the number of high school seniors planning to enter engineering careers has remained relatively stable (Sargent, 2014). Additionally, figures show that attrition rates in undergraduate engineering continue to be an area of concern, (Sargent, 2014; Gibbons, 2005; NSF, 2004). Given the projected increased demand for engineers, the engineering education community must explore a variety of pathways for engineering students to be successful.
Organizations such as National Science Foundation (Laanan, Jackson, Darrow, 2010) have noted that beginning engineering study at a two-year campus and then transferring to an engineering bachelor’s degree-granting institution is an important path and source for additional engineering students. Although some have explored the logistical issues and curricular design components of two-year campuses that enables engineering students to complete their bachelor degrees elsewhere, there is very little that explores the non-curricular factors on these campuses that help such students successfully progress (Laanan, et al., 2010). Using Tinto’s theory of integration (1975, 1993), this study examines the relationship between student entry characteristics and measures of social and academic integration to engineering learning outcomes. Understanding how integration factors on two-year campuses impact engineering student success can be used to inform the design of curricular and campus-based experiences. Results indicate social and academic integration factors significantly predict engineering students’ learning outcomes, especially their commitment to engineering studies.
Keywords: Recruitment; Two-Year College; Academic Integration; Social Integration
INTRODUCTION
n 2008, the U.S. Bureau of Labor estimated that for the next decade the number of engineering jobs will grow about 11% (Bureau of Labor Statistics, 2010). However, a recent study found that the number of high school seniors planning to enter engineering careers has not increased to meet this projected demand, but rather remained relatively stable (College Board, 2009). Additionally, data (Board, 2006; Gibbons, 2005; NSF, 2004) show that attrition rates in undergraduate engineering continue to be an area of concern. Given the projected increased demand for engineers, the engineering education community must explore a variety of pathways for engineering students to be successful.
such as the National Science Foundation (Laanan, Jackson, Darrow, 2010). Although a number of practitioners have explored the logistical issues and curricular design components of a curriculum at two-year campuses that enables engineering students to complete their bachelor degrees elsewhere (e.g. Kizart, 2014; Prospero, Vohra-Gupta, 2007), there is very little that explores the non-curricular factors on these campuses that help such students successfully progress in their engineering studies (Laanan, et al., 2010). Using Tinto’s theory of integration (1975, 1993) as a framework, this study examines the relationship between student entry characteristics and measures of social and academic integration to engineering learning outcomes. Understanding how integration factors on two-year campuses impact engineering student success can be used to inform the design of curricular and campus-based experiences that support the success of engineering students on two-year campuses.
Background Literature and Study Rationale
To provide a foundation for this work, our literature and rationale address: the role and challenges of two-year campuses in educating engineering students, how the concept of integration captures some of the fundamental and unique characteristics of attending college at two-year campus, and Tinto’s theory of integration as applied in two-year and commuter college environments and how that theory may be applied to students studying engineering at two-year campuses.
Two Year Colleges and Engineering Students
Two-year institutions are an important starting location for engineering students and serve as an alternative entry point for individuals who want to study engineering. Forty-two percent of the 19 million undergraduates enrolled in Title IV institutions in Fall 2010 were enrolled in 2-year institutions (Knapp, Keyyl-Reid, & Ginder, 2012). Moreover, from 2001 to 2007, about 38 percent of engineering graduates (i.e., bachelor’s and masters’ degree recipients) had attended a community college at some point in their studies. (Mooney & Foley, 2011).
In 2003, 894 community colleges offered an engineering degree (AACC, 2010). Because of the open access to these 2-year institutions, students choosing this education path to an engineering degree are very diverse in term of their entry characteristics, demographics, and educational goals. For example, a study on community college students found that high school seniors who enrolled immediately in community colleges seemed to have a wide range of academic achievement (i.e., test scores, and course taking), including students who were well-prepared for college (NCES, 2008). The same study also showed that of students who originally had intended to pursue an associate’s degree, almost 47% of them raised their educational goal to pursue a bachelor’s degree.
The two-year institutions studied fall into the revised Carnegie classification system’s definition of an “Associates – Dominant” type institution (Carnegie Foundation, 2010) that includes community colleges. Although these institutions may grant some four-year degrees, the predominant degrees granted are at the associate’s level. Two-year institutions are an important venue for individuals seeking postsecondary education and, in spite of their variability, provide similar functionality for students studying engineering: smaller class sizes (Schuyler, 1999), greater teacher-student interaction and teaching focus.
Community colleges are also known for their curricular responsiveness to students’ changing career and educational aspirations. This epitomizes a strength of community colleges and their defining goal to prepare students for transferring to four-year institutions, prepare them for employment, and address skills not mastered in high schools (Schuyler, 1999). Mattis and Sislin (2005) describe several reasons why community colleges in particular are valuable sources of engineers. First, community colleges enroll large numbers of students, and further their enrollments include high percentages of women and students from underrepresented minority groups.
cannot explain – rural 2-year institutions are more successful in increasing the number of STEM-related associates degrees awarded to women over the past two decades than other types of 2-year institutions. We consider this important point given the low numbers of women and underrepresented minorities in engineering. Lastly, Mattis and Sislin (2005) point out that while many community college students in engineering do not transfer to a four-year institution to finish their degrees, they go on to complete an associate’s degree of science or engineering science and that those who do are just as likely to complete a bachelor’s degree in engineering as students who attend only a four-year institution. Thus, there is a pool of qualified students attending two-year institutions that can finish an engineering degree.
Two-Year Colleges and Integration
Although two-year institutions are an important resource for educating engineering students, their unique characteristics present both opportunities and challenges to these students. On the plus side, two-year institutions typically have smaller campuses and a lower student-to-faculty ratio (Schuyler, 1999), providing these students with greater potential access to faculty and more opportunities to form closer student-student and faculty-student relationships. Further, recent data from the National Center for Education Statistics (NCES) indicate that about 90% of community colleges faculty reported their main responsibility as teaching (Provasnik & Planty, 2008); no faculty reported having research as a main focus. These factors may counteract the lack of opportunities for students to get involved in academic and social activities, as compared to those available on larger, 4-year campuses.
The integration components of Tinto’s interactionist theory (1975, 1993) provides a framework for understanding and analyzing key aspects of two-year institutions. Tinto’s overall theory, most often applied to explaining student retention, describes students’ transitions into higher education and ability to succeed there. Tinto postulates that students must initially separate from former groups with which they were associated (e.g. family, high school peers) and then interact with and seek membership with new groups associated with college life. He identifies social and academic “integration” as processes through which students can adjust to college life. Social integration is often indicated by the degree and nature of student-to-student interactions and student-faculty interactions (Braxton, Hirschy & McClendon, 2004; Kuh, et al., 2006), as well as a students’ ability to successfully interact with others. Academic integration refers to students’ abilities to succeed academically based on institutional norms or standards – such as achieving passing grades. Tinto postulates that the more successful a student is at achieving academic and social integration, the greater that student’s commitment to the institution and to the goal of graduation (Bean 1983).
Although Tinto’s model is quite popular, the empirical evidence for it is limited (Braxton, Hirschy & McClendon, 2004; Kuh, et al., 2006). Overall there is more support for social integration as a success predictor than that of academic integration (Braxton, Sullivan and Johnson, 1997; Braxton, Hirschy & McClendon, 2004). However, because of the academic rigor of engineering degree programs (Marra, Rodgers, Shen & Bogue, 2012) as well as the inclusion of learning focused activities in Braxton et al.’s (2004) revised version of Tinto’s model for “commuter institutions”, we chose to examine both academic and social integration in this study.
Braxton et. al (2004) describe commuter institutions as having characteristics that align with the institutions we are studying; namely students commute to campus and thus their on-campus activities are normally limited to attending classes . They note that the commuter-based nature of students’ academic schedules often precludes meaningful interactions with other students and faculty, leading to isolation. Thus the presence of social integration and its potential impact (or the lack of it) should be examined in these settings.
Applying Tinto to Engineering Learning Outcomes at Two-Year Institutions
For this study we chose to examine these interim measures of student success. Similar to Kuh et al.’s (2006) statement that one indicator of student success is one’s abilities on important learning outcomes (e.g. critical thinking, science literacy), for these pre-engineering students their preparation at the two-year institutions in the engineering skills and knowledge is of critical importance. These are the outcomes we examine in this study in relation to academic and social integration. Lastly, examining retention for this student population would not be meaningful given that the common first two-year curriculum between the two-year institutions and the four-year engineer degree-granting institution results in a very high retention rate for students who begin at the two-year institutions in the system.
Summary and Research Questions
Based on the prior literature, the nature of the institutions we are studying, and our engineering student population we investigate the following questions in this study:
1. Which student entry characteristics (e.g. high school GPA) significantly predict their engineering learning outcomes?
2. Controlling for students' entry characteristics, which academic integration variables significantly predict engineering learning outcomes?
3. Controlling for student entry characteristics, which social integration variables significantly predict engineering learning outcomes?
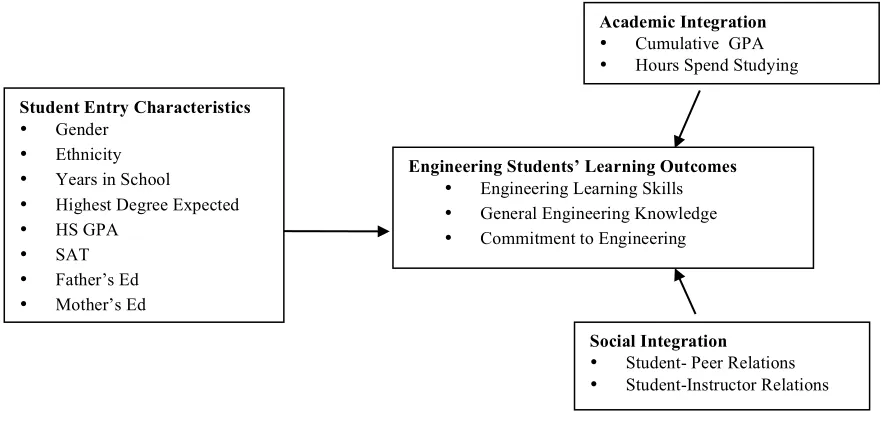
Based on Tinto (1975) the empirical assessment of Tinto’s model in two-year colleges (Braxton, Sullivan, & Johnson, 1997), we used the model depicted in Figure 1 to study factors affecting two-year campus engineering students’ achievement of engineering learning outcomes. Figure 1 also shows an overview of how we defined measures for each of the constructs from Tinto’s model. We first looked at how student entry characteristics directly affect engineering students’ learning outcomes. Then, controlling for any significant student entry characteristics, we examined how academic integration and social integration directly affect these learning outcomes.
Figure 1. Applying Tinto’s Interactionist Model to Engineering Students’ Learning
Engineering Students’ Learning Outcomes
• Engineering Learning Skills • General Engineering Knowledge
• Commitment to Engineering
Student Entry Characteristics
• Gender
• Ethnicity
• Years in School
• Highest Degree Expected • HS GPA
• SAT
• Father’s Ed
• Mother’s Ed
Academic Integration
• Cumulative GPA • Hours Spend Studying
Social Integration
• Student- Peer Relations
METHOD
Participants and the Campus System
The participants were 436 undergraduates (189 freshmen; 247 sophomores) enrolled in first and second year engineering courses at 19 two-year college campuses within a large university system in the Eastern United States. These student participants had responded to an email request to complete an online survey concerning their engineering studies. Data were collected during three semesters: Spring 2007, Fall 2007 and Spring 2008. As is typical for engineering student enrollments, the majority of participants (87%) were male (n = 379) with only 13% (n = 57) being female. Eighty-seven percent of the participants were White American, 6% Asian American, 2% African American, 1% Latino American, 1% Native American, and 3% other. The sample represents 15% of the students taking first and second year engineering courses at these campuses. Studies show that this is a typical rate garnered from online surveys that are not supported by specific faculty or external incentives (Cook, Heath, Thompson, 2000).
These two-year campuses do not offer a four-year engineering degree, however the single four-year institution in this same system does offer the full range of engineering bachelor’s degree. Nearly all students entering these two-year campuses to study engineering intend to transfer to the four-year institution to complete their engineering degrees. This setting provides a good venue for examining engineering students who begin at two-year campuses as all the campuses offer the same first two two-years of course work required of engineering bachelor’s degree majors at the system’s four-year institution. The common coursework includes first-year engineering design, math and science pre-requisite courses and sophomore level basic engineering courses. Thus students from any campus in the system can make progress towards an engineering degree at the four-year institution with no institutional barriers such as applications or space limitations and all courses credits from their initial campus automatically apply to the destination campus. This effectively creates a “built-in” articulation agreement between the campuses designed to create an easier student- transfer transition.
Data Sources
Data were gathered from a student-completed survey designed to collect data on the three classes of variables: student entry characteristics, and academic and social integration. The survey addressed student background characteristics, perceptions of faulty and student interactions, work habits, self-reported progress made on engineering outcomes resulting from engineering curriculum coursework and commitment to completing an engineering degree. Analysis methods for all data are described below.
Variables
Student Entry Characteristics
In addition to gender, ethnicity, and years in school, students were asked to provide data on their personal background, such as the highest degree they expected to earn, and their parents’ educational level. We also used students’ official high school GPA and official SAT scores as indicators of their pre-college ability. Taken together, these variables describe students’ entry characteristics. The descriptive statistics for these variables are shown in Tables 1 and 2.
Table 1. Participants’ High School GPA and SAT Scores
Variables N Minimum Maximum Mean Std. Deviation
HS GPA 359 0 4.33 3.19 0.94
Table 2. Frequency Distribution of Participants’ Educational Expectations and Background
Highest Degree Expected Mother’s Education Level Father’s Education Level
Frequency Percent Frequency Percent Frequency Percent
High school -- -- 170 39.0 155 35.6
Associate -- -- 62 14.2 56 12.8
Bachelor's 161 36.9 112 25.7 114 26.1
Master's 195 44.7 43 9.9 48 11.0
Doctorate 55 12.6 5 1.1 11 2.5
Professional 21 4.8 392 89.9 384 88.1
Total 432 99.1 18 4.1 24 5.5
Don’t Know -- -- 26 6.0 28 6.4
System 4 0.9 44 10.1 52 11.9
Total 436 100.0 436 100.0 436 100.0
Academic Integration
Recall that academic integration is defined as students’ abilities to succeed academically based on institutional norms or standards – such as achieving passing grades. To assess students’ academic integration, students were asked to indicate “hours a week they spend studying and preparing for class” on a scale from 1 (less than one hour) to 6 (more than 20 hours). Additionally, as suggested in the literature (Townsend & Wilson, 2008), we also used students’ official cumulative GPA as an indicator of their academic integration. The descriptive statistics for the academic integration variables are summarized in Table 3.
Table 3. Descriptive Statistics of Participants’ Academic Integration Variables
Variables N Minimum Maximum Mean Std. Deviation
Hours Studying 436 1 6 3.51 1.33
Cumulative GPA 375 0 4 3.14 0.55
Note: Hours Study: 1 (less than one hour), 2 (1-5 hours), 3 (6-10 hours), 4 (11-15 hours), 5 (16-20 hours), and 6 (more than 20 hours).
Social Integration
To assess students’ social integration, students were asked to rate the quality of their relationships with other students and with instructors, indicating if other students were friendly, supportive, and helped them to have a sense of belonging on a scale from 1 (Unfriendly, unsupportive; I have sense of not belonging) to 7 (Friendly, supportive, I have a sense of belonging). In terms of instructors, students were asked to rate whether their instructors were available, helpful, and sympathetic on a scale from 1 (Unavailable, unhelpful, unsympathetic) to 7 (Available, helpful, sympathetic). The descriptive statistics for the social integration variables are summarized in Table 4.
Table 4. Descriptive Statistics of Participants’ Social Integration Variables
Variables N Minimum Maximum Mean Std. Deviation
Student-Peer Relations 425 1 7 5.72 1.23
Student-Instructor Relations 424 2 7 5.64 1.07
Engineering Students’ Learning Outcomes
knowledge was .32. Because these correlations are relatively low, we can conclude that these three engineering learning outcomes were three conceptually distinct factors.
Table 5. Summary of Exploratory Factor Analysis Results for the Engineering Students’ Learning Outcome Measure (N = 436)
Factor Loadings
Item Factor 1 Factor 2 Factor 3
1. Understand what engineers do in industry. -0.05 0.80 0.05
2. Understand the non-technical aspects of an engineering career (e.g. economic,
political, ethical, and/or social issues). -0.08 0.75 0.04
3. Knowledge and understanding the language of design in engineering -0.08 0.86 0.05 4. Knowledge and understanding the process of design in engineering. -0.03 0.88 0.00 5. Design a process, component of a system or a product. 0.29 0.57 -0.08 6. Solve an open-ended problem (that is, one for which no single right answer
exists).
0.70 0.03 -0.04
7. Apply an abstract concept or idea to a real problem or situation. 0.66 0.10 -0.01
8. Clearly describe a problem orally. 0.83 -0.13 -0.06
9. Clearly describe a problem in writing. 0.85 -0.19 0.03
10. Identify the tasks needed to solve an open-ended problem. 0.77 0.00 0.04 11. Visualize what the product of a design project might look like. 0.46 0.36 -0.07 12. Weigh the pros and cons of possible solutions to a problem. 0.68 0.15 -0.07 13. Figure out what changes are needed in prototypes so that the final engineering
project meets design specifications. 0.45 0.35 -0.04
14. Develop ways to resolve conflict and reach agreement in a group. 0.69 -0.03 0.05 15. Make sure that all group members have the opportunity to contribute to group
activities and outcomes.
0.68 0.01 0.09
16. Organize information relevant to a problem solving activity (e.g. writing reports, sharing research with other group members, etc.) so that it is easily understandable to others.
0.75 -0.04 0.09
17. Change in your confidence that majoring in engineering was the right choice
for you. 0.04 0.01 0.86
18. Change in your motivation to become an engineer. 0.05 -0.03 0.89
19. Change in the likelihood you will continue in an engineering program. -0.03 0.01 0.92
20. Change in your motivation to complete an engineering degree at Penn State. -0.02 0.08 0.82
Eigenvalues 8.03 2.60 1.54
% of Variance 40.14 13.00 7.70
Cronbach’s Alpha 0.91 0.81 0.91
Note: Factor loadings over .40 appear in bold. Factor 1 = Engineering Learning Skills, Factor 2 = Engineering General Knowledge, Factor 3 = Commitment to Engineering Results
Before conducting the research question analyses, we analyzed the responses to ensure that conducting a single analysis for all three semesters of data (Spring 2007, Fall 2007 and Spring 2008) was a valid approach and that there were no differences between students from these three semesters in the outcome variables. To test for differences we ran a MANOVA on students’ engineering learning outcomes. The multivariate effect of semester was not significant, Λ = .97, p > .05, thus providing support for our combining the three semesters of data for analysis.
Research Question 1: Which student entry characteristics (e.g. high school GPA) significantly predict their engineering learning outcomes?
Our first research question is designed to investigate the influence of students’ entry characteristics (e.g., high school GPA, SAT, parents’ education level, gender, ethnicity, year in school, and highest degree expect) on the engineering learning outcome variables. A significant association between student entry characteristics and a particular engineering learning outcome indicates that the entry characteristics variable(s) can be used as a control variable in the later analyses (Pritchard & Wilson, 2003).
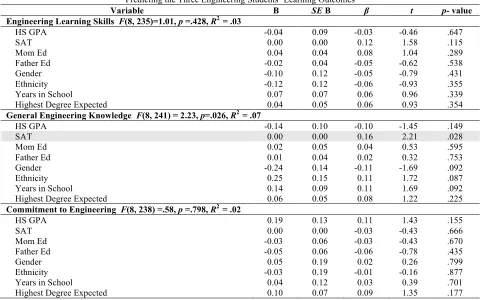
engineering. Our results indicated that the combined influence of all student entry characteristic variables explained a significant portion of variance on one outcome variable — general engineering knowledge, F(8, 241) = 2.23, p=.026, R2 = .07. As shown in Table 6, students’ SAT scores significantly predicted engineering general knowledge,
β = 0.16, t(241) = 2.21, p =.028. There was no overall model significance for the combined influence of all student entry variables on either engineering learning skills, F(8, 235)=1.01, p =.428, or commitment to engineering F(8, 238) =.58, p =.798. Because students’ SAT scores had a significant association with their general engineering knowledge, the regression analyses for the remaining research questions using general engineering knowledge included SAT scores as a control variable.
Table 6. Summary of Regression Analyses for Student Entry Characteristics Predicting the Three Engineering Students’ Learning Outcomes
Variable B SE B β t p- value
Engineering Learning Skills F(8, 235)=1.01, p =.428, R2 = .03
HS GPA -0.04 0.09 -0.03 -0.46 .647
SAT 0.00 0.00 0.12 1.58 .115
Mom Ed 0.04 0.04 0.08 1.04 .289
Father Ed -0.02 0.04 -0.05 -0.62 .538
Gender -0.10 0.12 -0.05 -0.79 .431
Ethnicity -0.12 0.12 -0.06 -0.93 .355
Years in School 0.07 0.07 0.06 0.96 .339
Highest Degree Expected 0.04 0.05 0.06 0.93 .354
General Engineering Knowledge F(8, 241) = 2.23, p=.026, R2 = .07
HS GPA -0.14 0.10 -0.10 -1.45 .149
SAT 0.00 0.00 0.16 2.21 .028
Mom Ed 0.02 0.05 0.04 0.53 .595
Father Ed 0.01 0.04 0.02 0.32 .753
Gender -0.24 0.14 -0.11 -1.69 .092
Ethnicity 0.25 0.15 0.11 1.72 .087
Years in School 0.14 0.09 0.11 1.69 .092
Highest Degree Expected 0.06 0.05 0.08 1.22 .225
Commitment to Engineering F(8, 238) =.58, p =.798, R2 = .02
HS GPA 0.19 0.13 0.11 1.43 .155
SAT 0.00 0.00 -0.03 -0.43 .666
Mom Ed -0.03 0.06 -0.03 -0.43 .670
Father Ed -0.05 0.06 -0.06 -0.78 .435
Gender 0.05 0.19 0.02 0.26 .799
Ethnicity -0.03 0.19 -0.01 -0.16 .877
Years in School 0.04 0.12 0.03 0.39 .701
Highest Degree Expected 0.10 0.07 0.09 1.35 .177
Note: * p <.05. Gender coded male =1 and female =0. Ethnicity coded Caucasian =1 and non-Caucasian=0. B: unstandardized coefficients; SE B: Standard Errors; β: Standardized coefficients
Research Questions 2 and 3: Controlling for students' entry characteristics, which academic integration variables, and social integration variables significantly predict engineering learning outcomes?
To answer research questions two and three, we ran multiple regressions to assess the effects of academic integration and social integration variables on the three engineering students’ learning outcomes: engineering learning skills, general engineering knowledge and commitment to engineering. The results for each engineering learning outcome are summarized below.
Engineering Learning Skills
Table 7. Regression Analyses for Social Integration Variables Predicting Engineering Learning Skills
Variable B SE B β t p- value
Student- Peer Relations 0.00 0.02 -0.00 -0.02 .987
Student- Instructor Relations 0.09 0.03 0.16** 3.05 .002
Note: ** p<.01, B: unstandardized coefficients; SE B: Standard Errors; β: Standardized coefficients
General Engineering Knowledge
In research question one, we found students’ SAT scores to be a significant predictor of general engineering knowledge. Thus we included SAT scores in the regression when analyzing the effects of academic and social integration on general engineering knowledge. The overall model with SAT and the academic integration variables approached significance in its relationship with general engineering knowledge, F(3, 330) = 2.59, p = .053. However, of the SAT and academic integration variables only SAT scores (β = .15, p = .007) significantly predicted the outcome variable general engineering knowledge.
We did find, however, that the combined influence of SAT and social integration variables were significantly related to general engineering knowledge, F(3, 319) = 6.93, p < .001, R2 = .06. Specifically, SAT (β =.14, p = .013) showed significantly predicted general engineering knowledge; also both student-peer (β = .12, p = .058) and student-instructor (β = 12, p = .058) were significant at the p < .10 level as predictors of general engineering knowledge (See Table 8).
Table 8. Regression Analyses for Social Integration Variables Predicting General Engineering Knowledge
Variable B SE B β t p- value
SAT 0.00 0.00 0.15* 0.14 .013
Student- Peer Relations 0.06 0.03 0.12+ 0.12 .058
Student- Instructor Relations 0.07 0.04 0.12+ 0.12 .058
Note:* p<.05, ** p<.01, + p=.058 for Student-Peer Relations and for Student-Instructor Relations B: unstandardized coefficients; SE B: Standard Errors; β: Standardized coefficients
Commitment to Engineering
Our results showed that the combined influence of academic integration variables (F(2, 367) = 7.81, p < .001, R2 = .04) and GPA had a significant effect on commitment to engineering. As shown in Table 9, GPA (β =.17, p =.002) significantly predicted students commitment to engineering. Next, we tested the effect of the social integration variables on this learning outcome and found that the combined influence of social integration also had a significant effect on commitment to engineering, F(2, 418) = 17.09, p <.001, R 2= .08. Specifically, both student-peer (β=.12, p = .019) and student-instructor relations (β = .20, p < .001) significantly predicted students’ commitment to engineering (See Table 10).
Table 9. Regression Analyses for Academic Integration Variables Predicting Commitment to Engineering
Variable B SE B β t p- value
Cumulative GPA 0.27 0.09 0.17** 3.13 .002
Hours Spend Studying 0.05 0.04 0.07 1.31 .192
Note:** p<.01, B: unstandardized coefficients; SE B: Standard Errors; β: Standardized coefficients
Table 10. Regression Analyses for Social Integration Variables Predicting Commitment to Engineering
Variable B SE B β t p- value
Student- Peer Relations 0.09 0.04 0.12* 2.36 .019
Student- Instructor Relations 0.17 0.04 0.20*** 3.92 .000
DISCUSSION
Two-year institutions provide an important entry point for a population of students who are working towards an engineering bachelor’s degree. Our study is aimed at understanding the impact of academic and social integration factors on student success as measured by key engineering learning outcomes. We begin by summarizing the significant results we found and then discuss them in terms of Tinto’s framework as well as undergraduate engineering education.
Results Related to Prior Literature
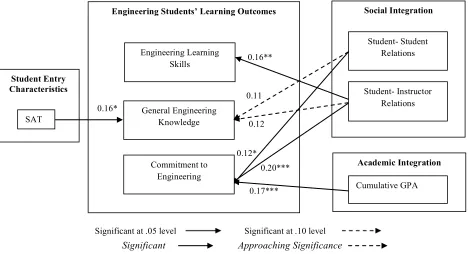
Figure 2 below shows the relationships we found between student entry characteristics, academic and social integration and engineering learning outcomes variables. Solid lines indicate a statistically significant relationship; dashed lines indicate a relationship approaching significance. Among students’ entry characteristics, only students’ SAT scores were a significant predictor of one engineering outcome variable: general engineering knowledge (RQ1). As Figure 2 shows, we included SAT scores in the academic and social integration regression models for the general engineering knowledge.
Figure 2. Empirically Examining Tinto’s Model for Engineering Students’ Learning at Two-Year Institutions
Significant Approaching Significance
Our findings for the two types of integration were as follows. For academic integration only cumulative GPA was a significant predictor of the commitment to engineering outcome variable. For social integration, we found more significant relationships. Student to student relationships were a significant predictor of commitment to engineering (solid line in Figure 2) and significant at the .10 level of general engineering knowledge (dashed line in Figure 2). Similarly, student-to-instructor relationships were a significant predictor of engineering learning skills and commitment to engineering; they were also a significant predictor at the .10 level of general engineering knowledge.
Our finding that the academic integration variable, GPA, significantly predicts commitment to engineering is consistent with prior work from Pascarella, Smart and Ethington’s (1986) study of baccalaureate degree attainment by students who began their degrees at community colleges. They concluded that academic integration as measured by average undergraduate grades was an important component in “long-term postsecondary educational
Significant at .05 level Significant at .10 level
Social Integration
Academic Integration Engineering Students’ Learning Outcomes
0.16**
0.16*
Student Entry Characteristics
0.20*** 0.11
0.12
0.12* Engineering Learning
Skills
SAT General Engineering Knowledge
Cumulative GPA Student- Student
Relations
Student- Instructor Relations
0.17*** Commitment to
persistence” (p. 66) (Townsend & Wilson, 2008). Conversely, a lack of academic success has also been found to be a significant factor in influencing students’ decisions to leave engineering (Marra, Rodgers, Shen, and Bogue, 2012). Our results concerning the relative importance of social integration are also supported by prior studies. We found more predictive relationships from the social integration variables than for academic integration variables; three significant relationships for social integration variables as compared to only one for academic integration variables. Similarly, in their extensive treatment of Tinto’s interactionist theory, Braxton et al. (2004) summarize the empirical evidence for the academic and social integration components of the theory stating the predominance of evidence for the theory lies in the area of social integration. Specifically, Braxton, Sullivan and Johnson (1997) reviewed empirical studies to assess the strength of support for the propositions from Tinto’s original theory and found that across multiple studies the greater the level of social integration, the stronger the students’ commitment to the institution which in turn lead to greater persistence in college. They did not find this same consistency across studies for academic integration.
One can also consider the results of the current study as grouped by the three engineering learning outcomes variables. As Figure 2 shows:
• Engineering learning skills were predicted only by student to instructor relationships
• General engineering knowledge was significantly related to students’ entering SAT score and when it was
factored in, there were significant relationships at the p < .10 between instructor and student-to-student relationships and general engineering knowledge.
• Commitment to engineering had the most significant relationships. GPA (an academic integration
variable), and both social integration variables – student-to-student relationships and student-to-instructor relationships all significantly predicted commitment to engineering.
Using Tinto's interactionist model as a framework, we found more predictive relationships for two-year students’ commitment to completing an engineering degree as compared to other outcomes variables that measured specific engineering skills. Amongst the three, this outcome variable is the one most concerned with students’ beliefs. Survey items that comprised this factor addressed respondents’ motivation and confidence in completing their engineering degrees, and are in contrast to the other two engineering outcomes variables that dealt with the actual skills of doing engineering (e.g. doing engineering design or being competent with the communication skills involved in engineering).
Student beliefs have been found to be important in prior work in engineering education. Both work in self-efficacy theory and studies related to engineering student retention have shown the importance of student beliefs. Self-efficacy is rooted in social psychological theory and refers to individuals’ beliefs in their capabilities to plan and take the actions required to achieve a particular outcome (Bandura, 1986). Self-efficacy beliefs have been found to strongly and positively related to GPA (Vogt, Hocevar and Hagedorn, 2007) and persistence (Mau, 2003). In a multi-institutional, longitudinal study of women engineering students’ self-efficacy, researchers (Marra, Rodgers, Shen and Bogue, 2009) found significant decreases in feelings of inclusion or feelings of belonging in engineering which is an important contributor to self-efficacy and in turn to persistence in engineering.
Student beliefs have also been shown to relate to actual student behavior regarding completing an engineering degree. Marra, et al. (2012) found that the non-academic factor – a feeling of lack of belonging in engineering – contributed more to students’ decision to leave engineering than either of the two academic factors studied – curriculum difficulty and poor teaching and advising. These prior studies have shown the importance of student beliefs in terms of significant engineering outcomes. Our current study, in turn, provides educators with data that suggests addressing aspects of academic and social integration may positively impact one aspect of student beliefs -- their commitment to completing an engineering degree – which in turn can impact actual degree completion (Braxton, et al., 1997). These implications and others generated from this study are discussed next.
Implications
factors on engineering outcomes. The importance of both student-to-student and student-to-faculty interactions is clear. We find this result of particular note given the nature of the institutions we studied as we explain next.
Although there is necessarily some variability in the nineteen locations in the studied system, they do share attributes that are pertinent when considering social integration. Most students at these campuses are not residential; they commute to the campus. Their lives are very much defined by forces external to campus life (Webb, 1990). For instance, many students hold jobs off campus; these smaller campuses necessarily have fewer student employment opportunities and because many students attend a campus in a community in which they have lived for several years, they may stay with off-campus jobs they had prior to beginning their studies. Thus, time on campus is somewhat limited, and as Braxton, et al. (2004) said, “students’ time on campus focuses primarily on classes, often at the exclusion of other campus involvement” (p. 45).
The implication of this study’s results paired with what we know about the nature of two-year campuses is that faculty, administrators and students must find ways to maximize opportunities for student-to-student and student-to-faculty interactions. Clearly this implies the need to take advantage of face-to-face classroom time, as well as other standard interaction opportunities such as office hours, tutoring and review sessions. Possible mechanisms for maximizing positive social integration through interactions are as follows.
• Design student-centered learning activities such as peer instruction (Crouch & Mazur, 2001) where
students actively engage in small groups to discuss and correct their misunderstandings of common engineering and physics concepts.
• Leverage social media by having faculty and students use tools (e.g. Twitter) to stay connected when on or
off campus.
• Create meaningful online opportunities for student-to-student and faculty-to-student interactions to take
place. This is particularly important given the commuter nature of these institutions. Online discussion forums (synchronous and non) can help students feel connected to other students and faculty even when they are off-campus taking care of work and family obligations (Spatariu, Quinn, & Hartley,2007).
• Create policies that allow for balanced faculty workloads to provide sufficient time to have meaningful
student interactions outside the classroom (e.g. office hours, review sessions, or collaborative faculty-to-student research projects.)
The engineering students and faculty that this study addresses may exemplify these characteristics more so than perhaps other discipline areas at these campuses, because of the intensive nature of the engineering curriculum. Although most classes regardless of discipline tend to have smaller class sizes and a lower student to faculty ratio, the nature of the engineering courses may be particularly beneficial for social integration.
For instance, the common curriculum for these engineering students is highly project- focused and students are explicitly taught to work effectively in teams (Devon, Sathianathan, Saintive, Nowe & Lessene, 1998). Faculty also expend significant effort in creating projects for these students that are can be accomplished effectively as a team (e.g. exemplify the conditions of a successful cooperative learning project - see Smith & McGregor, 1992), and creating projects that are motivating for students. For instance, students may engage in a project to design an aluminum can crusher that can be used at a local girls and boys club to help them learn the value of recycling. Such a project not only allows students to work with each other on a real engineering design and implementation project, but also gives them a taste of what it is like to be an engineer who can positively impact some aspect of society. Projects of this type may be a reason we see a positive relationship between social integration factors and these students’ commitment to completing an engineering degree.
CONCLUSIONS
Two-year institutions are a place where many students begin their studies. As the “Paths to Persistence” report states, it should not be the mission of such institutions to try to change the type of student that they serve, but rather to serve these students more effectively (Bailey & Alfonso, 2005). The current study focuses on a subset of these students – students beginning their engineering studies at two-year institutions. Due to the ongoing and projected shortage of engineers, making the most of this important source of engineering students is increasingly important.
The first two years of the engineering curriculum at the system of institutions we studied is consistent across locations so we chose to use Tinto’s interactionist academic and social integration model to examine their relationships with engineering learning outcomes. Our driving premise is that in order for students who begin engineering studies at a two-year college to succeed and for them to be retained when they continue at the four- year degree granting institution, they need to be prepared in terms of the engineering skills that are represented by these engineering outcomes.
Results show that relationships exist with all three of the engineering outcomes we studied and in particular with the “commitment to engineering” outcome. Further, social integration variables measured by student-to-student and student-to faculty interactions were the most promising for positively predicting engineering outcomes. This is in alignment with prior research on Tinto’s model that shows there is more empirical support for the social integration aspect of the model than the academic integration. Further strength for these results originates from prior research that has shown that by positively influencing commitment to the institution, students are more likely to actually complete their four-year degree (Braxton et al., 1997). Implications for faculty and administrators at two-year institutions are that they need to make the most of the student-to-student and student-to-faculty opportunities for interactions using not only traditional methods (e.g. office hours and in class activities that allow for meaningful interactions) but also taking advantage of online, mobile and social networking tools that can promote and facilitate student and faculty interactions. Although we recognize the need for further studies – most likely qualitative in nature – that better address how these interactions can occur, this study represents an initial step in understanding how two-year institutions can positively impact engineering students’ studies.
AUTHOR BIOGRAPHIES
Rose M. Marra, Ph.D., is a Professor of Learning Technologies at the University of Missouri and has studied engineering education for nearly 20 years. [email protected] 573 882 2877
Chia-Lin Tsai, Ph.D. earned a doctorate in Educational Psychology and is employed as a research data analyst in the Assessment Resources Center at the University of Missouri.
Barbara Bogue, M.S., is an independent educational consultant and former director of the award-winning Penn State Women in Engineering program.
Jean Landa Pytel, Ph.D., is a retired Associate Professor of Engineering Science & Mechanics and former Assistant Dean of Student Services for the Penn State College of Engineering.
REFERENCES
AACC (2010). Community College Fact Sheet. American Association of Community Colleges, Washington, DC. Retrieved May 2, 2012 from http://www.aacc.nche.edu/AboutCC/ Documents/factsheet2010.pdf. Bailey, T.; Calcagno, J.C.; Jenkins, D.; Kienzl, G.; and Leinbach, T. (2005). Community College Student Success:
What Institutional Characteristics Make a Difference? Economics of Education Review, 27(6), 632-645. Bandura, A. (1986). Social foundations of thought and action: A social cognitive theory. Englewood Cliffs, NJ:
Prentice-Hall.
Board, N. S. (2006). Science and Engineering Indicators—2006. Retrieved May 15, 2008 from http://www.nsf.gov/statistics/seind2006/.
Braxton, J. M., Hirschy, A. S., & McClendon, S. A. (2004). Understanding and Reducing College Student Departure: Ashe-Eric Higher Education Report (Vol. 16): Jossey-Bass.
Braxton, J.M., Sullivan, A.S., and Johnson, R. (1997). Appraising Tinto’s theory of college student departure. In J. Smart (Ed.), Higher Education: Handbook of Theory and Research (Vol 12, pp. 107 – 164). New York: Agathon.
Bureau of Labor Statistics. (2010). U. S. Department of Labor, Occupational Outlook Handbook, 2010-11 Edition, Engineers. Retrieved June 2010 from http://www.bls.gov/oco/ocos027. htm.
Carnegie Foundation (2010). The Carnegie Classification of Institutions of Higher Education. Retrieved May 14, 2012 from http://classifications.carnegiefoundation.org/.
Cook, C., Heath, F., & Thompson, R. L. (2000). A meta-analysis of response rates in Web-or Internet-based surveys. Educational and Psychological Measurement, 60(6), 821-836.
Crouch, C. & Mazur, E. (2001). Peer Instruction: Ten years of experience and results. American Journal of Physics, 69¸970 - 977.
Devon, R., Sathianathan, D., Saintive, D., Nowe, M., and Lessene, J. 1998. Alliance by Design: International Student Design Teams, Proceedings of the 1998 ASEE Annual Conference & Exposition, Session 2544, Seattle, WA, June 28-July 1, 1998.
Gibbons, M. (2005). The Year in Numbers. . ASEE, Retrieved 16 January 2007 from http://www.asee.org/publications/profiles/upload/2005ProfileEng.pdf.
Hardy, D. E. with Katsinas, S. G. (2010). Changing STEM Associate’s degree production in Public Associate’s Colleges from 1985 to 2005: Exploring institutional type, gender, and field of study. Journal of Women and Minorities in Science and Engineering, 16(1), 7-30.
Hoffman, E., Starobin, S.S., Laanan, F.S., & Rivera, M. (2010). Role of community colleges in STEM education: Thoughts on implications for policy, practice, and future research. Journal of Women and Minorities in Science and Engineering, 16(1), 85 -96.
Kizart, C. (2014). The Challenges of Persisting First Generation College Students: A Comparison Between Students with TRIO Support and Those Without (Doctoral dissertation, Lindenwood University).
Knapp, L. G., Kelly-Reid, J.E., & Ginder, S.A. (2012). Enrollment in Postsecondary Institutions, Fall 2010;
Financial Statistics, Fiscal Year 2010; and Graduation Rates, Selected Cohorts, 2002-07. NCES 2012-280. National Center for Education Statistics, Institute of Education Sciences, US Department of Education. Kuh, G. D., Kinzie, J., Buckley, J. A., Bridges, B. K., & Hayek, J. C. (2006). What matters to student success: A
review of the literature commissioned report for the national symposium on postsecondary student success: Spearheading a dialog on student success. Washington DC: National Postsecondary Education
Cooperative.
Laanan, F. S., Jackson, D., Darrow, M. (2010). Experiences of Engineering Transfer Students: From Community College To University. Paper presented at the American Society of Engineering Education. Louisville, KY. Marra, R.; Rogers, K.A.; Shen, D.; & Bogue, B. (2009). "A Multi-Year, Multi-Institution Study of Women
Engineering Student Self-Efficacy," Journal of Engineering Education, 98, 1 – 12.
Marra, R.M., Rodgers, K., Shen, D., Bogue, B. (2012). Leaving Engineering: A Multi-Year Single Institution Study. Journal of Engineering Education, 101 (1), 6 – 27.
Mattis, M. C., & Sislin, J. (2005). Enhancing the community college pathway to engineering careers: The National Academies Press.
Mau, W.C. 2003. Factors that influence persistence in science and engineering career aspirations. The Career Development Quarterly 51 (3): 234–43.
Mooney, G. & Foley, D. (2011). Community Colleges: Playing an Important Role in the Education of Science, Engineering, and Health Graduates. InfoBrief. NSF 11-317. 1-6
National Center for Education Statistics (2008). Closer Look 2008: Community College. Retrieved April 13, 2012 from http://nces.ed.gov/programs/coe/analysis/2008-index.asp
NSF. (2004). Women, Minorities and Persons with Disabilities in Science and Engineering. Retrieved October 20, 2010 from http://www.nsf.gov/sbe/srs/nsf03312/start.htm.
Pritchard, M. E., & Wilson, G. S. (2003). Using emotional and social factors to predict student success. Journal of college student development, 44(1), 18-28.
Prospero, M., & Vohra-Gupta, S. (2007). First generation college students: Motivation, integration, and academic achievement. Community College Journal of Research and Practice, 31(12), 963-975.
Provasnik, S., & Planty, M. (2008). Community Colleges: Special Supplement to the Condition of Education 2008 (NCES 2008-033). National Center for Education Statistics, Institute of Education Sciences, US
Department of Education.
Sargent, J.F. (2014). The U.S. Science and Engineering Workforce: Recent, Current, and Projected Employment, Wages, and Unemployment. Washington D.C.: Congressional Research Service.
Schuyler, G. (1999). A Historical and Contemporary View of the Community College Curriculum, New Directions for Community Colleges, 1999(108), 3 – 15.
Smith, B.L., & McGregor, J.T. (1992). What is collaborative learning?” in A. Goodsell, M. Maher, V. Tinto, B.L. Smith, and J.T. MacGregor, (Eds.), Collaborative Learning: A Sourcebook for Higher Education, University Park, PA: National Center on Postsecondary Teaching, Learning, and Assessment, The Pennsylvania State University.
Spatariu, A., Quinn, L.F., & Hartley, K. (2007) A review of the research factors that impact aspects of online discussion quality, TechTrends 51 (3), 44 - 48.
Tinto, V. (1993). Leaving college: Rethinking the causes and cures of student attrition. Chicago: University of Chicago Press.
Tinto,V. (1975) "Dropout from Higher Education: A Theoretical Synthesis of Recent Research" Review of Educational Research vol.45, pp.89-125.
Titus, M. (2004). An examination of the influence of institutional context on student persistence at 4-year colleges and universities: A multilevel approach. Research in Higher Education, 45(7), 673-700.
Titus, M. (2006). Understanding the influence of financial context of institutions on student persistence at 4-year colleges and universities: A multilevel approach. Journal of Higher Education, 77 (2), 353-375. Townsend, B. K., & Wilson, K. B. (2008). The academic and social integration of persisting community college
transfer students. Journal of College Student Retention: Research, Theory and Practice, 10(4), 405-423. Tsapogas, J. (2004). The role of community colleges in the education of recent science and engineering graduates.
InfoBrief NSF04, 315, 1-6.
Vogt, C.M., D. Hocevar, and L.S. Hagedorn. 2007. A Social cognitive construct validation: determining women’s and men’s success in engineering programs. The Journal of Higher Education 78 (3): 337–64.
Webb, M. W. (1990). Development and testing of a theoretical model for predicting student degree persistence at a four-year commuter college. American Educational Research Association, Boston.