Nat. Hazards Earth Syst. Sci., 7, 399–404, 2007 www.nat-hazards-earth-syst-sci.net/7/399/2007/ © Author(s) 2007. This work is licensed under a Creative Commons License.
Natural Hazards
and Earth
System Sciences
A test for checking earthquake aperiodicity estimates from small
samples
M. Mucciarelli
Dept. of Structures, Geotechnics and Engineering Geology, Univ. of Basilicata, Potenza, Italy
Received: 28 February 2007 – Revised: 31 May 2007 – Accepted: 31 May 2007 – Published: 13 June 2007
Abstract. In recent years, many new models for earthquake
recurrence were proposed. Some are focusing on the cluster-ing properties on a small time scale, while others try to model the long term behavior of large mainshocks. To this last pur-pose, there is a growing interest for models that take into ac-count the aperiodicity aiming to a time-dependent hazard es-timate. It is well known that a limited number of inter-event times (IETs) may lead to biased values of the distribution pa-rameters. To overcome this problem different solutions were proposed. This paper focuses on two of them: Monte Carlo simulation of the process and aperiodicity estimated via a sta-tistical proxy. The topics discussed are: 1) how many IETs are needed for a correct estimate, 2) to which extent a Pois-son distribution is equally able to describe the process, 3) the influence of errors associated to paleoseismological IETs, and 4) the goodness of the success ratio from simulations. A simple test is proposed to discriminate real aperiodicity from apparent aperiodicity coming from undersampling.
1 Introduction
The standard Poisson process requires only one parameter to model the occurrence of earthquakes, that is the mean re-currence time (µ). The standard deviation (σ) is assumed to be equal to the mean. The ratioα=σ/µ (coefficient of variation or aperiodicity) is taken as an indication of statisti-cal properties of the relevant time series and used in renewal models for time-dependent hazard analysis. Whenα>1, the time series exhibits clustering properties. Values<1 indicate the possible presence of periodicity, with increasing proba-bility for decreasingα. The Log-normal, Weibull and Brow-nian Passage Time (BPT) models require to estimate from sample data bothµandα. Performing a bootstrap numer-Correspondence to: M. Mucciarelli
ical simulation for 100 realizations of a BPT process with
µ=1 andα=0.5, Ellsworth et al. (1999) showed thatαis un-derestimated when the number of events in the catalogue is small (<10). Parsons (2005) implemented a more sophisti-cated Monte Carlo simulation of a BPT, trying to simulate observed sequences with a range of mean IET and aperiodic-ity. Events were repeatedly drawn at random from each dis-tribution, attempting to match the observed event windows. The two sequences studied occurred both on the San Andreas Fault: 14 event at Wrigthwood (Fumal et al., 2002) and 10 events at Pallet Creek (Sieh et al., 1989). Each distribution was sampled 5 million times, with a success ratio equal to 5.4 10−6for Wrigthwood and 2.8 10−6for Pallet Creek.
400 M. Mucciarelli: Earthquake aperiodicity estimates
probabilistic seismic-hazard analyses in central Italy; Bull. Seism. Soc. Am., 96, 107–132. Parsons, T. (2005) Significance of stress transfer in time-dependent earthquake probability
calculations, J. Geophys. Res., 110, B05S02, doi:10.1029/2004JB003190.
Sieh, K., M. Stuiver, and D. Brillinger (1989) A more precise chronology of earthquakes produced by the San Andreas fault in southern California; J. Geophys. Res., 94, 603– 623.
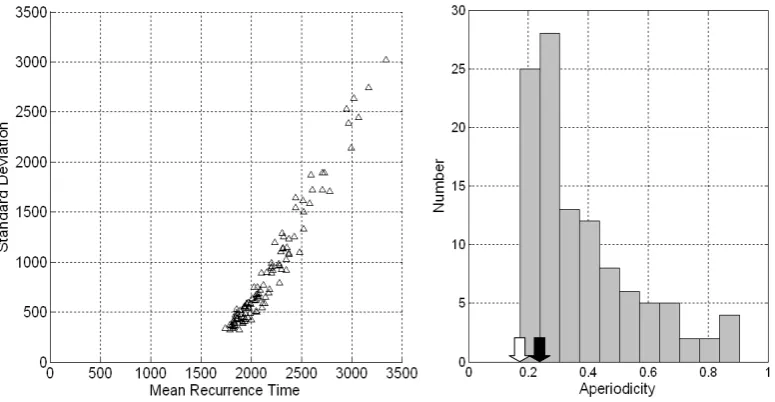
Fig. 1 The distribution of σ versus μ (left) and the histogram of α (right) for 28 seismogenic sources in Central Italy, according with Pace et al. (2006).
Fig. 1. The distribution ofσ versusµ(left) and the histogram ofα(right) for 28 seismogenic sources in Central Italy, according with Pace et al. (2006).
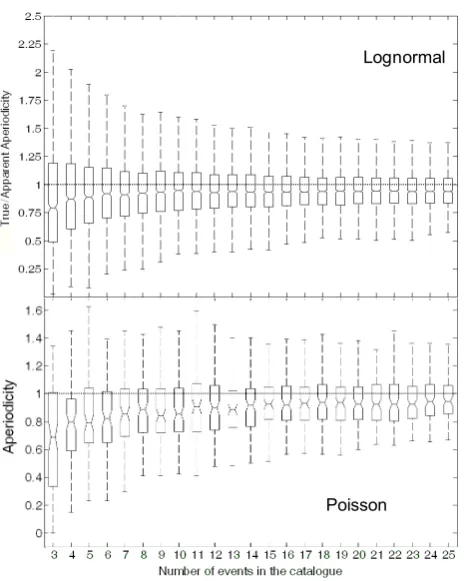
Fig. 2 Numerical estimate of the underestimate of α with a bootstrap procedure on 100 catalogues composed of 100 events each. For the two-parameters distribution the seed values were μ=1 and σ uniformly distributed between 0.95 and 1.05. The investigated parameter is the ratio between the true α and the one retrieved from the synthetic catalogues. For the Poisson case, the statistic is α retrieved from data, or apparent aperiodicity.
Poisson Lognormal
Fig. 2. Numerical estimate of the underestimate ofαwith a boot-strap procedure on 100 catalogues composed of 100 events each. For the two-parameters distribution the seed values wereµ=1 and
σ uniformly distributed between 0.95 and 1.05. The investigated parameter is the ratio between the trueαand the one retrieved from the synthetic catalogues. For the Poisson case, the statistic isα re-trieved from data, or apparent aperiodicity.
– How many IETs are needed for a correct estimate?
– To which extent a Poisson distribution is equally able to
describe the observed processes?
– Which is the influence of errors associated to
paleoseis-mological IETs?
– Which is he reliability of the success ratios obtained
from simulations?
2 Preliminary modeling and simulations
As mentioned above, Ellsworth et al. (1999) showed that for a BPT process the estimate ofαis biased when the number of event is<10. In the following of this paper the ability of a Poisson process to reproduce the observed data will be dis-cussed, so it was interesting to compare the bias in aperiodic-ity estimate between a distribution with two free parameters and one with a single parameter.
The first step was the generation of two sets of 100 cata-logues composed of 100 events each. For the two-parameter distribution (Log-normal or BPT), the values wereµ=1 and
σ uniformly distributed between 0.95 and 1.05. In this case the investigated parameter was the ratio between the trueα
M. Mucciarelli: Earthquake aperiodicity estimates 401
Fig. 3 Bootstrap procedure simulating 100.000 realizations of two Poisson processes having μ estimated from the Fucino data (μ=1498) and from the most recent events of the Pallet Creek sequence (μ=120). For the Pallet Creek data set the comparison is also with or without the request for exact matching of the sequence (less restrictive, exact Poissonian condition; see text for details)
3 4 5 6 7 8 9 10
1E-006 1E-005 1E-004 1E-003 1E-002 1E-001 1E+000 Fucino Pallet Creek Pallet Creek no sequence Su cc e ss R at io
Fig. 3. Bootstrap procedure simulating 100.000 realizations of two Poisson processes havingµ estimated from the Fucino data (µ=1498) and from the most recent events of the Pallet Creek se-quence (µ=120). For the Pallet Creek data set the comparison is also with or without the request for exact matching of the sequence (less restrictive, exact Poissonian condition; see text for details).
that here it is not included the effect on the estimate caused by the “seismic drought” (Davis et al., 1989): this issue will be discussed later. Another important point for further dis-cussions is that for a number of events equal to the longer se-quence available in Italy (5 earthquakes on the Fucino Fault), the apparent aperiodicity for a true Poisson process is 0.8, with 50% of the bootstrap values in the interval 0.70÷1.05. According with Galadini and Galli, the last 5 events on the Fucino fault occurred in 1915 AD, 508-618 AD, 1700-1300 BC, 3944-3516 BC, 5979-5576 BC. There are two previous events, but with a large overlapping time window that pre-vent their use in this analysis. Taking the midpoint of the intervals, the estimate of the parameters isµ=1923.1±389.6 years. The aseismic period since the last event is 91 y (less than 5% ofµ)so according to Davis et al. (1999) the “seis-mic drought” effect is negligible. The aperiodicity estimates givesα=0.2: if compared with Fig. 2, it may seem unlikely that this distribution is Poissonian. More insights on the statistics of the Fucino sequence may come from simulations similar to those proposed by Parsons (2005). Figure 3 reports the results of a bootstrap procedure simulating 100.000 real-izations of two Poisson processes havingµestimated from the Fucino data and from the most recent events of the Pallet Creek sequence. With a limited number of events, a Pois-son process is able to reproduce the sequences with a suc-cess ratio much higher than the one obtained for the full se-quence by Parson (2005) with a BPT process (≈10−6). The simulation was not carried out for the whole Pallet Creek sequence, but the extrapolation of the negative exponential trend in Fig. 3 gives an estimated success ratio≈10−8.
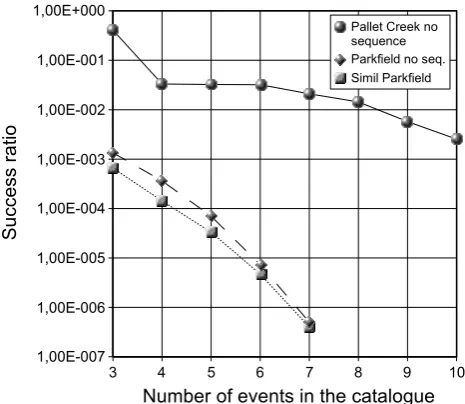
Fig. 4 Bootstrap simulation of Pallet Creek and Parkfield sequences, plus a sequence generated with a
Poisson process with the same μ of Parkfield. The difference in success rate is due to the large
errors in the paleoseismological datations, which are absent in the historical sequence of Parkfield.
3 4 5 6 7 8 9 10
1,00E-007 1,00E-006 1,00E-005 1,00E-004 1,00E-003 1,00E-002 1,00E-001 1,00E+000
Pallet Creek no sequence Parkfield no seq. Simil Parkfield
Number of events in the catalogue
Su cc e ss r a tio
Fig. 4. Bootstrap simulation of Pallet Creek and Parkfield se-quences, plus a sequence generated with a Poisson process with the sameµof Parkfield. The difference in success rate is due to the large errors in the paleoseismological datations, which are absent in the historical sequence of Parkfield.
The simulations were carried out imposing that the se-quence of IETs should match exactly the real one. This makes more sense if one aim to simulate a renewal process, where the memory of the system has to be taken into account. But for a Poisson process, the exact temporal sequence of the IETs is not an issue: it is sufficient that each one of the simu-lated recurrence times falls within the boundary of one (and only one) of the intervals from the real data. This new con-dition on the simulations greatly improves the success ratio. Figure 3 shows what happens to the Pallet Creek data set: the whole sequence can be simulated by a single-parameter Pois-son process with a success ratio 10−3times greater than the
one obtained by Parsons (2006) and 10−5times greater than
the one previously estimated. Thus the conditions imposed on the simulation regarding the memory of the system have a very strong influence on the result.
Fig. 5 ECDFs of aperiodicity from the first n IETs and from the whole sequences that match the Fucino data set (Poisson process, μ=1923 from real data, no restriction on exact sequence).
Fig. 5. ECDFs of aperiodicity from the firstnIETs and from the whole sequences that match the Fucino data set (Poisson process,
µ=1923 from real data, no restriction on exact sequence).
a success ratio much smaller than the Pallet Creek one. The drop in the success ratio is in the range 102−103. It is inter-esting to note that the values obtained for Parkfield are simi-lar to those obtained for Fucino and Pallet Creek sequences in Fig. 3. This means that reducing the errors on paleoseismo-logical data decreased the success ratio of the same amount it is increased by lifting the restrictive condition on the exact match of the sequence.
3 Testing aperiodicity from small samples
The test proposed for checking the earthquake aperiodicity from short catalogues is based on the following assumptions, derived from the insight gained in the previous chapter:
1. When small samples are considered, it is better to start with 1-parameter simulation rather than 2-parameters simulations. If the real sequence has a significant ape-riodicity, it can be observed and proved against the null hypothesis of Poissonian behavior.
2. Dealing with Poisson processes, the restriction on the exact match between observed and simulated sequences can be lifted. Instead, it will be sufficient that each one of the simulated recurrence times must fall within the
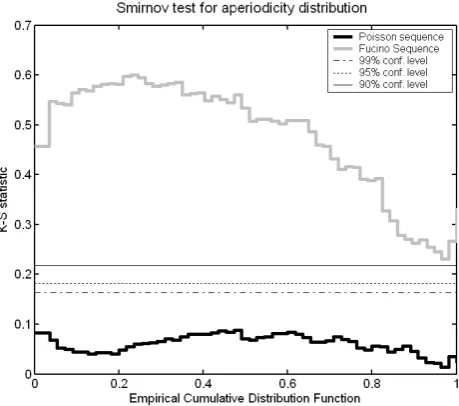
Fig. 6 K-S statistics for the full Fucino sequence (n=4) and for a Poisson process generated with
μ=1923 y and an error similar to the paleoseismological data. The confidence limits refer to the
rejection of equality hypothesis in the Smirnov test.
Fig. 6. K-S statistics for the full Fucino sequence (n=4) and for a Poisson process generated withµ=1923 y and an error similar to the paleoseismological data. The confidence limits refer to the rejection of equality hypothesis in the Smirnov test.
boundary of one (and only one) of the intervals from the real data.
3. The errors on the datation of pre-historic events greatly affect the absolute value of success ratio. Their effect on the trend of success ratio versus the number of events in the catalogue is less important. Thus, the success ratio alone is a poor estimate of the goodness-of-fit of our simulations, given its large variability. Instead, the simulations that match real sequences can be compared against single realization of a Poisson process having the sameµ.
If the above is true, then a simple procedure is implemented in four steps:
1. Generate a set of two-parameters synthetic sequences (S) longer than the real one (R). Repeated test showed that 50 events are sufficient. Then, check for eachS
sequence if firstnIETs match thenIETs of theR se-quence;
2. For theSsequences that pass the above check, estimate the aperiodicity from the firstnIETs (αn)and then from
the whole sequence (α50).
3. Calculate the Kolmogorov-Smirnov statistic (K-S S), that is the absolute value of the maximum difference between the two empirical cumulative distribution func-tions (ECDFs) ofαnandα50;
4. generate a Poisson process with the same µof the R
M. Mucciarelli: Earthquake aperiodicity estimates 403
Fig. 8 The distribution of σ versus μ and the histogram of α obtained for the Fucino sequence with 100.000 trials. The black arrow marks the α obtained for the Fucino fault by Pace et al. (2006), while the white one is the α estimated directly from the data given by Galadini and Galli (1999)
Fig. 7. The distribution ofσversusµand the histogram ofαobtained for the Fucino sequence with 100.000 trials. The black arrow marks theαobtained for the Fucino fault by Pace et al. (2006), while the white one is theαestimated directly from the data given by Galadini and Galli (1999).
5. perform a Smirnov test on the K-SSand K-SR statis-tics. The second one should always pass the test at any significativity level, and act as a control group. If the first set does not pass the test, this means that we may suppose that the real IETs distribution is not Poissonian. Let us examine the practical case of the Fucino sequence. To check if the proposed procedure is reliable also for smaller sequences, the first two steps are performed forn=2,3,4. The results is shown in Fig. 5. The aperiodicity estimated from the whole sequences is much higher, and the mean value is close to 1, as expected for a Poisson process. The aperi-odicity estimated from the firstnIETs yields a much lower value, and the ECDFs are similar for n=2,3,4. Figure 6 shows the K-S statistics for the full Fucino sequence (n=4) and for a Poisson process generated withµ=1923 years and an error similar to the paleoseismological data. While the Kolmogorov-Smirnov test verify if an empirical CDF is dif-ferent from a theoretical one, the Smirnov test checks if the hypothesis that two ECDFs are coming from the same pop-ulation can be rejected. In both cases, the inequality of dis-tributions is proved if the maximum value of K-S statistics exceeds a given confidence level. In this case there are no doubt about rejecting the equality of the ECDFs for the real case. The difference between the ECDF of the aperiodicity estimated for the first 4 IETs and for the full sequence is al-ways greater than the test limits. A collateral advantage of the proposed procedure is that at this point we can use the distribution of aperiodicity estimated from the firstn syn-thetics IETs. Figure 7 shows the distribution ofσ versusµ
and the histogram ofαobtained for the Fucino sequence with 100 000 trials. The success rate is about 1.10−3. The black
arrow marks theαobtained for the Fucino fault by Pace et al. (2006), while the white one is the α estimated directly from the data given by Galadini and Galli (1999). Both ap-pears to a lower bound of the distribution.
4 Discussion and conclusions
The simulation of synthetic sequences of earthquakes on a single fault (Parsons, 2005) proved to be an effective tool for the understanding the time distribution of events. However, the success ratio alone is a poor estimate of the goodness-of-fit of our simulations, given its large variability due to the width of errors on paleoseismological datation and more or less restrictive hypothesis on exact match of real data. A sim-ple technique is proposed to evaluate if the aperiodicity es-timated from short catalogues is real. The test was checked on the longest sequence of earthquakes associated to a single fault in Italy, the Fucino sequence. Even for a reduced num-ber of events, it is possible to reject the hypotehsis that the data are coming from a pure Poisson process.
Edited by: M. Contadakis
Reviewed by: D. Albarello and two other referees
References
Bakun, W. H. and Lindh, A. G.: The Parkfield, California, earth-quake prediction experiment, Science, 229, 619–624, 1985. Davis, P. M., Jackson, D. D., and Kagan, Y. Y.: The longer it has
been since the last earthquake, the longer expected time till the next?: Bull. Seism. Soc. Am., 79, 1439–1456, 1989.
DISS Working Group: Database of Individual Seismogenic Sources (DISS), Version 3.0.2: A compilation of potential sources for earthquakes larger than M 5.5 in Italy and surrounding areas, www.ingv.it/DISS/, 2006.
Fumal, T. E., Weldon II, R. J., Biasi, G. P., Daeson, T. E., Seitz, G. G., Frost, W. T., and Schwartz, D. P.: Evidence for large earth-quakes on the San Andreas fault at the Wrightwood, California, Paleoseismic site: A.D. 500 to present, Bull. Seismol. Soc. Am., 92, 2726–2760, 2002.
Ellsworth, W. L., Matthews, M. V., Nadeau, R. M., Nishenko, S. P., Reasenberg, P. A., and Simpson, R. W.: A Physically-Based Earthquake Recurrence Model for Estimation of Long-Term Earthquake Probabilities, U.S.G.S. Open File 522, 22 pp., 1999.
Galadini, F. and Galli, P.: The Holocene paleoearthquakes on the 1915 Avezzano earthquake faults (central Italy); implications for active tectonics in the central Apennines, Tectonophysics, 308, 143–170, 1999.
Jackson, D. D. and Kagan, Y. Y.: The 2004 Parkfield Earthquake, the 1985 Prediction, and Characteristic Earthquakes: Lessons for the Future, Bull. Seism. Soc. Am., 96, S397–S409, 2006. Pace, B., Peruzza, L., Lavecchia, G., and Boncio, P.: Layered
Seis-mogenic Source Model and Probabilistic Seismic-Hazard Anal-yses in Central Italy, Bull. Seism. Soc. Am., 96, 107–132, 2006. Parsons, T.: Significance of stress transfer in time-dependent earth-quake probability calculations, J. Geophys. Res., 110, B05S02, doi:10.1029/2004JB003190, 2005.